CME Group Profits Rise as Markets Stabilize
April 28 2016 - 8:50AM
Dow Jones News
CME Group Inc. said profit climbed in the first quarter as
trading volume continued to snap back after a rocky end to
2015.
Earnings met analysts' expectations, while the company's 11%
revenue increase edged in below estimates.
The world's biggest futures market, based in Chicago, generates
most of its revenue from transaction fees, which rise and fall with
trading volume. Like other exchange operators, including CBOE
Holdings Inc. and Intercontinental Exchange Inc., CME saw record
trading volume in 2015. Volume slid at the end of the year, though,
as some investors and traders backed away from certain corners of
the market, swooning from global growth concerns and tumbling oil
prices.
But in the first quarter, total volume rose 13% from a year
earlier and 29% from the fourth quarter as fears over the global
economy eased and markets stabilized. CME President Terry Duffy
highlighted record volumes in energy and options, and he noted a
24% jump in trading on the exchange from outside of the U.S.
As trading activity turned higher, CME booked clearing and
transaction fees that rose 12% from a year earlier, to $796.1
million. Such fees represented 85% of the company's top line.
Market data revenue, meanwhile, rose 5.5%, slowing from an 11%
clip in the fourth quarter. Exchanges including CME have worked to
diversify their businesses, with some focusing on data provision as
a source of steady revenue. New York Stock Exchange owner
Intercontinental Exchange Inc., for example, paid $5.2 billion to
acquire financial-data provider Interactive Data Corp. late last
year.
In all, CME reported a profit of $367 million, or $1.09 a share,
up from $330.4 million, or 98 cents a share, a year earlier.
Excluding a loss stemming from a data center lease-back
transaction, among other items, earnings per share rose to $1.15
from 98 cents.
Revenue rose to $934.2 million from $842.7 million. Analysts
projected $1.15 in adjusted per-share profit on $936.1 million in
revenue, according to Thomson Reuters.
Shares in the company, up 4.3% since the start of the year, were
inactive in premarket trading.
Write to Lisa Beilfuss at lisa.beilfuss@wsj.com
(END) Dow Jones Newswires
April 28, 2016 08:35 ET (12:35 GMT)
Copyright (c) 2016 Dow Jones & Company, Inc.
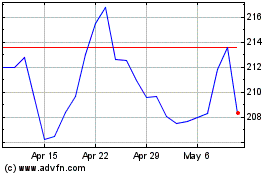
CME (NASDAQ:CME)
Historical Stock Chart
From Mar 2024 to Apr 2024

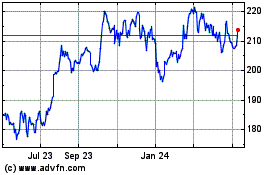
CME (NASDAQ:CME)
Historical Stock Chart
From Apr 2023 to Apr 2024
