Big Lots Inc’s. (BIG) first-quarter 2012
earnings per share of 68 cents missed the Zacks Consensus Estimate
by a penny and marked a decline of 2.9% from 70 cents earned in the
year-ago quarter. Excluding the Canadian operations, earnings came
in at 77 cents a share.
However, including one-time items, earnings came in at 63 cents,
down 10% from the prior-year period.
Sales Details
Big Lots, which operates as a broad-line closeout retailer in
the United States, offers food, health, beauty, plastic, paper,
chemical and pet products as well as home decorative products,
besides other product lines.
The company’s closeout format provides it an edge over
traditional discount retailers as it offers merchandise assortments
to customers at low prices.
Total revenue for the quarter increased 5.5% to $1.29 billion,
up 5.5% from the prior-year period. However, the reported revenue
also missed the Zacks Consensus Estimate of $1.30 billion.
Net sales for U.S. operations increased 2.8%
year over year to $1.26 billion during the quarter. However,
comparable store sales for the U.S. stores inched down 0.8%.
Big Lots experienced a sales decline in the month of April, with
electronics sales bringing the biggest disappointment. However,
management stated that sales of furniture, hardlines and lawn and
garden were quite good.
During the quarter under review, Canadian
operations net sales came in at $32.2 million. Big Lots
started its Canadian operations with 89 stores and 1000 committed
associates, after the company completed the acquisition of
Liquidation World Inc.
The company has been exploring numerous options for more than
two years for entering Canadian turf. Big Lots expects the
acquisition to be accretive to its top line in the coming years,
while generating long-term growth for the company.
Margins Discussion
Adjusted gross profit for the quarter increased 4.8% year over
year to $518 million, whereas gross margin declined 30 basis points
to 40%, reflecting increased markdowns to clear inventory and
higher fuel costs.
Operating profit for the quarter decreased 13.8% year over year
to $74.4 million, whereas operating margin declined 130 basis
points to 5.7%.
Adjusted operating profit for the U.S. operations came in at
$80.6 million, whereas adjusted operating margin declined 40 basis
points to 6.4% during the quarter.
The decrease reflects a 50 basis point increase in selling
general & administrative expenses due to higher depreciation
and occupancy-related costs along with a rise in advertising
expenses. However, these were offset in part by favorable
merchandise mix and reduction in shrink. Canadian segment
reported a net loss of $6.1 million.
Management projects gross margin to be slightly higher than the
prior year, reflecting lower markdowns. Adjusted operating margin
for the U.S. operations are expected to remain flat. For the
second-quarter of 2012, gross margin is expected to be above the
prior-year quarter.
Lowers Forecast
Management now expects fiscal 2012 adjusted earnings to be in
the range of $3.25 to $3.40 per share on a consolidated basis, down
from its prior guidance range of $3.40 to 3.50. For the second
quarter of 2012, the company forecasts earnings in the range of 37
cents to 42 cents per share, indicating a decrease of 26% to 16%
year over year.
For U.S. operations, adjusted earnings are forecasted to be in
the range of 44 cents to 49 cents a share for second-quarter 2012,
reflecting a decline of 15.4% to 5.8% year over year. For Fiscal
2012, earnings are now expected to be in the range of $3.50 to
$3.60 compared with its earlier guidance range of $3.63 to $3.73 a
share.
Management expects second-quarter 2012 comparable store sales in
the US to increase in the range of slightly positive to slightly
negative, with sales increase in the range of 3% to 4%. For fiscal
2012, the company expects comparable store sales to remain flat or
increase by 1%, while total U.S. sales are expected to rise by 5.5%
to 6.5%.
The company earlier forecasted comparable store sales to
increase in the range of 2% to 3%, while total U.S. sales were
expected to rise by 8% to 9%.
Moreover, for fiscal 2012, Canadian sales are forecasted to be
in the range of $142 to $152 million with operating loss of $14 to
$16 million. Management expects Canadian sales to be in the range
of $32 to $35 million and operating loss in the range of $4 to $6
million for second-quarter 2012.
Buybacks & Store Count
Big Lots is returning much of its free cash to shareholders via
share repurchases. After authorizing a share repurchase of $400
million in May 2011, Big Lots authorized an additional $200 million
share repurchase in May 2012.
During the quarter under review, Big Lots spent $99 million to
repurchase 2.5 million shares at an average price of $39.32 per
share, thus completing the $400 million authorization announced in
May 2011.
During the reported quarter, the company opened 10 new stores in
the U.S. and closed 6, bringing the total to 1,454 stores.
Other Financial Details
Based in Columbus, Ohio, Big Lots ended the quarter with cash
and cash equivalents of $82.6 million and shareholders’ equity of
$809.4 million. The company, at the end of the quarter, had no
borrowings under its credit facility.
For the quarter, net cash provided by operating activities was
$125.6 million, while cash flow (operating activities less
investing activities) for the quarter was $108 million. Management
projects cash flow of $190 million for fiscal 2012. The company
incurred capital expenditures of $18.3 million.
Currently, we have a long-term Neutral rating on the stock.
Moreover, Big Lots, which competes with Target
Corporation (TGT), holds a Zacks #3 Rank, translating into
a short-term Hold rating.
BIG LOTS INC (BIG): Free Stock Analysis Report
TARGET CORP (TGT): Free Stock Analysis Report
To read this article on Zacks.com click here.
Zacks Investment Research
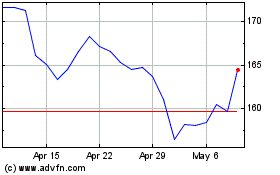
Target (NYSE:TGT)
Historical Stock Chart
From Mar 2024 to Apr 2024

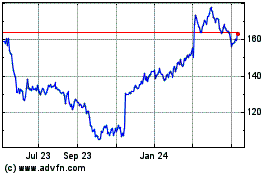
Target (NYSE:TGT)
Historical Stock Chart
From Apr 2023 to Apr 2024
