A successful bid for Deutsche Bank provided the studio with a
turnaround performance in the year and much needed revenue
visibility.
Revenues grew by 83% to GBP909k (2013: GBP496k) and profits up
five fold to GBP292k (2013: GBP58k).
The office retains a high calibre client portfolio including:
The Bank of New York Mellon, JP Morgan, Microsoft, Morgan Stanley
and Tishman Speyer.
Prague
The market for services in the Czech Republic is depressed and
achieving a breakeven result has been a considerable achievement.
The Group's decision to move to a JV arrangement has been
vindicated by recent results. As the studio has considerable design
skills, the Group will remain committed to its continuation as part
of the Group until the economy recovers.
Group costs
Group costs rose to GBP398k (2013: GBP144k). The increase
comprises one off costs in respect of corporate finance and legal
work and the acquisition of SHCE. It also reflects the impacts of
salary reinstatements, the addition of a new non executive director
and an enhanced Head Office team to support the enlarged Group,
together with recruitment fees for those individuals.
Swanke Hayden Connell Europe Limited integration
During the past nine months significant progress has been made
to integrate SHCE into our business model. Both IT platforms and
software systems have been aligned and we have co located our joint
offices in London and Moscow. This has resulted in a significant
capital spend in IT infrastructure and property refurbishment, but
brings identified cost savings that should materialise downstream.
Additionally we have been able to commence joint working on new
projects in order to yield longer term synergies and maximise our
combined expertise on project delivery.
Little of this benefit (but all of the cost) has been seen in
these results. However, our end of year reviews have highlighted
little or no further capex requirements in 2014/15 for either IT or
property (other than volume expansion) and budgets reflect an
ongoing underlying cost saving profile in these areas.
We are pleased to report that the merger will bring the expected
longer term benefits not only in critical mass and brand quality,
but in greater efficiency from our underlying overhead.
Dividends
It is the Board's intention to bring the timing of any future
dividend into line with market practice, declaring final and
interim dividends at the time of our final and interim results,
respectively.
Summary
The 2014 results reflect a considerable improvement in our
underlying performance and the executive directors are confident
that this performance can be maintained as the markets in which we
operate also improve.
 Nicholas Thompson          Beverley Wright
  Chief Executive Officer    Group Finance Director
28 January 2015
Consolidated income statement
For the year ended 30 September 2014
                                          2014       2013
                                       GBP'000    GBP'000
----------------------------------   ---------  ---------
 Revenue                                17,326      8,406

 Sub consultant costs                  (2,594)    (1,290)
-----------------------------------  ---------  ---------
 Revenue less sub consultant
  costs                                 14,732      7,116

 Personnel related costs               (9,868)    (4,751)
 Property related costs                (2,343)    (1,256)
 Other operating expenses              (1,861)    (1,027)
 Other operating income                    404        217
-----------------------------------  ---------  ---------
 Operating profit                        1,064        299

 Finance income                              -          1
 Finance costs                            (18)       (14)
-----------------------------------  ---------  ---------
 Profit after finance costs              1,046        286

 Share of results of associate
  and joint ventures                       354        264
-----------------------------------  ---------  ---------
 Profit before tax                       1,400        550

 Tax charge                              (354)      (176)
-----------------------------------  ---------  ---------
 Profit from continuing
  operations                             1,046        374

 Profit for the year attributable
  to equity
  holders of the Company                 1,046        374
-----------------------------------  ---------  ---------

 Basic and diluted earnings
  per share
 From continuing operations              0.65p      0.26p
 Total earnings per share                0.65p      0.26p
-----------------------------------  ---------  ---------
Consolidated statement of comprehensive income
For the year ended 30 September 2014
                                          2014       2013
                                       GBP'000    GBP'000
----------------------------------   ---------  ---------
 Profit for the year                     1,046        374

 Other comprehensive income:
 Currency translation differences        (103)        (2)
 Currency translation differences
  recycled on discontinued
  operations                                 -          1
-----------------------------------  ---------  ---------
 Other comprehensive income
  for the year                           (103)        (1)

 Total comprehensive income
  for the year
  attributable to equity
  holders of the Company                   943        373
-----------------------------------  ---------  ---------
Consolidated statement of financial position
At 30 September 2014
                                       2014       2013
                                    GBP'000    GBP'000
-------------------------------   ---------  ---------
 Non current assets
 Goodwill                             1,835      1,369
 Other intangible assets                594          -
 Property, plant and equipment          648        326
 Investment in associate                244        190
 Investments in joint ventures          131         39
 Deferred tax                           290        454
--------------------------------  ---------  ---------
 Total non current assets             3,742      2,378

 Current assets
 Trade and other receivables          6,379      3,515
 Current tax                              -        117
 Cash and cash equivalents            1,891      1,343
--------------------------------  ---------  ---------
 Total current assets                 8,270      4,975

 Total assets                        12,012      7,353

 Current liabilities
 Trade and other payables           (6,540)    (4,005)
 Current tax                          (131)          -
 Short term borrowings                (113)      (150)
 Provisions                           (104)       (50)
--------------------------------  ---------  ---------
 Total current liabilities          (6,888)    (4,205)

 Non current liabilities
 Long term borrowings                     -      (113)
 Deferred tax                          (71)        (6)
--------------------------------  ---------  ---------
 Total non current liabilities         (71)      (119)

 Total liabilities                  (6,959)    (4,324)

 Net assets                           5,053      3,029
--------------------------------  ---------  ---------

 Capital and reserves
 Share capital                        1,652      1,456
 Merger reserve                       1,176          -
 Foreign currency translation
  reserve                              (74)         29
 Retained earnings                      148      (898)
 Other distributable reserve          2,151      2,442
--------------------------------  ---------  ---------
 Total equity attributable
  to
  equity holders of the
  Company                             5,053      3,029
--------------------------------  ---------  ---------
Consolidated statement of cash flows
For the year ended 30 September 2014
                                          2014       2013
                                       GBP'000    GBP'000
----------------------------------   ---------  ---------
 Cash flows from operating
  activities
 Cash generated from operations          1,360        646
 Interest paid                            (18)       (14)
 Income taxes received
  / (paid)                                  70         61
-----------------------------------  ---------  ---------
 Net cash inflow from operating
  activities                             1,412        693

 Cash flows from investing
  activities
 Purchase of property,
  plant and equipment                    (523)      (157)
 Sale of property, plant
  and equipment                              4          4
 Acquisition of subsidiary,               (57)          -
  net of cash acquired
 Interest received                           -          1
 Dividends received                        184        210
-----------------------------------  ---------  ---------
 Net cash generated from
  / (used in) investing
  activities                             (392)         58

 Net cash inflow before
  financing activities                   1,020        751

 Cash flows from financing
  activities
 Repayment of bank loans                 (150)      (150)
 Payment of asset finance                    -          -
  liabilities
 Dividends paid                          (291)          -
----------------------------------   ---------  ---------
 Net cash used in financing
  activities                             (441)      (150)

 Net change in cash, cash
  equivalents and
  bank overdraft                           579        601

 Cash and cash equivalents
  and bank
  overdraft at start of
  year                                   1,343        739
 Currency translation differences         (31)          3
 Cash, cash equivalents
  and bank
  overdraft at end of year               1,891      1,343
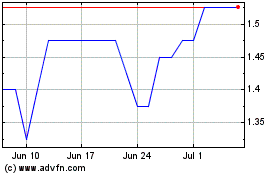
Aukett Swanke (LSE:AUK)
Historical Stock Chart
From Mar 2024 to Apr 2024

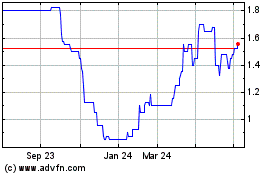
Aukett Swanke (LSE:AUK)
Historical Stock Chart
From Apr 2023 to Apr 2024
