Use these links to rapidly review the document
TABLE OF CONTENTS
PART IV
Table of Contents
UNITED STATES
SECURITIES AND EXCHANGE COMMISSION
Washington, D.C. 20549
FORM 10-K
|
|
|
| ý |
|
ANNUAL REPORT PURSUANT TO SECTION 13 OR 15(d) OF THE SECURITIES EXCHANGE ACT OF 1934 |
For the fiscal year ended September 30, 2015, |
or |
o |
|
TRANSITION REPORT PURSUANT TO SECTION 13 OR 15(d) OF THE SECURITIES EXCHANGE ACT OF 1934 |
For the transition period
from to
|
Commission file number 1-32459
HEADWATERS INCORPORATED
(Exact name of registrant as specified in its charter)
|
|
|
Delaware
(State or other jurisdiction of
incorporation or organization) |
|
87-0547337
(I.R.S. Employer
Identification No.) |
10701 South River Front Parkway, Suite 300
South Jordan, Utah
(Address of principal executive offices) |
|
84095
(Zip Code) |
(801) 984-9400
(Registrant's telephone number, including area code)
Securities
registered pursuant to Section 12(b) of the Act: None
Securities
registered pursuant to Section 12(g) of the Act: Common Stock, $.001 par value
Indicate
by check mark if the registrant is a well-known seasoned issuer, as defined in Rule 405 of the Securities
Act. Yes ý No o
Indicate by check mark if the registrant is not required to file reports pursuant to Section 13 or Section 15(d) of the
Act. Yes o No ý
Indicate by check mark whether the registrant (1) has filed all reports required to be filed by Section 13 or 15(d) of the Securities Exchange Act of
1934 during the preceding 12 months (or for such shorter period that the registrant was required to file such reports), and (2) has been subject to such filing requirements for the past
90 days. Yes ý No o
Indicate by check mark whether the registrant has submitted electronically and posted on its corporate Web site, if any, every Interactive Data File required to be
submitted and posted pursuant to Rule 405 of Regulation S-T during the preceding 12 months (or for such shorter period that the registrant was required to submit and post such
files). Yes ý No o
Indicate by check mark if disclosure of delinquent filers pursuant to Item 405 of Regulation S-K is not contained herein, and will not be contained,
to the best of registrant's knowledge, in definitive proxy or information statements incorporated by reference in Part III of this Form 10-K or any amendment to this
Form 10-K. o
Indicate by check mark whether the registrant is a large accelerated filer, an accelerated filer, a non-accelerated filer, or a smaller reporting company.
|
|
|
|
|
|
|
| Large accelerated filer ý |
|
Accelerated filer o |
|
Non-accelerated filer o
(Do not check if a
smaller reporting company) |
|
Smaller reporting company o |
Indicate
by check mark whether the registrant is a shell company (as defined in Rule 12b-2 of the
Act). Yes o No ý
The aggregate market value of the common stock held by non-affiliates of the registrant as of March 31, 2015 was $1,313,782,947, based upon the closing
price on the New York Stock Exchange?reported for such date. This calculation does not reflect a determination that persons whose shares are excluded from the computation are affiliates for any other
purpose.
The
number of shares outstanding of the registrant's common stock as of October 30, 2015 was 73,900,098.
DOCUMENTS INCORPORATED BY REFERENCE
Portions of the registrant's definitive proxy statement to be issued in connection with registrant's annual meeting of stockholders to be held in 2016 are
incorporated by reference into Part III of this Report on Form 10-K.
Table of Contents
TABLE OF CONTENTS
Forward-looking Statements
This Annual Report on Form 10-K contains forward-looking statements relating to Headwaters' operations
that are based on management's current expectations, estimates and
projections about the industries in which Headwaters operates. Words such as "may," "should," "anticipates," "expects," "intends," "plans," "targets," "forecasts," "projects," "believes," "seeks,"
"schedules," "estimates," "budgets," "goals," "outlook" and similar expressions are intended to help identify such forward-looking statements. Forward-looking statements include Headwaters'
expectations as to the managing and marketing of coal combustion products, the production and marketing of building products, the sales to oil refineries of residue hydrocracking catalysts, the
development, commercialization, and financing of new products and other strategic business opportunities and acquisitions, and other information about Headwaters which are
2
Table of Contents
not purely historical by nature, including those statements regarding Headwaters' future business plans, the operation of facilities, the availability of feedstocks, and the marketability of the coal
combustion products, building products and catalysts. These statements are not guarantees of future performance and are subject to certain risks, uncertainties and other factors, many of which are
beyond the Company's control and are difficult to predict. Therefore, actual outcomes and results may differ materially from what is expressed or forecasted in such forward-looking statements. The
reader should not place undue reliance on these forward-looking statements, which speak only as of the date of this report. Unless legally required, Headwaters undertakes no obligation to update
publicly any forward-looking statements, whether as a result of new information, future events or otherwise. Among the important factors that could cause actual results to differ materially from those
in the forward-looking statements are: changing feedstock and energy prices; actions of competitors or regulators; technological developments; potential disruption of the Company's production
facilities, transportation networks and information technology systems due to war, terrorism, malicious attack, civil accidents, political events, civil unrest or severe weather; potential
environmental liability or product liability under existing or future laws and litigation; potential liability resulting from other pending or future litigation; changed accounting rules under
generally accepted accounting principles promulgated by rule-setting bodies; and the factors set forth under the heading "Risk Factors" in the Company's Annual Report on Form 10-K, quarterly
reports on Form 10-Q and other periodic reports. In addition, such results could be affected by general domestic and international economic and political conditions and other unpredictable or
unknown factors not discussed in this report which could have material adverse effects on forward-looking statements.
Our
internet address is www.headwaters.com. There we make available, free of charge, our annual report on Form 10-K, quarterly reports on Form 10-Q, current reports on
Form 8-K and any amendments to those reports, as soon as reasonably practicable after we electronically file such material with, or furnish it to, the Securities and Exchange Commission (SEC).
Our reports can be accessed through the investor relations section of our web site. The information found on our web site is not part of this or any report we file with or furnish to the SEC.
3
Table of Contents
PART I
ITEM 1. BUSINESS
General Development of Business
Headwaters Incorporated ("Headwaters"®) is a building materials company operating in the building products and construction
materials sectors. Our vision is to improve lives through innovative advancements in building products and materials. We sell building products such as manufactured architectural stone, siding
accessory products, roof products and concrete block. We also market coal combustion products ("CCPs"), including fly ash which is primarily used as a partial replacement for portland cement in
concrete.
We
conduct our business through the following three reporting segments: building products, construction materials and energy technology. We have limited involvement in the energy sector
where we sell catalytic materials to certain refineries engaged in heavy oil upgrading. We sold our other energy related businesses, including the business of reclaiming waste coal, which is presented
as a discontinued operation.
Building Products. This segment has established leading positions in several product categories in the building products sector, and is
currently our
largest reporting segment based on revenue.
We
are a leading designer, manufacturer and marketer of siding accessories used in residential repair and remodeling and new residential construction applications. Our siding accessories
include decorative window shutters, gable vents, mounting blocks, and window and door trim products. We also market functional shutters, specialty siding products and window wells. Our siding
accessory sales are primarily driven by the residential repair and remodeling market and, to a lesser extent, by the new residential construction market.
We
are a leading producer of manufactured architectural stone. Eldorado Stone®, our largest stone brand by revenue, is designed and manufactured to be one of the most
realistic manufactured architectural stone products in the world. Our two additional brands are marketed at different price points in the manufactured architectural stone market, allowing us to
compete across a broad spectrum of customer profiles. Our manufactured stone sales primarily are driven by new residential construction, but we also sell product in the repair and remodel and
commercial construction markets.
We
have three product categories in specialty roofing. We manufacture and market resin-based roofing tiles through the InSpire® and Aledora® brands. In December
2013, we acquired an 80% equity interest in the business of a leading Florida manufacturer of concrete roof tiles sold under the Entegra® brand primarily in the Florida market. In May
2014, we
acquired the assets of a leading U.S. manufacturer of stone-coated metal roofing materials. We market stone-coated metal roofing in the United States under the Gerard® and
Allmet® brands.
We
believe we are the largest manufacturer of concrete block in the Texas market, offering a variety of concrete-based masonry products through regional branding and distribution. A
large portion of our concrete block sales is generated in the Texas institutional construction market, but we also serve the commercial and new residential construction markets.
Our
building products segment has a large customer base, including one-step and two-step wholesale distributors, retailers such as The Home Depot and lumber yards. We also sell certain
products directly to contractors. As a result, sales are broadly diversified across the country geographically as well as by distribution channel. We believe we attract a large base of customers
because we have a wide assortment of high quality products with strong brand recognition.
4
Table of Contents
Construction Materials. We have a leading U.S. position in the marketing of fly ash in the construction materials sector, and the
marketing and
management of fly ash is our second largest reporting segment based on revenue.
We
procure fly ash from coal-fueled electric generating utilities and supply it to our customers as a partial replacement for portland cement in the production of concrete. CCPs, such as
fly ash and bottom ash, are the non-carbon components of coal that remain after coal is burned.
Fly
ash is most valuable when used as a mineral admixture to replace a portion of the portland cement used in concrete. Concrete made with fly ash has better performance characteristics
than concrete made only from portland cement, including improved durability, decreased permeability and enhanced corrosion resistance. Further, concrete made with CCPs typically is easier to work with
than concrete made only with portland cement, due in part to its better pumping and forming properties. Because fly ash can be substituted for a portion of the portland cement used in concrete and is
generally less expensive per ton than portland cement, the total per cubic yard cost of concrete made with fly ash can be lower than the cost of concrete made exclusively with portland cement.
According to a 2011 report sponsored by us from the American Road and Transportation Builders Association, the recycling of fly ash into concrete saves federal and state governments more than
$5 billion annually in infrastructure costs, based on the initial price savings of fly ash relative to portland cement and the longer durability of concrete made with fly ash.
In
order to ensure a steady and reliable supply of CCPs, we enter into long-term, exclusive supply agreements with coal-fueled electric generating utilities. Our supply chain includes
stand-alone CCP distribution terminals strategically located to provide customer access to CCPs, as well as direct customer service at plant sites. Our extensive distribution network allows us to
transport CCPs significant distances to meet customer demand when supplies in local markets are unavailable.
A
substantial majority of our CCP revenue comes from sales to an extensive customer base that uses fly ash for the partial replacement for portland cement in concrete. These customers
are primarily ready mix concrete producers, but also include paving contractors and other manufacturers of concrete products. Our customers typically operate in limited geographical areas because of
the high cost of transporting concrete and concrete products, but we sell fly ash in multiple regions across the country utilizing our broad sources of supply and our efficient distribution system.
In
addition to our focus on long-term contracts with utilities and bolt-on acquisitions to increase supply of CCPs, we plan to grow our construction materials business by increasing the
percentage of fly ash used as a mineral admixture for the partial replacement of portland cement and expanding the use of CCPs through market recognition of the performance, economic and environmental
benefits of CCPs. Based on Portland Cement Association and American Coal Ash Association data, we estimate that for calendar 2013, fly ash replaced approximately 16% of the portland cement that
otherwise would have been used in concrete produced in the United States.
Energy Technology. We are involved in heavy oil upgrading processes through the sale of our HCAT® catalyst material. The HCAT
technology
is a proprietary process that uses a liquid catalyst precursor to facilitate hydrogen transfer within the most difficult to upgrade, bottom-of-the-barrel feedstocks, enabling refiners to increase
conversion or throughput with less fouling. Our HCAT technology is recognized in the industry as a commercially proven technology, based on continued operations for more than three years at our
initial customer location.
We
formerly owned and operated 11 coal cleaning facilities capable of separating ash from waste coal to provide a refined coal product that is higher in Btu value and lower in impurities
than the feedstock coal and which can generate refined coal tax credits under Internal Revenue Code Section 45. In September 2011 we committed to a plan to sell all of our coal cleaning
facilities. During 2012 we sold one facility, and in 2013, we sold the remaining ten facilities.
5
Table of Contents
Headwaters
was incorporated in Delaware in 1995. Our stock trades under the New York Stock Exchange symbol "HW."
As
used herein, "Headwaters," "combined company," "we," "our" and "us" refer to Headwaters Incorporated and its consolidated subsidiaries, including Tapco International Corporation and
its subsidiaries, Entegra Holdings, LLC and its subsidiaries, Gerard Roof Products, LLC and its subsidiary, Headwaters Construction Materials, Inc. and its subsidiaries, Eldorado
Stone LLC, and its subsidiaries and affiliates (operating in our building products segment); Headwaters Resources, Inc. and its subsidiaries (operating in our construction materials
segment); Headwaters Plant Services, Inc. (operating in our construction materials segment); Headwaters Heavy Oil, LLC and Headwaters Technology Innovation Group, Inc. ("HTI,"
operating in our energy technology segment); and Headwaters Energy Services Corp. and its subsidiaries (formerly operating in our energy technology segment); unless the context otherwise requires. As
used in this report, Headwaters Building Products or "HBP" refers to Tapco International Corporation and its subsidiaries, Entegra Holdings, LLC and its subsidiaries, Gerard Roof
Products, LLC and its subsidiary and to Headwaters Construction Materials, Inc., together with its subsidiaries including "Eldorado", which refers to Eldorado Stone LLC and its
subsidiaries and affiliates); "HRI" refers to Headwaters Resources, Inc. and its consolidated subsidiaries; "HPS" refers to Headwaters Plant Services, Inc.; "HTI" refers to Headwaters
Heavy Oil, LLC and Headwaters Technology Innovation Group, Inc.; and "HES" refers to Headwaters Energy Services Corp., together with its consolidated subsidiaries and affiliates; unless
the context otherwise requires.
Building Products
We
have leading product groups in siding accessories, manufactured architectural stone, concrete block and specialty roofing. We manufacture and distribute nationally siding accessories
(such as window shutters, gable vents, mounting blocks, trim, moulding, and simulated wood shake siding) and
6
Table of Contents
professional
tools used in exterior residential remodeling and new residential construction. Our manufactured architectural stone has a national presence in commercial, residential and remodeling
markets. We manufacture and sell concrete roof tiles in Florida and distribute nationally resin-based composite roof shingles and stone-coated metal roofing products. We also are a leading supplier of
concrete blocks and specialty blocks in Texas. We believe our traditional building products and new product offerings position us for significant growth as residential remodeling and new residential
construction activity continue to improve.
Siding and Exterior Siding Accessories. We are a leading designer, manufacturer and marketer of resin-based siding accessories and
professional tools
used in exterior residential home improvement and construction under multiple brands. These products, which are either injection-molded or extruded, enhance the appearance of homes and include
decorative window shutters, gable vents, and mounting blocks for exterior fixtures, roof ventilation, trim board and moulding products, specialty siding products and window well systems. Professional
tools include portable cutting and shaping tools used by contractors, on-site, to fabricate customized aluminum shapes that complement the installation of exterior siding.
We
market nationally our injection-molded building product accessories primarily to one-step distributors, and also market to big-box stores and manufactured housing. In addition, we
market tools, functional shutters, specialty siding products, window wells, and cellular PVC trim board and moulding.
These
building products principally serve applicator needs for siding and siding accessories. Our injection-molded products are designed to enhance the exterior appearance of the home
while delivering durability at a lower cost compared to similar aluminum, wood and slate products.
Manufactured Architectural Stone. Under the Eldorado Stone®, Dutch Quality Stone® and StoneCraft™ brands, we
offer a wide variety of high-quality manufactured architectural stone products to meet a variety of design needs and price points. Our manufactured architectural stone siding incorporates several key
features, including high aesthetic quality, ease of installation, durability, low maintenance, attractive cost relative to other siding materials and widespread availability in the marketplace. Our
largest brand by revenue, the Eldorado Stone brand is designed and manufactured to be one of the most realistic manufactured architectural stone products in the world.
Our
manufactured architectural stone siding is a lightweight, adhered siding product recommended or used by national, regional and local architectural firms, real estate developers,
contractors, builders and homeowners. Our stone products are used in construction projects ranging from large-scale residential housing developments and commercial projects to do-it-yourself home
improvement jobs. In addition, our manufactured stone product lines are used in a variety of external and internal home applications such as walls, archways, fireplaces, patio kitchens, and
landscaping. We continually introduce new products in order to improve our offering, such as outdoor fire bowls, fireplace surrounds, and thin-cut natural stone.
We
believe that our focus on product quality, breadth and innovation, combined with a geographically diversified manufacturing platform, provides us with significant marketing advantages
over traditional materials such as natural stone, brick or stucco. Our stone group has implemented a home builder marketing effort, enabling national home builders to have ready access to bundled
packages of the full line of Headwaters stone division products, including stone and brick veneer from Eldorado Stone®, Dutch Quality Stone® and StoneCraft™, as
well as Eldorado fireplace surrounds, Eldorado outdoor signature kitchens and artisan fire bowls.
Specialty Roofing Products. We have three product categories in specialty roofing, including resin-based composite, concrete, and
stone-coated metal
roofing products. We manufacture and market resin-based roofing tiles through the InSpire® and Aledora® brands. In December 2013, we acquired an 80% equity interest in the
business of a leading Florida manufacturer of high quality concrete roof tiles and
7
Table of Contents
accessories
sold under the Entegra® brand primarily in the Florida market. Many Entegra one-step distribution customers are already customers of other Headwaters products. Entegra provides
us with additional sales and distribution opportunities for building products in a large and growing state in the U.S. We believe that the centralized location of Entegra's manufacturing plant in
Florida, the quality of its contractor and customer relationships, and the scope of its products and services provide a strong competitive advantage.
In
May 2014, we acquired the assets of a leading U.S. manufacturer of stone-coated metal roofing materials. We market stone-coated metal roofing in the United States under the
Gerard® and Allmet® brands. With the durability of metal but the appearance of more traditional shingles or tiles, the stone-coated metal roofing product complements our
resin-based composite and concrete-based specialty roofing products, broadening our products as well as our geographic footprint in the specialty roofing category. Our roofing product sales are
heavily dependent on residential repairs, often necessitated by certain extreme weather events, such as strong winds or hail, and to a lesser extent on new residential construction.
Concrete Block. We believe we are the largest manufacturer and seller of concrete block in the Texas market, which is one of the
largest markets for
block products in the U.S. We offer a variety of concrete-based masonry products including standard grey block, split faced block, ground face block, polished block and textured block. Our product
offerings allow us to meet a range of architectural specifications for concrete block and other products. We employ a regional branding and distribution strategy. A large portion of our concrete block
sales are generated from institutional construction markets in Texas, including school construction. In September 2015 we purchased the assets of a central Texas-based distributor of block and other
masonry products to increase our sales and distribution in that area.
We conduct manufacturing, distribution and sales operations for resin-based siding accessories and ancillary products at four
facilities. Manufacturing assets include injection molding presses, many of which are automated through robotics or conveyor systems which have reduced cycle times and have helped to reduce waste.
Nonconforming output is reused as raw material, further minimizing waste.
Our
manufactured architectural stone brands are currently manufactured through a network of five plants and two distribution facilities. We continually focus on safety, quality and
service while reducing the cost of the manufactured architectural stone.
Our
three specialty roofing products are produced in four manufacturing facilities. While resin and stone coated metal roofing products are distributed nationally from three locations,
concrete tile is manufactured locally for the Florida market.
We
operate six modern concrete block manufacturing facilities. Our block operations are located to provide coverage of all the key metropolitan areas in Texas and Baton Rouge, Louisiana,
and to lower transportation costs and gain efficiencies by concentrating the manufacturing of specific products in fewer facilities.
Our resin-based siding products' sales and marketing organization supports one-step and two-step distribution and retail channels
through an extensive sales network that includes independent sales representatives and a group of business development managers, regional sales managers and sales executives.
Our
manufactured architectural stone products sales force works directly with one-step and two-step masonry distributors as well as architects and contractors to provide information
concerning
8
Table of Contents
the
aesthetic, physical and installation attributes of our manufactured stone product. Specialty roofing products are marketed through a direct sales force and a network of independent sales
representatives through one-step and two-step distribution.
Our
block sales personnel work directly with contractors and participate in the bidding process for large institutional and commercial projects. Often, the sales process starts with
architects having our products specified on construction projects.
Roofing
products are primarily sold through one-step distributors, although we also supplement sales directly to roofing contractors in certain circumstances. In addition to our four
manufacturing sites, we have three distribution centers to facilitate customer service.
We
maintain relationships with local contractors, professional builders, and other end-users by participating each year in many local and national shows. Local shows, sponsored by local
distributors, enable us to promote our products through hands-on comparisons to competing products. These shows enable us to receive useful feedback from local contractors, which may lead to new
product ideas as well as significant goodwill within the trade.
Resin-based siding accessories and our ancillary products are distributed throughout the United States and Canada through five primary
distribution channels: one-step distributors that sell directly to contractors, two-step distributors that sell our products to lumber yards and one-step distributors, retail home centers/mass
merchandisers, direct sales to lumber yards, and manufactured housing.
Manufactured
architectural stone is distributed throughout North America, Europe and Asia primarily on a wholesale basis through a network of distributors, including masonry and stone
suppliers, roofing and siding materials distributors, fireplace suppliers and other contractor specialty stores. We also distribute some brands through national retail home centers.
Resin-based
roofing products are distributed in North America and Europe through one-step and two-step distribution. Stone-coated metal roofing is distributed in North America, Europe,
Asia and Africa through one-step distribution, specialty roofing supply yards, and direct sales to roofing and home improvement contractors. Concrete roof tiles are distributed in Florida through
one-step distribution, specialty roofing supply yards and direct sales to roofing contractors.
We
distribute our concrete block products directly to masonry and general contractors as well as through national and regional retail home centers.
We have a large customer base for our building products in the residential home improvement and new home construction markets that
include many retail customers and siding wholesalers across North America and to a lesser extent, in Europe and Asia. Sales are diversified across customers and ship-to locations, mitigating the
impact of regional economic circumstances.
The primary raw materials purchased for resin-based siding and roofing products are polypropylene and PVC which are available for
purchase from multiple suppliers. We also use comparatively small amounts of styrene. From time to time, prices for some of the raw materials used in production and assembly processes fluctuate
significantly. Although we do not have any long-term contracts with suppliers and we purchase supplies on a purchase order basis, we occasionally make volume purchases of materials at fixed prices.
9
Table of Contents
We purchase cement, sand and aggregates as primary raw materials for our concrete-based products. We do not have long-term contracts for the supply of these
materials and demand for these materials can be volatile while supplies are constrained to local sources because of transportation costs. Our costs to purchase raw materials have risen in some regions
for certain materials. However, we have not suffered from any long-term shortages and believe that supplies will be adequate in the future.
The
primary feedstocks for our stone-coated metal roofing products are rolled steel, stone chips and coatings. We do not purchase these materials under long term supply contracts, but
benefit from long term supplier relationships. We have not suffered any shortages and believe that feedstock supplies will be adequate in the future. Our raw stone-coated metal roofing feedstock costs
have risen gradually in recent years.
We have a leading market position in our legacy siding accessory products because of our strong ability to manufacture and distribute a
broad range of products economically and rapidly. However, our strong market position suggests that future growth will come largely from improved demand for building products as the construction
sector of the economy continues to strengthen, not from increasing market share in the siding accessories category. We believe that we have gained market share in our newer accessory products like
specialty siding and trimboard. We have developed a recognized name in the manufactured architectural stone industry and a strong market share because of service, excellent authenticity and broad
selection. Our architectural stone products use a multi-channel distribution network, but we face strong competition from other stone producers in the one-step channel and with products sold directly
to contractors. Our specialty roofing products primarily compete against high-end roofing alternatives such as upper end asphalt, concrete, metal and other niche roofing products. Our block business
is not national in breadth, although it enjoys a strong regional market position in Texas and Louisiana, facing competition from other Texas and Louisiana block manufacturers.
Our
primary competition for resin-based siding products includes Ply Gem, Royal, and Alpha in the siding accessories market, Azek in the trimboard market, and CertainTeed in the
specialty siding market. Notwithstanding our national position as a leading producer of manufactured architectural stone, we face significant competition from other national and regional producers of
similar products, such as Boral Material Technologies Inc. and Coronado Stone Products. Our specialty roofing products also compete against national and regional manufacturers of similar
products, such as Boral, Davinci, Decra, Owens Corning, GAF, Hanson, Eagle and Metro, as well as other types of roofing materials. With respect to concrete masonry units, national and regional
competition includes Featherlite, IPC Building Products, Pavestone, Revels Block & Brick and Jewell Concrete Products. Many of our competitors have significant financial and other resources and
may be able to take advantage of acquisitions and other opportunities more readily than we can.
Construction Materials—Coal Combustion Products
We are the nation's largest manager and marketer of CCPs, including fly ash, a mineral admixture that may be used as a partial
replacement for portland cement in concrete. In order to ensure our supply of CCPs, we have formed numerous long-term exclusive supply and service agreements with coal-fueled electric generating
utilities throughout the United States and maintain stand-alone CCP distribution terminals across North America, as well as plant-site supply facilities. With our extensive distribution network, we
can transport CCPs significant distances to states that have limited coal-fueled electric utilities producing CCPs yet historically have been high volume CCP markets.
10
Table of Contents
CCPs consist of several major classifications of inorganic residuals collected after coal is consumed in coal-fired power plants.
Whereas a significant amount of CCPs are disposed by utilities without being used beneficially, when properly managed CCPs can be valuable products. We sell the most valuable CCP, fly ash, for the
partial replacement for portland cement in a wide variety of concrete applications, including infrastructure, commercial, and residential construction. We believe we are currently the largest manager
and marketer of CCPs in the United States, delivering fly ash to ready mix customers in most regions of the United States. We have a number of long-term, exclusive management contracts with
coal-fueled utilities throughout the United States and provide CCP management services at plant-site locations.
Utilities
produce CCPs year-round. In comparison, sales of CCPs are impacted by seasonality, following construction market demands, peaking in the summer months and declining in the
winter. If CCPs are not used in the winter months, they must be disposed of or stored.
CCPs
are produced at power plant sites and must be transported to the point of consumption, including thousands of ready mix locations across the country. Due to transportation costs,
the CCP market is generally regional. Product transportation to areas that have few coal-fueled electric utilities producing high quality CCPs adds significantly to the cost, but creates a competitive
advantage for us due to our robust distribution system.
As
the largest manager and marketer of CCPs in the United States, we benefit from contractual supplies and our extensive distribution system. We maintain stand-alone CCP distribution
terminals across North America, as well as plant-site supply facilities. In addition, we have area managers and technical sales representatives nationwide to provide customer support.
We
provide services as an integrated component of our work with coal-fueled utilities and their production of CCPs. We focus on providing industrial services to utilities that include
constructing and managing landfill operations, operating and maintaining material handling systems and equipment maintenance. These are services that enhance our reputation in the marketing of fly ash
and that strategically position us as an integrated manager of CCPs. We have more than three decades of experience designing, permitting, constructing, operating and closing solid waste disposal
operations for
utilities and other industrial clients. We currently provide such services to some of the largest utilities in the United States.
The
complexity of CCP disposal operations is expected to increase as new environmental regulations are adopted. Many utilities may be forced to upgrade disposal practices or convert to
new types of disposal. As new disposal regulations are adopted, we plan to use our experience with landfill operations, pond cleanouts, converting disposal operations from wet to dry handling,
designing and managing systems for handling flue gas desulphurization materials, and deploying systems for improving fly ash quality to expand our business. By providing such services to utilities, we
expect to improve our position as the leading manager and marketer of fly ash in the United States.
The
benefits of CCP use in construction applications include improved product performance, cost savings and positive environmental effects. Fly ash improves the performance of concrete,
decreasing permeability and enhancing durability while providing environmental benefits. Fly ash utilization conserves landfill space as well as conserves energy and reduces greenhouse gas emissions.
According to the U.S. Environmental Protection Agency ("EPA"), one ton of fly ash used as a mineral admixture in the partial replacement of portland cement eliminates approximately one ton of carbon
dioxide emissions associated with cement production. The value of utilizing fly ash in concrete has been recognized by a number of federal agencies, including the U.S. Department of Energy, the U.S.
Department of Transportation, and the EPA. Today almost all states specify or recommend the use of
11
Table of Contents
fly
ash in state and federal transportation projects. See "Business—Regulation" and "Risk Factors" for a description of regulatory actions that may affect the supply, management, and
disposition of CCPs.
Higher-quality
fly ash and other high-caliber CCPs possess greater value than low quality CCPs because of their diverse, higher-margin commercial uses. The quality of fly ash produced by
the combustion process at coal-fueled facilities varies widely and is affected by the type of coal feedstock used and the boiler operations of the utilities. We assist our utility clients in their
efforts to improve the production of high-value CCPs at their facilities. Our quality control system ensures customers receive their specified quality of CCPs while our relationships with utilities,
transportation equipment and terminal facilities provide stable and reliable supply. Recently, we implemented our proprietary technology addressing one of the more prominent reasons for poor ash
quality, i.e., high levels of native or activated carbon in the ash. In many cases, higher carbon ash treated with our additive results in ash that meets specifications for the replacement of
portland cement.
Expansion of Market Awareness of CCPs' Benefits. Customer demands for quality and reliability drive our CCP marketing and sales
program. Our
marketing efforts emphasize availability, performance and environmental benefits of CCP usage. We participate in a variety of marketing activities to increase fly ash sales, including professional
outreach, technical publications, relationships with industry organizations, and involvement in legislative and regulatory initiatives planned to lead to greater use of CCPs.
New Technologies for CCP Utilization. Our research and development activities focus on expanding the use of CCPs and decreasing
landfill disposal.
For example, although generally unsuitable for use in traditional concrete applications, we developed and offer for sale two products that utilize the type of fly ash generated at fluidized bed
combustion ("FBC") power plants. Stabil-Mix®, a mixture of fly ash and lime used for roadbed stabilization, may be custom blended for optimum results in varying soil conditions. Pozzalime
takes advantage of the lower SO3 and free lime content of some sources of FBC ash to create a product suited for use as a partial cement replacement in the manufacture of concrete masonry
units.
Technologies to Improve Fly Ash Quality. We developed technologies that maintain and improve the quality of CCPs, further enhancing
their
marketability. Today, many utilities are switching fuel sources, changing boiler operations and introducing activated carbon and ammonia into the exhaust gas stream in an effort to meet increasingly
stringent emissions control regulations. While these factors may negatively affect fly ash quality, we are addressing these challenges with the development and commercialization of two
technologies—RestoreAir®, which treats unburned carbon and activated carbon in fly ash to minimize carbon's adverse effects on concrete's freeze-thaw characteristics. We also
introduced technology that mitigates the impact of ammonia contaminants in fly ash.
Most of our construction materials customers purchase CCPs for beneficial use. A substantial majority of our CCP revenue comes from
sales to customers who use fly ash as a mineral admixture for the partial replacement of portland cement in concrete. These customers are primarily ready mix concrete producers, but also include
paving contractors and manufacturers of concrete products. CCPs are also used by some customers for soil stabilization, road base and other applications. Although our customers typically operate in
limited regions because of the high cost of transporting concrete and concrete products, we sell CCPs in most regions of country by utilizing our extensive distribution system. No customer represents
more than 10% of our construction materials segment revenue.
12
Table of Contents
Coal is the largest indigenous fossil fuel resource in the United States. The U.S. Energy Information Administration estimates that in
2013 coal was used to produce approximately 39% of the electricity generated in the United States. The combustion of coal results in a high percentage of residual materials which serve as the "raw
material" for the CCP industry. According to the American Coal Ash Association, in 2013 about 51 million tons of the approximately 115 million tons of U.S. CCPs generated were
efficiently utilized. As long as a significant amount of electricity is created using coal-fueled generation, we believe there will be significant supplies of CCP raw materials. However, as Clean Air
Act, Resource Conservation and Recovery Act ("RCRA") and other environmental rules are implemented, the efforts of coal-fueled electric power producers to comply with tighter regulatory requirements
may have a serious adverse effect on the supply of CCPs. Increasingly strict requirements make coal burning less attractive for utilities. Faced with the prospect of more stringent regulations,
litigation by environmental groups and a decrease in the cost of natural gas, some electric utilities are reducing their portfolio of coal powered energy facilities. In recent years, multiple
companies have announced plans to close coal-fired power plant units, or dropped plans to open new plants. While the current level of reduced use of coal in power generation has not materially
impacted our fly ash supply, significant diminished use of coal in the future could reduce our supply of CCP raw materials. (See "Business—Regulation" and "Risk Factors.")
Marketing CCPs, and particularly fly ash, competes vigorously with portland cement in the production of concrete. Based on Portland
Cement Association and American Coal Ash Association data, we estimate that for calendar 2013, fly ash replaced approximately 16% of the portland cement that otherwise would have been used in concrete
produced in the United States. There is also competition among fly ash suppliers. Our nationwide CCP distribution system not enjoyed by our competition allows us to effectively compete for long-term
exclusive supply contracts with utilities. Our CCP business has a presence in every region in the United States but, because the market for cementitious materials is fragmented and because the costs
of transportation are high relative to sales prices, most of the competition is regional. There are many local, regional and national companies that compete for market share with portland cement or
similar CCP products and with numerous other substitute products. Although we have a number of long-term CCP management contracts with our clients, some of these contracts allow for the termination of
the contract at the convenience of the utility company upon a specified notice. Our major competitors include Lafarge North America Inc., Eagle Materials, Boral Material
Technologies Inc. and Cemex. Many of our competitors have greater financial, management and other resources and may be able to take advantage of potential acquisitions and other opportunities
more readily than we can.
Energy Technology
In our energy technology segment, we are focused on increasing the value of low value oil through a technology that improves conversion
of petroleum refinery vacuum residuals into higher-value products.
We continue to develop for commercialization the following businesses and technologies:
Heavy Oil Upgrading Technology. We own patents and know-how related to the HCAT® technology. Our HCAT technology is a unique heavy
oil
upgrading process for the addition of hydrogen
to heavy residual oils such as petroleum vacuum residue (so-called "bottom of the barrel") and tar sand bitumen which may result in lighter, more valuable petroleum materials. The proprietary HCAT
13
Table of Contents
process
uses a highly active, molecular-scale catalyst to more efficiently convert heavy oils, including the asphaltenic components, into more valuable products, such as diesel fuel. We now supply our
catalyst precursor to the heavy oil upgrading units at three refineries. We will continue to develop the long sale cycle opportunities for the HCAT technology with additional refineries through the
efforts of our own small group of sales executives and through marketing cooperation with established industry participants.
In September 2011 we decided to focus on our core building products and construction materials businesses and therefore committed to a
plan to sell our coal cleaning business comprised primarily of 11 coal cleaning facilities and associated assets. In a series of transactions in 2012 and 2013, we sold our coal cleaning business. The
financial results of our former coal cleaning business are presented in our statements of income as a discontinued operation.
Our heavy oil upgrading business experiences competition from many of the world's major petroleum, chemical and energy companies. Those
companies are actively engaged in research and development activities that could result in a competitive slurry catalyst system. For example, Chevron has recently begun marketing a catalyst system
that could be competitive with the HCAT® technology. Many of our competitors have greater financial and other resources and may be able to take advantage of acquisitions and other
opportunities more readily.
Segments and Major Customers
We operate in three business segments, building products, construction materials and energy technology. Additional information about
segments is presented in Note 3 to the consolidated financial statements included herein. No customer accounted for more than 10% of total revenue from 2013 through 2015.
Seasonality
Our building products and construction materials segments experience seasonal changes in revenue. Construction of new homes, repair and
remodeling, and commercial and infrastructure projects slow during winter conditions and increase during temperate seasons. Because our products are used in construction projects, our revenues
increase in the spring, are strong in the summer and fall, and drop significantly in the winter months, typically making our second fiscal quarter our lowest revenue quarter.
Intellectual Property
As of September 30, 2015, we had approximately 231 U.S. and foreign counterpart patents and approximately 75 U.S. and foreign
counterpart patents pending. Additionally, we have approximately 314 U.S. and foreign trademarks and approximately 68 U.S. and foreign trademark applications pending. The following table lists the
number of patents and trademarks, U.S. and foreign, by segment:
|
|
|
|
|
|
|
|
|
|
|
|
|
|
|
|
Patents |
|
Trademarks |
|
|
|
Issued |
|
Pending |
|
Issued |
|
Pending |
|
Building Products |
|
|
86 |
|
|
17 |
|
|
269 |
|
|
63 |
|
Construction Materials |
|
|
21 |
|
|
3 |
|
|
18 |
|
|
3 |
|
Energy Technology and Corporate |
|
|
124 |
|
|
55 |
|
|
27 |
|
|
2 |
|
14
Table of Contents
Collectively,
the intellectual property is important to us, but except in energy technology, there is no single patent or trademark that is itself material to us at the present time. In
our energy segment, we have patents protecting our heavy oil upgrading technology that are material to that business.
There
can be no assurance as to the scope of protection afforded by the patents. In addition, there are other technologies in use and others may subsequently be developed, which do not,
or will not, utilize processes covered by the patents. There can be no assurance that our patents will not be infringed or challenged by other parties or that we will not infringe on patents held by
other parties. Because some of these patents represent new technology, the importance of the patents to our business will depend on our ability to commercialize these technologies successfully, as
well as our ability to protect our
technology from infringement or challenge by other parties. Patents may expire before they are a commercial success.
In
addition to patent protection, we also rely on trade secrets, know-how and confidentiality agreements to protect technologies. Despite these safeguards, such methods may not afford
complete protection and there can be no assurance that others will not either independently develop such know-how or obtain access to our know-how, concepts, ideas, and documentation. Since our
proprietary information is important to our business, failure to protect ownership of our proprietary information would likely have a material adverse effect on us.
Regulation
Environmental. Our operations and those of our suppliers and customers involved in coal-based energy generation, primarily utilities,
are subject to
federal, state and local environmental regulations. Our coal-based operations and those of our customers, including our sold coal cleaning operations, are subject to regulations that impose limits on
the discharge of air and water pollutants and establish standards for the treatment, storage and disposal of solid and hazardous waste materials and the reclamation of land. Compliance with the
applicable regulations adds to the cost of doing business and may expose us to potential fines for non-compliance or may require us to spend money to investigate or remediate contaminated facilities
or reclaim disturbed land. Moreover, in order to establish and operate power plants, our operations to collect and transport CCPs and our former coal cleaning facilities, we and our customers have
obtained various federal, state and local permits and must comply with processes and procedures that have been approved by regulatory authorities. Compliance with permits, regulations and approved
processes and procedures helps protect the environment and is critical to our business. Any failure to comply could result in the issuance of substantial fines and penalties and may cause us to incur
environmental or reclamation liabilities or subject us to third party claims.
We
believe that all required permits to construct and operate facilities have been or will be obtained and believe all of our current facilities are in substantial compliance with, and
our former facilities during our period of ownership or operations were in substantial compliance with, all applicable environmental laws and regulations governing our operations.
In
spite of safeguards, our operations entail risks of regulatory noncompliance or accidental discharge that could create an environmental liability, because regulated materials are used
or stored during normal business operations, including in our CCP and former coal cleaning operations. Moreover, we use regulated chemicals in operations involving distillation to purify products,
analysis, packaging of
chemicals and the selling, warehousing and manufacturing of organic chemicals in small research volumes. We also use facilities to perform research and development activities involving coal, oil,
chemicals and industrial gases such as hydrogen. As a result, petroleum and other hazardous materials have been and are present in and on our properties. We generally hire independent contractors to
transport and dispose of any wastes we generate during such activities and send the wastes to approved facilities for disposal.
15
Table of Contents
Our
construction materials business is dependent upon managing CCPs acquired from our suppliers, typically coal-burning power plants. Coal-burning power plants and the coal industry
generally are highly regulated under federal and state law. Environmental regulation affecting this industry is ever-evolving, including the
following:
- •
- The federal Clean Air Act of 1970 and subsequent amendments, particularly the Clean Air Act Amendments of 1990. Regulation by the U.S.
Environmental Protection Agency ("EPA") and corresponding state laws and regulations, limit the emission of air pollutants such as SOx, NOx and particulate matter ("PM"). The
EPA finalized more stringent ambient air quality standards for fine PM in January 2013 and for ozone in October 2015. The EPA is also expected to propose new NOx and SOx
ambient air quality standards in early 2016. To meet emissions limits, utilities have been required to make changes such as changing their fuel sources, installing expensive pollution control
equipment and, in some cases, shutting down a plant. In addition, in July 2011, the EPA adopted the Cross-State Air Pollution Rule ("CSAPR"), a cap-and-trade type program requiring utilities to make
substantial reductions in SOx and NOx emissions that contribute to ozone and in fine particulate matter emissions in order to reduce the interstate transport of such pollution.
CSAPR was challenged by industry and vacated by the D.C. Circuit in August 2012. The Supreme Court decided the case in April 2014, reversing the D.C. Circuit's decision. The D.C. Circuit has since
lifted its stay on CSAPR, and ruled in favor of the EPA on the remaining significant issues. The EPA will implement the first phase of CSAPR in 2015 and 2016 and the second phase in 2017. These
emission control requirements can impact the quantity and quality of CCPs produced at a power plant, can add to the costs of operating a power plant and could make coal a less attractive fuel
alternative in the planning and building of utility power plants.
- •
- Certain environmental laws, including the Comprehensive Environmental Response, Compensation and Liability Act ("CERCLA") and similar
state laws, impose strict, joint and several liability on responsible parties for investigation and remediation of regulated materials at contaminated sites. CCPs may contain materials such as metals
that are regulated materials under these laws. Land application of CCPs as a beneficial use is regulated by a variety of federal and state statutes, which impose testing and management requirements to
ensure environmental protection. However, mismanagement of CCPs can give rise to liability under CERCLA and similar laws.
- •
- Under its Mercury and Air Toxics Standards for Power Plants rule, in February 2012 the EPA promulgated final limits on mercury and
other toxic chemicals from new and modified power plants. In April 2013, the EPA finalized updates to certain limits for new power plants. The requirements to control mercury emissions could result in
implementation of additional technologies at power plants that could negatively affect fly ash quality.
- •
- Some states have adopted legislation and regulatory programs to reduce greenhouse gas ("GHG") emissions, either directly or through
mechanisms such as renewable portfolio standards for electric utilities. These programs could require electric utilities to increase their use of renewable energy such as solar and wind power. Federal
GHG legislation appears unlikely in the near term. However, in the absence of federal GHG legislation, the EPA has taken several recent steps to regulate GHG emissions using existing Clean Air Act
authorities, including setting GHG emission thresholds for determining when new and existing power plants must obtain certain construction or operating permits. The Supreme Court ruled on a challenge
to the EPA's actions in June 2014, upholding the EPA's ability to regulate GHG emissions from sources already required to have these permits for conventional pollutants but finding that GHGs alone
could not trigger the challenged permitting requirements. In August 2015, the EPA finalized New Source Performance Standards for GHG emissions from new and existing fossil-fuel fired electric power
plants that anticipate partial use of carbon capture and storage
16
Table of Contents
technology.
Also in August 2015, the EPA finalized a rule for existing sources, known as the Clean Power Plan, which establishes state-specific, rate-based reduction goals for carbon emissions from
the power sector. The Clean Power Plan calls on the power sector to reduce carbon emissions to 32% below 2005 levels by 2030, with the first incremental decreases beginning in 2022. Both rules will
likely
be challenged in litigation, although initial challenges were dismissed by the courts as untimely.
- •
- The EPA is addressing water quality impacts from coal-burning power plants and coal mining operations. In 2011, the EPA issued
guidance that recommended strict discharge limits in Clean Water Act permits for mountaintop removal and surface mining and established "enhanced coordination procedures" for permits issued by the
U.S. Army Corps of Engineers. In September 2015, the EPA finalized new effluent limitations for steam electric power generating facilities. The final rule requires operators of coal plants with a
generating capacity over 50 megawatts to store fly ash and bottom ash in dry landfills, rather than containment ponds. Approximately 12% of coal plants will be affected, and some marginal operations
may shut down rather than face the expense of complying with the new effluent discharge requirements. In addition, the EPA finalized new regulations to minimize adverse environmental impacts to
aquatic life from cooling water intake structures at existing electric generating plants, which are being challenged by environmental and industry groups. More stringent regulation of coal-burning
power plants and coal mining operations could increase the cost for utilities and thus indirectly impact the availability and cost of fly ash for HRI's CCP activities.
Although
our business managing CCPs for utility customers may benefit from opportunities to manage compliance with certain of the new regulatory requirements, increasingly strict
requirements such as those described above generally will increase the cost of doing business and may make coal burning less attractive for utilities. Faced with more stringent regulations, litigation
by environmental groups, and a decrease in the cost of natural gas, some electric utilities are reducing their portfolio of coal powered energy facilities. For example, in recent years, multiple
companies announced plans to close coal-fired power plant units, or dropped plans to open new plants, citing the cost of compliance with pending or new environmental regulations. The potential
negative impact on job prospects in the utility and mining industries has prompted considerable concern in Congress, leading to calls to restrict the EPA's regulatory authority. The outcome of these
developments cannot be predicted. To date, our business has not had a significant impact from plant closures because our national footprint allows us to move fly ash to satisfy demand; however, if the
rate of coal-powered plant closures increases, we may be adversely affected in the future. Nevertheless, we believe that reliance on coal for a substantial amount of electric power generation in the
United States is likely to continue for the foreseeable future.
New
regulations not only affect our suppliers and customers, but may also directly impact HRI's operations. HRI manages, stores, transports and sells fly ash, and some products
manufactured and sold by HRI contain fly ash. In June 2010, the EPA proposed two alternative rules to regulate CCPs generated by electric utilities and independent power producers. One proposed option
would have classified CCPs disposed of in surface impoundments or landfills as "special wastes" subject to federal hazardous waste regulation under Subtitle C of RCRA. The second proposed
option would instead have regulated CCPs as non-hazardous waste under Subtitle D of RCRA. Under both options, the current exemption from hazardous waste regulation for CCPs that are used for
beneficial purposes would remain in effect. Nevertheless, the EPA's proposal resulted in several years of uncertainty in the marketplace over the beneficial use of fly ash in many applications. In
April 2015, the EPA published a final rule that followed the second option, classifying CCPs as non-hazardous solid waste under
Subtitle D of RCRA. This leaves states with primary authority to regulate the handling, storage, and disposal of CCPs as non-hazardous solid waste, subject to EPA oversight and approval. Both
industry
17
Table of Contents
and
environmental organizations have initiated litigation challenging the final rule, which is currently pending.
Although
the EPA's decision to regulate CCPs as solid waste under RCRA Subtitle D avoided the regulatory burdens and stigma that would have accompanied a hazardous waste
designation, the new regulations still may require adjustments to our operations, and the complexity and cost of managing and disposing of CCPs could increase. The rule establishes national minimum
criteria for landfills and impoundments containing CCPs, and includes restrictions on their location, design and operation, as well as groundwater monitoring, recordkeeping, reporting and closure
requirements. Citizens and states have the right to bring lawsuits to enforce the new rule against owners and operators.
The
new rule affirms that beneficial uses of CCPs remain exempt from federal hazardous waste regulation under RCRA's "Bevill exclusion" and are not regulated under either RCRA
Subtitle C or Subtitle D. However, the EPA did not determine whether CCPs destined for disposal should continue to qualify for the Bevill exclusion and did not fully resolve
uncertainties about whether certain CCP applications should be treated as beneficial use or disposal. The final rule specifically notes that the incorporation of fly ash in concrete, as a replacement
for Portland cement, is one of "the most widely recognized beneficial applications" of CCPs. However, some environmental groups have urged the EPA to restrict other uses of CCPs, such as in road base,
claiming that contaminants may leach into the environment. The final rule indicates that the use of CCPs in applications such as road base generally would qualify as beneficial use, so long as
relevant regulations and guidelines are followed. The EPA has not stated whether or when it will reconsider the eligibility of CCPs intended for disposal for the Bevill exclusion. Eligibility depends
on a complicated factual analysis, requiring information gathering that would likely take several years. If the EPA ultimately determines to regulate CCPs intended for disposal as hazardous waste
under RCRA Subtitle C, those CCPs would become subject to a variety of regulations governing the handling, transporting, storing and disposing of hazardous waste. This could reduce the demand
for fly ash and other CCPs and increase the regulatory burden and costs of fly ash management for the utility industry and for HRI, with a potential material adverse impact on our operations and
financial condition.
HRI
manages a number of landfill and pond operations that may be affected by new Clean Water Act requirements, as well as RCRA regulations. In September 2015, the EPA issued a final rule
for Clean Water Act effluent limitation guidelines for steam electric power generating facilities which requires discharges from waste streams and surface impoundments to meet certain limits. This
rule will directly affect landfill and pond operations managed by HRI and may expose HRI to increased liability. The requirements will phase in between 2018 and 2023, and will require project owners
and HRI to implement pollution control measures to reduce or eliminate discharges of various materials from waste
streams and surface impoundments. In addition, the new RCRA Subsection D regulations promulgated in April 2015 require plants to begin using groundwater monitoring systems to track existing
impoundments for violations. A non-complying impoundment must be shut down or retrofit within five years, or seven years if granted an extension; impoundments over 40 acres may be eligible for up to
five two-year extensions. Environmental groups believe that the provisions on existing non-complying impoundments are too lenient and are considering filing suit to challenge this rule.
At
HTI, we have worked at the molecular level in the use of nanocatalysts. A number of agencies are studying the potential implications of nanotechnology and manufactured nanomaterials
on human health and the environment, including the National Toxicology Program, the National Institute for Safety and Health, the National Science Foundation and the EPA. In September 2010, the EPA
adopted its first rule regulating carbon nanomaterials under the Toxic Substances Control Act ("TSCA") and has since issued direct final significant new use rulings for 5 other carbon nanomaterials.
These significant new use rulings require persons intending to manufacture, import, or process one of the covered materials to notify the EPA at least 90 days before commencing that activity
and also place certain restrictions on their use and manufacture. The EPA has also proposed a new
18
Table of Contents
information-gathering
rule for existing nanomaterials, which was released for public comment in April 2015. This information will be used to determine whether further regulatory action on
nanomaterials under the TSCA is necessary. While these developments demonstrate increasing interest in this area, at this time it is not certain what further nanotechnology regulations may be adopted
and how they may affect our business.
Employees
As of September 30, 2015, we employed approximately 2,831 full-time employees, including approximately 48 who work under
collective bargaining agreements.
The
following table lists the approximate number of employees by business segment as of September 30, 2013, 2014, and 2015:
|
|
|
|
|
|
|
|
|
|
|
|
|
2013 |
|
2014 |
|
2015 |
|
Building Products |
|
|
1,400 |
|
|
1,670 |
|
|
1,795 |
|
Construction Materials |
|
|
875 |
|
|
920 |
|
|
952 |
|
Discontinued Operations |
|
|
0 |
|
|
0 |
|
|
1 |
|
Energy Technology |
|
|
35 |
|
|
35 |
|
|
36 |
|
Corporate |
|
|
45 |
|
|
40 |
|
|
47 |
|
|
|
|
|
|
|
|
|
|
|
|
|
Total |
|
|
2,355 |
|
|
2,665 |
|
|
2,831 |
|
|
|
|
|
|
|
|
|
|
|
|
|
|
|
|
|
|
|
|
|
|
|
|
|
|
|
|
|
|
|
|
|
|
|
|
|
ITEM 1A. RISK FACTORS
Risks Relating to Our Business
The building products industry is experiencing slow growth and recent improvements in some of our
end markets may not continue. Because the markets for our building products and to a lesser extent, our construction materials business, are dependent on residential construction and remodeling, our
revenues could flatten or decrease as a result of events outside our control that impact home construction and home improvement activity, including economic factors specific to the building products
industry and severe weather.
Our residential building products business and to a lesser extent, our construction materials business, rely upon the home repair and
remodeling markets as well as new construction. Between 2007 and 2011, there was a severe slowing of new housing and remodeling and we experienced a significant slowdown in sales activity during these
years. Although residential construction and remodeling activity has somewhat improved in recent years in certain regions of the United States, the homebuilding industry continues to experience
activity at low levels. Modest consumer confidence, unsteady employment growth, limits on credit availability, rising building costs and other factors may adversely affect new construction or
remodeling, resulting in continued slow improvement or a slowdown in new construction and repair and remodeling activities.
We,
like many others in the building products industry, experienced a large drop in orders and a reduction in our margins in 2007 through 2011. In 2007-2009, we recorded significant
goodwill impairments associated with our building products business. While some increased market activity has occurred in 2012 through 2015, we can provide no assurances that the building products
market will further improve in the near future. Downturns in the United States home improvement and remodeling and the new construction end markets or in specific regions of the United States economy
where we have significant sales could adversely impact our end users and lower the demand for, and pricing of, our products, which in turn could cause our net sales and net income to decrease.
19
Table of Contents
The construction markets are seasonal and generally dependent on temperate weather conditions. The majority of our building products sales and a portion of our
construction materials sales are in the residential construction market, which tends to slow down in the winter months. If there are severe weather events such as hurricanes or flooding, or other
events outside of our control, construction activities will slow and there may be a negative effect on our revenues. For the winter months of late 2015 and early 2016, our decreased seasonal revenues
from our building products and construction materials businesses may result in negative cash flow.
Tight credit markets could negatively affect our business, results of operations, and financial
condition. Construction lending has increased only modestly since its low in early 2013, which continues to adversely affect liquidity for builders, home purchasers and remodelers in 2015 and 2016.
The financial crisis of the banking system and financial markets beginning in 2008 and the going concern threats to banks, governments,
and other financial institutions resulted in tight credit markets, including home construction lending, mortgages and home equity loans. Low
liquidity for builders, homebuyers and remodelers or a tightening of construction or mortgage lending requirements could adversely affect the availability of capital for purchasers of our products and
thereby reduce our sales.
There
could be a number of follow-on effects on our business from limited credit and low liquidity of builders, prospective homebuyers or remodelers, including reduced ability to
purchase our building products. These and other similar factors could:
- •
- cause delay or decisions to not undertake new home construction or improvement projects,
- •
- cause our customers to delay or decide not to purchase our building products,
- •
- lead to a decline in customer transactions and our financial performance.
Our building products business has been strengthened by the sales growth of new products. If we are
unable to offer new products and expand our new product sales, our revenue growth may be adversely affected.
Part of our building products revenues has come from sales in new product categories. New products require innovation, research,
capital for development, manufacturing, and acquisition activities. If we are unable to sustain new product sales growth, whether for lack of new product development, access to adequate capital or for
other reasons, sales will follow any future general industry slowdown in new residential construction and remodeling activity, which will negatively affect our revenue and growth.
Demand for our building products may decrease because of changes in customer or designer preferences
or because competing products gain price advantages. If demand for our products declines, our revenues will decrease.
Our building products are subject to reductions in customer demand for reasons such as changes in preferred home and other building
sizes, materials, colors and styles. Many of our resin-based siding accessory products are complementary to an owner's choice of vinyl as a siding material. If sales of vinyl siding decrease, sale of
our accessories will also decrease. Sales of our manufactured architectural stone products are dependent on the continuing popularity of stone finishes. Similarly, we rely upon architects and other
designers to specify block and other building products that we produce.
Demand
for our building products can also decline if competing products become relatively less expensive. For example, if costs of petroleum-based resins that are used to make vinyl
siding and accessories increase faster than the costs of stucco, then stucco products, which we do not sell, will become more attractive from a price standpoint, and our vinyl siding and accessory
sales may decrease. Manufactured architectural stone and specialty roofing materials could lose price competitiveness compared to other finishes. Similarly, block faces competition from alternative
building materials. If
20
Table of Contents
demand
for our building products declines because of changes in the popularity or price advantages of our products, our revenues will be adversely affected.
A significant increase in the price of materials used in the production of our building products
that cannot be passed on to customers could have a significant adverse effect on our operating income. Furthermore, we depend upon limited sources for certain key production materials, the
interruption of which would materially disrupt our ability to manufacture and supply products, resulting in lost revenues and the potential loss of customers.
Our manufactured architectural stone, concrete block and roof products manufacturing processes require key production materials
including cement, sand, manmade, natural, lightweight and other aggregates, oxides, rolled steel, packaging materials, and certain types of rubber-based products. The suppliers of these materials may
experience shortages and capacity or supply constraints in meeting market demand that limit our ability to obtain needed production materials on a timely basis or at expected prices. We do not have
long-term contracts with such suppliers. We do not maintain large inventories of production materials and alternative sources meeting
our requirements could be difficult to arrange in the short term. A significant increase in the price of these materials that cannot be passed on to customers could have a significant adverse effect
on our cost of sales and operating income. Additionally, our manufacturing and ability to provide products to our customers could be materially disrupted if this supply of materials was interrupted
for any reason. Such an interruption and the resulting inability to supply our customers with manufactured stone, block and roof products could adversely impact our revenues and our relationships with
our customers.
Certain
of our resin-based siding, accessory, trim, roof and other products are manufactured from polypropylene and PVC, a large portion of which material is sold to us by a limited
number of suppliers. The prices of polypropylene and PVC are primarily a function of manufacturing capacity, demand and the prices of petrochemical feedstocks, crude oil and natural gas liquids.
Historically, the market prices of polypropylene and PVC have fluctuated, with material price increases as recently as 2014. A significant increase in the price of polypropylene or PVC that cannot be
passed on to customers could have a significant adverse effect on our cost of sales and operating income. We do not have long-term contracts with our polypropylene or PVC suppliers. We do not maintain
large inventories of polypropylene or PVC and alternative sources could be difficult to arrange in the short term. Therefore, our manufacturing and ability to provide products to our customers could
be materially disrupted if our supply of polypropylene or PVC were interrupted for any reason. Such an interruption and the resulting inability to supply our customers with resin-based products could
adversely impact our revenues and potentially our relationships with our customers.
Interruption of our ability to manufacture and timely ship product orders could harm our reputation
and result in lost revenues if customers turn to other sources for products.
We produce most of our building products in a small number of key manufacturing plants primarily located in the United States and
Mexico. Our manufacturing plants or our systems that track customer orders and production could be disrupted because of natural or manmade disasters, accidents, political unrest, terrorism, crime or
other problems. Our building products business is dependent upon rapid shipments to contractors and distributors of individual orders, a large portion of which orders are manufactured upon demand to
meet customer specifications. If there is significant interruption of our order fulfillment for any reason, we are at risk of harming our reputation for speed and reliability with customers and losing
short-term and long-term revenues if customers turn to alternative building product sources.
21
Table of Contents
Our construction materials business is dependent upon governmental infrastructure spending.
Our fly ash and concrete block products, and to a much lesser extent, our other building products, are used in public infrastructure
projects, which include the construction, maintenance, and improvement of highways, bridges, schools, prisons and similar projects. Our business is dependent on the level of federal, state, and local
spending on these projects. We cannot be assured of the existence, amount, and timing of appropriations for government spending on these projects.
Federal
and state budget deficits may continue to limit the funding available for infrastructure spending. The availability of credit affects the ability of states and other governmental
entities such as cities and school districts to issue bonds to finance construction projects. In addition, infrastructure spending continues to be adversely affected by regions where sluggish
economies persist, which leads to lower tax revenues and state government budget deficits. Shortages in state tax revenues can reduce the amounts spent on state infrastructure projects, even below
amounts appropriated by the legislatures. Delays in state infrastructure spending can hurt our business. Further, rising construction and material prices constrain infrastructure construction budgets.
If HRI's coal-fueled electric utility industry suppliers fail to provide HRI with high-value CCPs
due to environmental regulations or otherwise, HRI's costs could increase and supply could fail to meet customer needs, potentially negatively impacting our profitability or hindering growth.
HRI relies on the production of CCPs by coal-fueled electric utilities. HRI has occasionally experienced delays and other problems,
such as planned and unplanned outages, in obtaining high-value CCPs from its suppliers and may in the future be unable to obtain high-value CCPs on the scale and within the time frames required by HRI
to meet customers' needs. The coal-burning electric utility and coal mining industries are facing a number of new and pending initiatives by regulatory authorities seeking to address air and water
pollution, greenhouse gas emissions and management and disposal of CCPs, as described below. Although our business managing CCPs for utility customers may benefit from opportunities to manage
compliance with some new regulatory requirements, increasingly strict requirements generally will increase the cost of doing business and may make coal burning less attractive for utilities. In recent
years, multiple companies have announced plans to close coal-fired power plant units, or dropped plans to open new plants, citing the cost of compliance with pending or new environmental regulations
and the relatively low cost of natural gas. A reduction in the use of coal as fuel causes a decline in the production and availability of fly ash, the key product in our construction materials
business. The outcome of these developments cannot be predicted. To date, our business has not had a significant impact from plant closures because our national footprint allows us to move fly ash to
satisfy demand; however, if closure of coal-powered plants continues, we may be adversely affected in the future.
Environmental
regulation affecting the coal industry is ever-evolving, and federal and state regulation in recent years has imposed more stringent requirements regarding emission of air
pollutants and other toxic chemicals, reduction of greenhouse gas emissions and water quality impacts from coal mining operations. See "Business—Regulation." To meet emissions levels,
utilities have been required to make changes such as changing their fuel sources, installing expensive pollution control equipment and, in some cases, shutting down plant units. Adoption of more
stringent regulations governing coal combustion, water discharges and air emissions, or coal mining would likely have an adverse effect on the cost, quality, beneficial use and sales of CCPs. Faced
with the prospect of more stringent regulations, litigation by environmental groups, and the relatively low cost of natural gas, an increasing number of electric utilities are reducing their portfolio
of coal powered energy facilities. If HRI is unable to obtain CCPs or experiences a delay in the delivery of high-value or quality CCPs, HRI will have a reduced supply of CCPs to sell or may be forced
to incur significant unanticipated expenses to secure alternative sources or to otherwise maintain supply to customers. Moreover, revenues could be
22
Table of Contents
adversely
affected if CCP sales volumes cannot be maintained or if customers choose to find alternatives to HRI's products.
The EPA has published a rule under RCRA to regulate the disposal of CCPs which is likely to have an
adverse effect on the cost of managing and disposing of CCPs. The heightened regulatory scrutiny of CCPs also may have an adverse effect on the uses and demand for CCPs, and on HRI's relationships
with utilities.
In April 2015, the EPA published a final rule to regulate the disposal of coal combustion residuals as solid (non-hazardous) waste
under subtitle D of RCRA that became effective in October 2015. The rule established national minimum criteria for CCP landfills and impoundments consisting of location restrictions, design and
operating criteria, groundwater monitoring and corrective action, closure requirements, post closure care, recordkeeping and reporting, and other requirements. It is expected that the new regulation
will increase the complexity and cost of managing and disposing of CCPs.
Some
environmental groups continue to urge the EPA to restrict some beneficial uses of CCPs, such as in concrete, road base and soil stabilization, alleging contaminants may leach into
the environment. Changes in the definition of beneficial use of CCPs could reduce the demand for fly ash and other CCPs which would have an adverse effect on HRI's revenues. EPA's increased regulation
of CCPs will likely cause utilities and power producers to impose greater restrictions on the use of CCPs by HRI and its customers. Restrictions imposed by utilities may narrow the types of potential
customers to which HRI can market CCPs and limit their uses of CCPs, reducing HRI's sales opportunities. Utilities are also likely to negotiate to shift actual or perceived liabilities associated with
CCPs and their use to
HRI through more onerous contract and indemnity obligations. This could harm HRI's business by reducing the number of CCP management contracts or by increasing HRI's exposure to the contingent risks
associated with any new regulation of CCPs.
HRI
has managed numerous large scale CCP disposal projects, primarily for coal fueled utilities and power producers. In addition, CCPs have beneficial use for road base, soil
stabilization, and as large scale fill in contact with the ground. If the EPA decides to regulate CCPs as hazardous waste, HRI, together with CCP generators, could be subject to very expensive
environmental cleanup, personal injury and other possible claims and liabilities.
HRI primarily sells fly ash for use in concrete; if use of fly ash does not increase, HRI may not
grow.
HRI's revenues primarily are derived from the sale of fly ash as a mineral admixture used as a partial replacement for portland cement
in concrete products. HRI's growth has been and continues to be dependent upon the increased use of fly ash in the production of concrete. HRI's marketing initiatives emphasize the environmental, cost
and performance advantages of partially replacing portland cement with fly ash in the production of concrete. The markets for HRI's products are regional, in part because of the costs of transporting
CCPs, and HRI's business is affected by the availability and cost of competing products in the specific regions where it conducts business. If portland cement or competing replacement products are
available at lower prices than fly ash, our sales of fly ash as a replacement for portland cement in concrete products could suffer, and HRI may not be able to grow or may experience a decline in
revenue.
Further,
utilities are switching fuel sources, changing boiler operations and introducing activated carbon and ammonia into the exhaust gas stream in an effort to decrease costs and to
meet increasingly stringent emissions control regulations. All of these factors can have a negative effect on fly ash quantity and quality, including an increase in the amount of unburned carbon in
fly ash and the presence of ammonia slip. We are attempting to address these challenges with the development and/or commercialization of two technologies: RestoreAir™, which pre-treats
unburned carbon particles and activated carbon in fly ash in order to minimize the particles' adverse effects, and ammonia slip mitigation, which counteracts the impact of ammonia contaminants in fly
ash. Decreased quantity and
23
Table of Contents
quality
of fly ash may impede the use of fly ash in the production of concrete, which would adversely affect HRI's revenue.
If
the EPA decides to regulate the beneficial uses of CCPs, there would likely be an adverse effect on use and sales of CCPs and HRI's relationship with utilities. Some environmental
groups continue to urge the EPA to restrict some beneficial uses of CCPs, such as in concrete, road base, and soil stabilization, alleging contaminants may leach into the environment. This could
reduce the demand for fly ash and other CCPs which would have an adverse effect on our CCP revenues.
Because demand for CCPs sold by HRI is affected by fluctuations in weather and construction cycles,
HRI's revenues and net income could decrease significantly as a result of unexpected or severe weather.
HRI manages and markets CCPs and uses CCPs to produce building products. Utilities produce CCPs year-round. In comparison, sales of
CCPs are generally keyed to construction market demands that tend to follow national trends in construction with predictable increases during temperate seasons and decreases during periods of severe
weather. HRI's CCP sales have historically reflected these seasonal trends, with the largest percentage of total annual revenues being realized in the quarters ended June 30 and
September 30. Low seasonal demand normally results in reduced shipments and revenues in the quarters ended December 31 and March 31. The seasonal impact on HRI's revenue, together
with the seasonal impact on building products revenues may result in negative cash flows for the winter months of late 2015 and early 2016.
HES remains contingently responsible for certain covenants to the purchasers and for third-party
liabilities transferred to the purchasers of our coal cleaning business.
In September 2011, we adopted a plan to sell our coal cleaning business. In a series of three transactions during 2012 and 2013, we
sold our 11 coal cleaning facilities and associated assets and liabilities which are presented as a discontinued operation. HES has significant contingent liabilities to the purchasers, if our tax and
other representations and warranties prove to be untrue, and to third parties, including regulatory authorities for site reclamation of disturbed mine lands, if purchasers fail to fulfill their
assumed obligations, including the transfer of mining permits and associated reclamation and bonding obligations.
If the IRS is successful in its challenges of Section 45 refined coal tax credits claimed by
us, or other tax positions we have taken, our future profitability will be adversely affected.
Section 45 provides a tax credit for the production and sale of refined coal. Based on the language of Section 45 and
available public guidance, HES believes that the coal cleaning
facilities it formerly owned and operated produced refined coal tax credits available to us until the sale of the facilities. However, the ability to claim tax credits is dependent upon our
achievement of a number of conditions during the time of our ownership and operation, including, but not limited to:
- •
- Placing facilities in service on or before December 31, 2008;
- •
- Producing a fuel from coal that is lower in nitrogen oxide ("NOx") and either sulfur oxide ("SOx") or mercury emissions by the
specified amount as compared to the emissions of the feedstock;
- •
- Producing a fuel at least 50% more valuable than the feedstock; and
- •
- Selling the fuel to a third-party for the purpose of producing steam.
In
September 2010, the Internal Revenue Service ("IRS") issued Notice 2010-54 ("Notice") giving some public guidance about how this tax credit program will be administered and some of
the restrictions on the availability of such credits. Among other things, the Notice requires that for coal
24
Table of Contents
cleaning
operations to qualify for Section 45 credits, the facilities must have been put into service for the purpose of producing refined coal and must produce refined coal from waste coal. In
addition, the Notice gives guidance about the testing that must be conducted to certify the emissions reduction required by Section 45.
We
have recorded and carried forward Section 45 refined coal tax credit benefits totaling approximately $22.8 million through September 30, 2015. The IRS has
completed audits of Headwaters concerning its Section 45 tax credits for 2007 through 2009. There are multiple bases upon which the IRS may challenge our tax credits in future open tax years,
including whether the facilities formerly owned by us were placed in service for the purpose of producing refined coal, whether the facilities used waste coal as a feedstock, and whether our testing
methods and certifications adequately demonstrate the required emissions reductions. In addition, Congress may modify or repeal Section 45 so that these tax credits may not be available in the
future. If HES is not successful in claiming and defending Section 45 credits earned while we owned the coal cleaning facilities, our future profitability will be materially adversely affected.
We
are subject to audit by the IRS for 2012 and succeeding years. In addition, we are subject to state tax authority audits with respect to state taxes. The calculation of tax
liabilities involves uncertainties in the application of complex tax regulations and unique facts. In prior audit cycles, the IRS has investigated our federal tax positions on a number of issues,
including coal cleaning capital asset depreciation. The audit of our federal and state tax returns could have a large effect on the taxes we might ultimately owe. If our estimates of tax liabilities
prove to be less than the ultimate tax assessments by the IRS or state authorities, we could owe significantly more tax than is expected, resulting in additional tax expense, adversely affecting our
future profitability and liquidity.
Our information technology consolidation and continuous improvement initiatives may not result in
the intended benefits and could harm our business.
We strive to continuously take steps to restructure and achieve improvements in our business, including reorganization and reduction of
some management and other employees, and changes in manufacturing, marketing, distribution, pricing and sales of products. In addition, we are in the process of consolidating our accounting, product
order and fulfillment, and other information technology platforms. We may not realize the expected improvements to our business if we have made erroneous assumptions about our ability to successfully
implement these changes, the demand for our products, and our ability to service that demand. If we are not successful, our information technology consolidation and restructuring efforts may be
detrimental to our financial reporting, controls, service to customers and revenues which would have a material adverse effect on our business.
Our business strategy to grow through acquisitions may result in integration costs and poor
performance.
An aspect of our business strategy continues to be the pursuit of growth through acquisitions of products or complementary businesses.
While our ABL Revolver and our senior secured notes limit our ability to engage in acquisitions, to the extent we engage in acquisitions, our
ability to successfully implement the transactions is subject to a number of risks, including difficulties in identifying acceptable acquisition candidates, consummating acquisitions on favorable
terms and obtaining adequate financing, which may adversely affect our ability to develop new products and services and to compete in our markets.
During
2013-2015 we acquired several businesses, and if we do not successfully integrate newly acquired businesses with our existing businesses, we may not realize the expected benefits
of the acquisitions, and the resources and attention required for successful integration may interrupt the business activities of acquired businesses and our existing businesses. Successful management
and integration of acquisitions are subject to a number of risks, including difficulties in assimilating
25
Table of Contents
acquired
operations, loss of key employees, diversion of management's attention from core business operations, assumption of contingent liabilities, incurrence of potentially significant write-offs,
and various employee issues, such as issues related to human resource benefit plans, and an increase in employment and discrimination claims and claims for workers' compensation. Each business
acquisition also requires us to expand our operational and financial systems, which increases the complexity of our information technology systems. Implementation of controls, systems and procedures
may be costly and time-consuming and may not be effective.
Our new products and technologies may not be successfully developed, operated and marketed, which
could affect our future profitability.
Although we have developed or acquired new products and technologies, and plan to continue to do so, successful commercialization of
these products and technologies and their associated businesses in many cases are in early stages. Commercial success will depend on our ability to fully develop the products and technologies and
their businesses, including generating demand from customers. We may not be able to profitably operate our new businesses or market our products or technologies produced from them. For example, the
sale of our heavy oil upgrading products is dependent on refineries operating under conditions suitable to the performance of our catalyst precursor products, which conditions may not be available.
Our growth requires continued investment of capital. If we cannot invest additional capital into new
and existing businesses, we may not be able to sustain or increase our growth.
Our operations require both maintenance and growth capital. A key part of our business strategy has been to expand through
complementary acquisitions, which has required significant capital. In addition, commercialization of new products and technologies has required and will require significant financial commitments. Our
utility services business will require financial commitments such as performance bonds in order to grow and we have limited bonding capacity. Our building products and CCP businesses also require
significant capital expenditures. We estimate that our capital expenditure needs for 2016 will be approximately $45-50 million. If we do not have sufficient capital to make equity investments
in new projects and/or are limited by financial covenants from doing so, our growth may suffer. Many of our competitors, including large businesses in the building products, CCP management and heavy
oil upgrading industries, have greater financial strength than us and may be able to enter our markets, make acquisitions and take advantage of other potential growth opportunities before we can.
We could face additional potential liability claims relating to our products.
We face an inherent business risk of exposure to product liability claims, including class actions, in the event that the use of any of
our products results in personal injury or property damage. For example, in recent years we have faced an increase in personal injury, property damage, and environmental cleanup claims related to coal
combustion products. In the event that any of our products proves to be defective, among other things, we may be responsible for damages related to any defective products and we may be required to
recall or redesign such products. Because of the long useful life of our products, it is possible that latent defects might not appear for years. We often do not control the use or installation of our
products. Improper use or installation can result in claims of defective products against our businesses. Product liability claims can be difficult and expensive to defend. Our insurance does not
cover all liability claims relating to our products. Any insurance we maintain may not continue to be available on terms acceptable to us or such coverage may not be adequate for liabilities actually
incurred. Insurance for product liability claims could become much more expensive or more difficult to obtain or might not be available at all. Further, any claim or
26
Table of Contents
product
recall could result in adverse publicity against us, which could cause our sales to decline or increase our costs.
Significant increases in energy and transportation costs that cannot be passed on to customers could
have a significant adverse effect on operating income.
We purchase a significant amount of energy from various sources to conduct our operations, including fossil fuels and electricity for
production of building products and diesel fuel for distribution of our products and for production-related vehicles. In past years, fuel and other cost increases have increased truck and rail carrier
transportation costs for our products and may do so again in the future. At times, severe weather, including flooding, earthquakes, and other traffic and transportation impairments and failures have
reduced or eliminated access to roads and railways leaving us with more expensive transportation alternatives. Transportation difficulties and cost increases have in the past and may in the future
adversely affect service to customers, the results of our operations and our financial condition. Transportation prices and availability of all petroleum products are subject to political, economic
and market factors that are generally outside of our control.
We operate in industries subject to significant environmental regulation, and compliance with and
changes in regulation could add significantly to the costs of conducting business.
Our CCP operations and our customers and licensees are subject to federal, state, local and international environmental regulations
that impose limitations on the discharge of pollutants into the air and water and establish standards for the treatment, storage and disposal of waste products, and impose liability for the costs of
remediating contaminated sites, which add to the costs of doing business and expose us to potential damage claims and fines for non-compliance. If the costs of environmental compliance increase for
any reason, we may not be able to pass on these costs to customers. In order to establish and operate heavy oil upgrading facilities and power plants and operations to collect and transport CCPs, we
and our customers have obtained various state and local permits and must comply with processes and procedures that have been approved by regulatory authorities. These environmental requirements and
any failure to comply could give rise to substantial environmental liabilities and damage claims and to substantial fines and penalties.
Our
building products manufacturing operations also are subject to environmental regulations and permit requirements governing activities such as the creation of dust, disposal of waste,
discharge of water, and the transportation, storage and use of fuel and materials. If we cannot obtain or maintain required environmental permits for our existing and planned manufacturing facilities
in a timely manner or at all, we may be subject to additional costs and fines.
Some
of our research and development activities involve coal, oil, chemicals and energy technologies, including liquefaction of coal. As a result, petroleum and other regulated materials
have been and are present in and on our properties. Regulatory noncompliance or accidental discharges, fires, or
explosions, in spite of safeguards, could create environmental or safety liabilities. Therefore, our operations entail risk of environmental damage and injury to people, and we could incur liabilities
in the future arising from the discharge of pollutants into the environment, waste disposal practices, or accidents, as well as changes in enforcement policies or newly discovered conditions.
We are involved in litigation and claims for which we incur significant costs and are exposed to
significant liability.
We are a party to some significant legal proceedings and are subject to potential claims regarding operation of our business. These
proceedings will require that we incur substantial costs, including attorneys' fees, managerial time and other personnel resources and costs in pursuing resolution, and adverse resolution of these
proceedings could result in our payment of damages, materially adversely affect our income and reserves and damage our reputation. See "Business—Litigation."
27
Table of Contents
We have significant competition in our industries which may cause demand for our products and
services to decrease.
We experience significant competition in all of our segments and geographic regions. A failure to compete effectively or increased
competition could lead to price cuts, reduced gross margins and loss of market share, which could decrease our profitability. Many of our competitors have greater financial, management and other
resources than we have and may be able to take advantage of acquisitions and other opportunities more readily. In certain instances we must compete on the basis of superior products and services
rather than price, thereby increasing the costs of marketing our services to remain competitive. See "Business—Competition" for more information on the competition faced by us in each of
our segments.
If our internal controls over financial reporting are not adequate, our business and reputation
could be harmed and we could be subject to regulatory scrutiny, civil or criminal penalties or stockholder litigation.
Maintaining effective internal controls is necessary for us to produce reliable financial reports and is important in helping to
prevent fraud and otherwise protect our business. Section 404 of the Sarbanes-Oxley Act of 2002 (the "Sarbanes-Oxley Act") requires that we evaluate and report on our system of internal
controls. If we fail to maintain the adequacy of our internal controls, our ability to rely on reported operating results to manage and protect our business could be harmed and we could be subject to
regulatory scrutiny, civil or criminal penalties or stockholder litigation. Section 404 of the Sarbanes-Oxley Act also requires that our independent auditors report on our system of internal
controls. We have documented and tested our system of internal controls to provide the basis for our reports in our relevant filings with the SEC. The growth and diversification of our business
through acquisitions complicates the process of developing, documenting, maintaining and testing internal controls. Failure to remediate deficiencies in existing controls or to implement required new
or improved controls could harm our business or cause us to fail to meet our reporting obligations. No assurance can be given that in the future there may not be significant deficiencies or material
weaknesses that would be required to be reported.
Information technology vulnerabilities and cyberattacks on our networks could have a material
adverse impact on our business and results of operations.
We rely upon information technology to manage and conduct business, both internally and with our customers, suppliers and other third
parties. Internet transactions involve the transmission and storage of data, including in certain instances customer and supplier business and personal information. Thus, maintaining the security of
computers, computer networks and data storage resources is a critical issue for us and our customers and suppliers. Information technology system failures that cannot be promptly resolved are likely
to result in lost revenues and harm to our business relationships.
Security
breaches could result in reduced or lost ability to carry on our business and loss of and unauthorized access to confidential information. We have limited personnel and other
resources to address information technology reliability and security of our computer networks and respond to known security incidents to minimize potential adverse impact. Experienced hackers,
cybercriminals and perpetrators of threats may be able to penetrate our network security and misappropriate or compromise our confidential information or that of third parties, create system
disruptions or cause shutdowns. These perpetrators of cyberattacks also may be able to develop and deploy viruses, worms, malware and other malicious software programs that attack our information and
networks or otherwise exploit any security vulnerabilities of our information and networks. Techniques used to obtain unauthorized access to or sabotage systems change frequently and often are not
recognized until long after being launched against a target so that we may be unable to anticipate these techniques or to implement adequate preventative measures. A breach of our IT systems and
security measures as a result of third-party action, malware, employee error, malfeasance or otherwise could materially
28
Table of Contents
adversely
impact our business and results of operations and expose us to customer, supplier, and other third party liabilities.
Unauthorized use of or infringement claims regarding our proprietary intellectual property could
adversely affect our ability to conduct our business.
We rely primarily on a combination of trade secrets, patents, copyright and trademark laws and confidentiality procedures to protect
our intellectual property. Despite these precautions, unauthorized third parties may misappropriate, infringe upon, copy or reverse engineer portions of our technology or products. Identification of
unauthorized users of our intellectual property can be very difficult and enforcement and defense of rights can be costly. Manufactured architectural stone competitors, heavy oil upgrading competitors
and other competitors operate in foreign countries where we may not detect unauthorized use of our intellectual property or where enforcement may be difficult. We do not know if current or future
patent applications will be issued with the scope of the claims sought, if at all, or whether any patents issued will be challenged or invalidated. Our business could be harmed if we infringe upon the
intellectual property rights of others. We have been, and may be in the future, notified that we may be infringing intellectual property rights possessed by third parties. If any such claims are
asserted against us, we may seek to enter into royalty or licensing arrangements. There is a risk in these situations that no license will be available or that a license will not be available on
reasonable terms, precluding our use of the applicable technology. Alternatively, we may decide to litigate such claims or attempt to design around the patented technology. In addition, patents may
expire before they are a commercial success. To date, while no single patent or trademark is material to our business, except in HTI's heavy oil upgrading business which relies upon a limited number
of material patents, and the issues described in this paragraph have not resulted in significant cost or had an adverse impact on our business, future actions could be costly and would divert the
efforts and attention of our management and technical personnel.
We are conducting business in foreign countries where intellectual property and other laws, as well
as business conditions, may leave our intellectual property, products and technologies vulnerable to duplication by competitors and create uncertainties as to our legal rights against such
competitors' actions.
We have and expect to continue to use, license or otherwise make our products and technologies, available to persons and entities in
foreign countries. There is a risk that foreign intellectual property laws will not protect our intellectual property to the same extent as under
United States laws, leaving us vulnerable to competitors who may attempt to copy our products, processes or technologies. Our limited familiarity with, and the interpretation and enforcement of
foreign laws, regulations and legal requirements involve some uncertainty. These uncertainties could limit the legal protection or recourse available to us. In addition, dependence on foreign licenses
and conducting foreign operations may subject us to increased risk from political change, ownership issues or repatriation or currency exchange concerns.
Fluctuations in the value of currency may negatively affect our revenue and earnings.
Doing business internationally exposes us to risks related to the value of one currency compared to another. For example, some of our
revenues are generated by sales of goods produced in the U.S. to buyers in foreign countries. If the U.S. dollar strengthens relative to the currency of foreign purchasers, the relative cost of our
goods to such purchasers may go up, and the demand for our products may decrease, reducing our revenues. Also, in cases where our debt or other obligations are in currencies different than the
currency in which we earn revenue, we may lose money as a result of fluctuations in the exchange rates, decreasing our earnings.
29
Table of Contents
We are dependent on certain key personnel, the loss of whom could materially affect our financial
performance and prospects.
Our continued success depends to a large extent upon the continued services of our senior management and certain key employees. Each
member of our senior management team has substantial experience and expertise in our industry and has made significant contributions to our growth and success. We do face the risk, however, that
members of our senior management may not continue in their current positions and the loss of the services of any of these individuals could cause us to lose customers and reduce our net sales, lead to
employee morale problems and the loss of key employees, or cause disruptions to our production. Also, we may be unable to find qualified individuals to replace any of the senior executive officers who
leave our company.
Risks Relating to our Common Stock
The price of our common stock historically has been volatile. This volatility may affect the price
at which you could sell your common stock, and the sale of substantial amounts of our common stock could adversely affect the price of our common stock.
The market price for our common stock has varied between a high of $21.76 in August 2015 and a low of $10.54 in October 2014 during the
twelve-month period ended September 30, 2015. This volatility may affect the price at which you could sell your common stock, and the sale of substantial amounts of our common stock could
adversely affect the price of our common stock. Our stock price is likely to continue to be volatile and subject to significant price and volume fluctuations in response to market and other factors,
including the other factors discussed in "Risks Relating to Our Business;" variations in our quarterly operating results from our expectations or those of securities analysts or investors; downward
revisions in securities analysts' estimates; and announcement by us or our competitors of significant acquisitions, strategic partnerships, joint ventures or capital commitments.
In
the past, following periods of volatility in the market price of their stock, many companies have been the subject of securities class action litigation. If we became involved in
securities class action litigation in the future, it could result in substantial costs and diversion of our management's attention and resources and could harm our stock price, business, prospects,
results of operations and financial condition.
The
broader stock market has experienced significant price and volume fluctuations in recent months and years. This volatility has affected the market prices of securities issued by many
companies for reasons unrelated to their operating performance and may adversely affect the price of our common stock. In addition, our announcements of our quarterly operating results, changes in
general conditions in the economy or the financial markets and other developments affecting us, our affiliates or our competitors could cause the market price of our common stock to fluctuate
substantially.
We have never paid dividends and do not anticipate paying any dividends on our common stock in the
future, so any short-term return on your investment will depend on the market price of our common stock.
We currently intend to retain any earnings to finance our operations and growth. The terms and conditions of our senior secured credit
facility restrict and limit payments or distributions in respect of our common stock.
Delaware law and our charter documents may impede or discourage a takeover, which could cause the
market price of our shares to decline.
We are a Delaware corporation, and the anti-takeover provisions of Delaware law impose various impediments to the ability of a third
party to acquire control of us, even if a change in control would be beneficial to our existing stockholders. In addition, our board of directors has the power, without
30
Table of Contents
stockholder
approval, to designate the terms of one or more series of preferred stock and issue shares of preferred stock, including the adoption of a "poison pill," which could be used defensively if
a takeover is threatened. The ability of our board of directors to create and issue a new series of preferred stock and certain provisions of Delaware law and our certificate of incorporation and
bylaws could impede a merger, takeover or other business combination involving us or discourage a potential acquirer from making a tender offer for our common stock, which, under certain
circumstances, could reduce the market price of our common stock.
Future sales of our common stock in the public market could cause our stock price to fall.
The sale of substantial amounts of our common stock could adversely impact our stock price. As of September 30, 2015, we had
outstanding approximately 73.9 million shares of our common stock and options to purchase approximately 0.1 million shares of our common stock (all of which were exercisable as of that
date). We also had outstanding approximately 3.6 million stock appreciation rights as of September 30, 2015, of which approximately 3.3 million were exercisable. The
sale or the availability for sale of a large number of shares of our common stock in the public market could cause the price of our common stock to decline.
If securities or industry analysts do not publish research or publish unfavorable research about our
business, our stock price and trading volume could decline.
The trading market for our common stock will rely in part on the research and reports that equity research analysts publish about us
and our business. We do not currently have and may never obtain research coverage by equity research analysts. Equity research analysts may elect not to provide research coverage of our common stock,
after the completion of this offering, and such lack of research coverage may adversely affect the market price of our common stock. In the event we obtain equity research analyst coverage, we will
not have any control of the analysts or the content and opinions included in their reports. The price of our stock could decline if one or more equity research analysts downgrade our stock or issue
other unfavorable commentary or research. If one or more equity research analysts ceases coverage of our company or fails to publish reports on us regularly, demand for our stock could decrease, which
in turn could cause our stock price or trading volume to decline.
Risks Relating to Our Indebtedness
We have a substantial amount of indebtedness, which could have a material adverse effect on our
financial condition and our ability to obtain financing in the future and to react to changes in our business.
We have a substantial amount of debt, which requires significant principal and interest payments. As of September 30, 2015, we
had approximately $573.9 million face value of debt outstanding, including $423.9 million outstanding principal amount of our senior secured term loan, $150.0 million outstanding
principal amount of our senior notes. We also have $70.0 million of undrawn availability, subject to a borrowing base limitation, under the ABL Revolver. After giving effect to the borrowing
base limitation and issuance of letters of credit, we had availability of approximately $60.4 million under the ABL Revolver as of September 30, 2015.
Our
significant amount of debt could have important consequences. For example, it could:
- •
- make it more difficult for us to satisfy our obligations under our notes and the ABL Revolver;
- •
- increase our vulnerability to adverse economic and general industry conditions, including interest rate fluctuations, because a
portion of our borrowings, including those under the ABL Revolver, are and will continue to be at variable rates of interest;
31
Table of Contents
- •
- require us to dedicate a substantial portion of our cash flow from operations to payments on our debt, which would reduce the
availability of our cash flow from operations to fund working capital, capital expenditures or other general corporate purposes;
- •
- limit our flexibility in planning for, or reacting to, changes in our business and industry;
- •
- place us at a disadvantage compared to competitors that may have proportionately less debt;
- •
- limit our ability to obtain additional debt or equity financing due to applicable financial and restrictive covenants in our debt
agreements; and
- •
- increase our cost of borrowing.
Despite our current indebtedness levels, Headwaters Incorporated and its subsidiaries may still
incur significant additional indebtedness. Incurring more indebtedness could increase the risks associated with our substantial indebtedness.
Headwaters Incorporated and its subsidiaries may be able to incur substantial additional indebtedness, including additional secured
indebtedness, in the future. The terms of the secured term loan agreement, the senior notes indenture and the credit agreement governing our ABL Revolver restrict, but do not completely prohibit us
from doing so. We have $70.0 million of undrawn availability under the ABL Revolver, subject to borrowing base limitations. After giving effect to the borrowing base limitation, we had
availability of approximately $60.4 million under the ABL Revolver as of September 30, 2015. In addition, the secured term loan agreement and the senior notes indenture will allow us to
issue additional secured term loan and senior notes under certain circumstances which will be guaranteed by our subsidiary guarantors and will allow our foreign subsidiaries to incur additional debt,
which would be structurally senior to our existing secured term loan and senior notes. In addition, the indentures do not prevent us from incurring other liabilities that do not constitute
indebtedness. If new debt or other liabilities are added to our current debt levels, the related risks that we and our subsidiaries now face could intensify.
If we default under the ABL Revolver, our term loan, senior notes, or other indebtedness, we may not
be able to service our debt obligations.
In the event of a default under the ABL Revolver, secured term loan, senior notes, or other indebtedness, lenders could elect to
declare all amounts borrowed, together with accrued and unpaid interest and other fees, to be due and payable. If such acceleration occurs, thereby permitting an acceleration of amounts outstanding
under our debt obligations, we may not be able to repay the amounts due. Events of default are separately defined in each loan agreement or indenture, but include events such as failure to make
payments when due, breach of covenants, default under certain other indebtedness, failure to satisfy judgments in excess of $1.0 million, certain insolvency events and the occurrence of a
material adverse effect (as defined in the ABL Revolver). The occurrence of an event of default could have serious consequences to our financial condition and results of operations, and could cause us
to become bankrupt or insolvent.
We may not be able to generate sufficient cash to service all of our indebtedness and may be forced
to take other actions to satisfy our obligations under our indebtedness, which may not be successful.
Our ability to make scheduled payments on or to refinance our debt obligations depends on our financial condition and operating
performance, which is subject to prevailing economic and competitive conditions and to certain financial, business and other factors beyond our control. We will also be required to obtain the consent
of the lenders under the ABL Revolver to refinance material portions of our indebtedness. We cannot assure you that we will maintain a level of cash flows from operating activities sufficient to
permit us to pay the principal, premium, if any, and interest on our indebtedness.
32
Table of Contents
If
our cash flows and capital resources are insufficient to fund our debt service obligations, we may be forced to reduce or delay investments and capital expenditures, or to sell
assets, seek additional capital or restructure or refinance our indebtedness. These alternative measures may not be successful and may not permit us to meet our scheduled debt service obligations. If
our operating results and available cash are insufficient to meet our debt service obligations, we could face substantial liquidity problems and might be required to dispose of material assets or
operations to meet our debt service and other obligations. We may not be able to consummate those dispositions or to obtain the proceeds that we could realize from them, and these proceeds may not be
adequate to meet any debt service obligations then due. Additionally, our debt agreements limit the use of the proceeds from any disposition; as a result, we may not be allowed, under these documents,
to use proceeds from such dispositions to satisfy all current debt service obligations.
Headwaters Incorporated is a holding company with no independent operations or assets. Repayment of
our indebtedness is dependent on cash flow generated by our subsidiaries.
Headwaters Incorporated is a holding company and repayment of our indebtedness is dependent upon cash flow generated by our
subsidiaries and their ability to make such cash available to us, by dividend, debt repayment or otherwise. Unless they are guarantors of our notes, our subsidiaries do not have any obligation to pay
amounts due on our notes or to make funds available for that purpose. Our subsidiaries may not be able to, or be permitted to, make distributions to enable us to make payments in respect of our
indebtedness. For instance, if there is a default under the ABL Revolver, the ABL Borrowers will not be permitted to transfer funds to us to pay our notes.
Each of our subsidiaries is a distinct legal entity and, under certain circumstances, legal and contractual restrictions may limit our ability to obtain cash from our subsidiaries. While our secured
term loan agreement and our senior notes indenture limit the ability of our subsidiaries to restrict the payment of dividends or make other intercompany payments to us, these limitations are subject
to certain qualifications and exceptions. In the event that we do not receive distributions from our subsidiaries, we may be unable to make required principal and interest payments on our
indebtedness.
Our debt agreements impose significant operating and financial restrictions on us and our
subsidiaries, which may prevent us from capitalizing on business opportunities.
The agreement governing our secured term loan, the indenture governing our senior notes and the credit agreement governing the ABL
Revolver impose significant operating and financial restrictions on us. These restrictions limit our ability, among other things, to:
- •
- incur additional indebtedness or issue certain disqualified stock and preferred stock;
- •
- pay dividends or certain other distributions on our capital stock or repurchase our capital stock;
- •
- make certain investments or other restricted payments;
- •
- place restrictions on the ability of our restricted subsidiaries to pay dividends or make other payments to us;
- •
- engage in transactions with affiliates;
- •
- sell certain assets or merge with or into other companies;
- •
- guarantee indebtedness; and
- •
- create liens.
When
(and for as long as) the availability under the ABL Revolver is less than a specified amount for a certain period of time, funds deposited into deposit accounts used for collections
will be
33
Table of Contents
transferred
on a daily basis into a blocked account with the administrative agent and applied to prepay loans under the ABL Revolver.
As
a result of these covenants and restrictions, we may be limited in how we conduct our business and we may be unable to raise additional debt or equity financing to compete effectively
or to take advantage of new business opportunities. The terms of any future indebtedness we may incur could include more restrictive covenants. We cannot assure you that we will be able to maintain
compliance with these covenants in the future and, if we fail to do so, that we will be able to obtain waivers from the lenders and/or amend the covenants.
There
are limitations on our ability to incur the full $70.0 million of commitments under the ABL Revolver. Borrowings under our ABL Revolver are limited by a specified borrowing
base consisting of a percentage of eligible accounts receivable and inventory, less customary reserves. In addition, under
the ABL Revolver, a monthly fixed charge maintenance covenant would become applicable if excess availability under the ABL Revolver is at any time less than 12.5% of the total $70 million of
current revolving loan commitments, or $8.75 million currently. As of September 30, 2015, availability under the ABL Revolver was approximately $60.4 million. However, due
primarily to the seasonality of our operations, it is possible that availability under the ABL Revolver could fall below the 12.5% threshold in a future period. If the covenant trigger were to occur,
the ABL Borrowers would be required to satisfy and maintain on the last day of each month a fixed charge coverage ratio of at least 1.0x for the preceding twelve-month period. As of
September 30, 2015, our fixed charge coverage ratio was approximately 1.9x. Our ability to meet the required fixed charge coverage ratio can be affected by events beyond our control, and we
cannot assure you that we will meet this ratio. A breach of any of these covenants could result in a default under the ABL Revolver.
Moreover,
the ABL Revolver provides the lenders considerable discretion to impose reserves, which could materially impair the amount of borrowings that would otherwise be available to
us. There can be no assurance that the lenders under the ABL Revolver will not impose such reserves during the term of the ABL Revolver and further, were they to do so, the resulting impact of this
action could materially and adversely impair our ability to make interest payments on our notes.
ITEM 1B. UNRESOLVED STAFF COMMENTS
None.
ITEM 2. PROPERTIES
Our headquarters are located at 10701 South River Front Parkway, Suite 300, South Jordan, Utah 84095. The lease for this
office space of approximately 25,000 square feet has a term expiring December 2023. The monthly rent is approximately $48,000 for 2016, with certain adjustments for inflation plus expenses.
As
of September 30, 2015, HBP owns or leases approximately 45 properties for its building products manufacturing, distribution, and sales operations. HBP has offices in Wixom,
Michigan; San Marcos, California; Brea, California; and Alleyton, Texas and has major manufacturing facilities in Metamora, Michigan; Elkland, Pennsylvania; Greencastle, Pennsylvania; Franklin, Ohio;
Westfield, Massachusetts; Okeechobee, Florida; Brea, California; Alleyton, Texas; and Rosarito, Mexico.
As
of September 30, 2015, HRI owns or leases approximately 14 properties nationwide for its fly ash storage and distribution operations with East, Central, and West regional
divisions. HRI also conducts operations at approximately 86 other sites via rights granted in various CCP through-put, handling and marketing contracts (for example, operating a storage or load-out
facility located on utility-owned properties).
34
Table of Contents
HTI
owns approximately six acres in Lawrenceville, New Jersey where it maintains its principal office and research facility.
ITEM 3. LEGAL PROCEEDINGS
The information set forth under the caption "Legal Matters" in Note 13 to the consolidated financial statements in Item 8
of this Form 10-K is incorporated herein by reference.
ITEM 4. MINE SAFETY DISCLOSURES
Our discontinued coal cleaning operations were subject to regulation by the federal Mine Safety and Health Administration under the
Federal Mine Safety and Health Act of 1977. Because one of Headwaters' subsidiaries anticipates that it will perform permit reclamation responsibilities at one site, information concerning mine safety
violations or other regulatory matters required by section 1503(a) of the Dodd-Frank Wall Street Reform and Consumer Protection Act and Item 106 of Regulation S-K (17 CFR 229.106)
has been included in Exhibit 95 to this annual report.
35
Table of Contents
PART II
ITEM 5. MARKET FOR REGISTRANT'S COMMON EQUITY, RELATED STOCKHOLDER MATTERS AND ISSUER PURCHASES OF EQUITY SECURITIES
The shares of our common stock trade on the New York Stock Exchange under the symbol HW. Options on our common stock are traded on the
Chicago Board Options Exchange under the symbol HQK. The following table sets forth the low and high trading prices of our common stock as reported by the New York Stock Exchange for 2014 and 2015.
|
|
|
|
|
|
|
|
Fiscal 2014
|
|
Low |
|
High |
|
Quarter ended December 31, 2013 |
|
$ |
8.31 |
|
$ |
10.17 |
|
Quarter ended March 31, 2014 |
|
|
9.67 |
|
|
13.98 |
|
Quarter ended June 30, 2014 |
|
|
11.02 |
|
|
14.16 |
|
Quarter ended September 30, 2014 |
|
|
10.27 |
|
|
14.08 |
|
Fiscal 2015
|
|
|
|
|
|
|
|
Quarter ended December 31, 2014 |
|
$ |
10.54 |
|
$ |
15.17 |
|
Quarter ended March 31, 2015 |
|
|
13.37 |
|
|
18.50 |
|
Quarter ended June 30, 2015 |
|
|
17.51 |
|
|
20.31 |
|
Quarter ended September 30, 2015 |
|
|
13.41 |
|
|
21.76 |
|
The
following graph shows a comparison of the cumulative total stockholder return, calculated on a dividend reinvestment basis, for September 30, 2010 through September 30,
2015, on our Common Stock with the New York Stock Exchange Composite Index and the Dow Jones US Building Materials & Fixtures TSM Index. The comparison assumes $100 was invested on
September 30, 2010. Historic stock price performance shown on the graph is not indicative of future price performance.
COMPARISON OF FIVE YEAR CUMULATIVE TOTAL RETURN*
Among Headwaters Incorporated, the NYSE Composite Index,
and the Dow Jones US Building Materials & Fixtures TSM Index
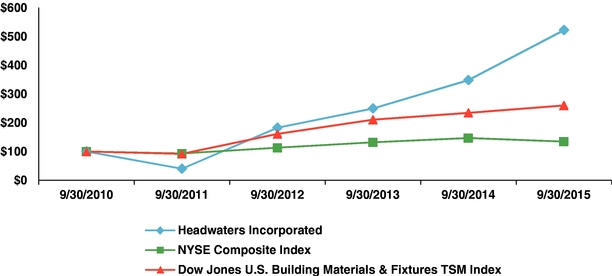
- *
- $100
invested on 9/30/10 in stock or index, including reinvestment of dividends. Fiscal year ended September 30.
36
Table of Contents
As
of October 30, 2015 there were 260 stockholders of record of our common stock. We have not paid dividends on our common stock to date and do not intend to pay dividends in the
foreseeable future. Pursuant to the terms of our debt agreements (see Note 8 to the consolidated financial statements), we
are prohibited from paying cash dividends. We intend to retain earnings to finance the development and expansion of our business. Payment of common stock dividends in the future will depend upon our
debt covenants, our ability to generate earnings, our need for capital, our investment opportunities and our overall financial condition, among other things.
The
information required by this item regarding equity compensation plans is incorporated by reference from the information set forth in Item 12 of this Annual Report on
Form 10-K. See Note 11 to the consolidated financial statements for a description of securities authorized for issuance under equity compensation plans.
We
did not have any sales of unregistered equity securities during the quarter ended September 30, 2015, but did purchase treasury stock. As described in Note 11 to the
consolidated financial statements, we have a Directors' Deferred Compensation Plan (DDCP) under which non-employee directors can elect to defer certain compensation and choose from various options how
the deferred compensation will be invested. One of the investment options is Headwaters common stock. When an eligible director chooses our common stock as an investment option, we purchase the common
stock in open-market transactions in accordance with the director's request and hold the shares until such time as the deferred compensation obligation becomes payable. At such time, the treasury
shares will be distributed to the director in satisfaction of the obligation.
The
following table provides details about the treasury stock purchased in connection with the DDCP during the quarter ended September 30, 2015.
|
|
|
|
|
|
|
|
|
|
|
|
|
|
Period
|
|
Total
Number of
Shares
Purchased |
|
Average
Price
Paid per
Share(1) |
|
Total Number of
Shares Purchased
as Part of Publicly
Announced Plans
or Programs |
|
Approximate Dollar
Value of Shares that
May Yet Be
Purchased Under the
Plans or Programs |
|
July 1, 2015 - July 31, 2015 |
|
|
0 |
|
|
n/a |
|
|
n/a |
|
|
n/a |
|
August 1, 2015 - August 31, 2015 |
|
|
5,796 |
|
$ |
21.14 |
|
|
n/a |
|
|
n/a |
|
September 1, 2015 - September 30, 2015 |
|
|
0 |
|
|
n/a |
|
|
n/a |
|
|
n/a |
|
|
|
|
|
|
|
|
|
|
|
|
|
|
|
|
Total |
|
|
5,796 |
|
$ |
21.14 |
|
|
n/a |
|
|
n/a |
|
|
|
|
|
|
|
|
|
|
|
|
|
|
|
|
|
|
|
|
|
|
|
|
|
|
|
|
|
|
|
|
|
|
|
|
|
|
|
|
|
|
|
|
|
|
- (1)
- Includes
broker commissions.
ITEM 6. SELECTED FINANCIAL DATA
The following selected financial data are derived from our consolidated financial statements. This information should be read in
conjunction with the consolidated financial statements, related notes and other financial information included in this Form 10-K. The selected financial data as of and for the years ended
September 30, 2011 and 2012 and as of September 30, 2013 are derived from audited financial statements not included in this Form 10-K. The selected financial data as of
September 30, 2014 and 2015 and for the years ended September 30, 2013, 2014, and 2015 were derived from our audited financial statements included in this Form 10-K.
As
described in Note 2 to the consolidated financial statements, in connection with the adoption of ASU 2015-03, we reclassified debt issue costs pertaining to outstanding
long-term debt as a deduction from the related debt liabilities. Accordingly, total assets and long-term debt for all years presented below have been reduced by the amounts of those debt issue costs.
As described in Note 4, we have acquired several businesses, the operations of which are included in the operating data below only subsequent to the dates of acquisition. As described in
Note 5, our coal cleaning business has been
37
Table of Contents
presented
as a discontinued operation and is therefore not included in the results from continuing operations shown in the table below. Interest expense for 2011 includes $62.6 million of early
debt repayment premiums, and for 2015 includes $24.8 million of non-routine interest expense related to early repayments of debt (see Note 8). We also recorded approximately
$17.9 million of restructuring costs in 2011. As described in Notes 10 and 16, in 2015 we released approximately $109.3 million of the deferred income tax valuation allowance
established in prior years, of which $96.8 million represents a non-routine income tax benefit.
|
|
|
|
|
|
|
|
|
|
|
|
|
|
|
|
|
|
|
Year ended September 30, |
|
(in thousands, except per share data)
|
|
2011 |
|
2012 |
|
2013 |
|
2014 |
|
2015 |
|
OPERATING DATA: |
|
|
|
|
|
|
|
|
|
|
|
|
|
|
|
|
Total revenue |
|
$ |
587,964 |
|
$ |
632,787 |
|
$ |
702,576 |
|
$ |
791,447 |
|
$ |
895,333 |
|
Income (loss) from continuing operations |
|
|
(133,932 |
) |
|
(26,429 |
) |
|
8,285 |
|
|
16,473 |
|
|
132,128 |
|
Diluted income (loss) per share from continuing operations attributable to Headwaters
Incorporated |
|
|
(2.21 |
) |
|
(0.43 |
) |
|
0.12 |
|
|
0.21 |
|
|
1.74 |
|
|
|
|
|
|
|
|
|
|
|
|
|
|
|
|
|
|
|
|
As of September 30, |
|
(in thousands)
|
|
2011 |
|
2012 |
|
2013 |
|
2014 |
|
2015 |
|
BALANCE SHEET DATA: |
|
|
|
|
|
|
|
|
|
|
|
|
|
|
|
|
Working capital |
|
$ |
69,590 |
|
$ |
73,528 |
|
$ |
95,309 |
|
$ |
207,791 |
|
$ |
233,763 |
|
Net property, plant and equipment |
|
|
164,709 |
|
|
159,706 |
|
|
159,619 |
|
|
181,298 |
|
|
185,718 |
|
Total assets |
|
|
719,898 |
|
|
673,888 |
|
|
718,527 |
|
|
896,306 |
|
|
979,019 |
|
Long-term liabilities: |
|
|
|
|
|
|
|
|
|
|
|
|
|
|
|
|
Long-term debt |
|
|
510,450 |
|
|
493,490 |
|
|
443,938 |
|
|
592,458 |
|
|
558,080 |
|
Income taxes |
|
|
15,909 |
|
|
22,079 |
|
|
24,637 |
|
|
23,242 |
|
|
6,590 |
|
Other |
|
|
14,587 |
|
|
20,280 |
|
|
16,968 |
|
|
28,586 |
|
|
30,186 |
|
|
|
|
|
|
|
|
|
|
|
|
|
|
|
|
|
|
|
Total long-term liabilities |
|
|
540,946 |
|
|
535,849 |
|
|
485,543 |
|
|
644,286 |
|
|
594,856 |
|
Total stockholders' equity (net capital deficiency) |
|
|
56,736 |
|
|
(3,129 |
) |
|
84,410 |
|
|
102,442 |
|
|
237,851 |
|
ITEM 7. MANAGEMENT'S DISCUSSION AND ANALYSIS OF FINANCIAL CONDITION AND RESULTS OF OPERATIONS
The following discussion and analysis should be read in conjunction with the information set forth under the caption entitled
"ITEM 6. SELECTED FINANCIAL DATA" and the consolidated financial statements and related notes included in this Form 10-K. Our fiscal year ends on
September 30 and unless otherwise noted, references to years refer to our fiscal year rather than a calendar year.
Overview
Consolidation and Segments. The consolidated financial statements include the accounts of Headwaters, all of our subsidiaries, and
other entities in
which we have a controlling interest. All significant intercompany transactions and accounts are eliminated in consolidation. We currently operate primarily in two building materials-oriented business
segments: building products and construction materials, and have several product lines within those segments. The end uses for our products and materials include new housing construction, residential
repair and remodeling, and commercial, institutional and infrastructure construction. Our third non-core operating segment is energy technology.
38
Table of Contents
Operations and Products. In the building products segment, we design, manufacture, and sell manufactured architectural stone, exterior
siding
accessories (such as shutters, mounting blocks, and vents), roofing materials, concrete block and other building products. We manufacture our building
products in approximately 20 locations. Revenues consist of product sales to wholesale and retail distributors, contractors and other users of building products. In December 2012, we acquired the
assets of Kleer Lumber, Inc., a manufacturer of PVC trim board and moulding products; in December 2013, we acquired 80% of the equity interests in the business of Roof Tile, Inc., a
manufacturer of high quality concrete roof tiles and accessories sold primarily under the Entegra brand; and in May 2014, we acquired the stone coated metal roofing business of Metals USA Building
Products, L.P., the products of which are sold under the Gerard and Allmet brands. We also acquired two small businesses in the building products industry in 2015.
Our
construction materials business acquires fly ash from coal-fueled electric generating utilities. Using a nationwide storage and distribution network, we sell fly ash directly to
concrete manufacturers who use it as a mineral admixture for the partial replacement of portland cement in concrete. In addition to fly ash and other coal combustion products (CCP) sales, revenues
also include CCP disposal services provided to utilities. We acquired two small businesses in the CCP industry in 2014.
The
non-core energy technology segment has been focused on reducing waste and increasing the value of energy-related feedstocks, primarily in the area of low-value oil. Revenues for the
energy technology segment consist primarily of catalyst sales to oil refineries. In September 2011, we committed to a plan to sell our coal cleaning business and since then the coal cleaning business
has been presented as a discontinued operation. In January 2013, we sold all of our remaining coal cleaning facilities.
Building Products Segment. For several years, our building products segment was significantly affected by depressed new housing
construction and
residential repair and remodeling. Accordingly, we significantly reduced operating costs to be positively positioned to take advantage of an anticipated industry turnaround. Demand for new homes has
been rising, although there is still an environment characterized by uncertainties which constrain new building and purchases. While changes have been somewhat uneven, there has been improvement in
demand for our products beginning in 2012.
Our
building products strategy is to obtain growth with leadership economics, which includes four elements: (1) increase the number of products we are selling to core customers
through internal development and bolt-on acquisitions; (2) focus on a total customer solution to value creation for our customers, rather than solely on price and product; (3) leverage
our sales and marketing spend to core customers; and (4) standardize non-customer interfacing infrastructure. We believe we have successfully executed our strategy over the past several years,
adding new trim, moulding, block, and roofing products to our portfolio, while improving margins.
Construction Materials Segment. Our business strategy in the construction materials segment is to negotiate long-term contracts with
suppliers,
supported by investment in transportation and storage infrastructure for the marketing and sale of CCPs. Demand for CCPs is somewhat dependent on federal and state funding of infrastructure projects,
and is somewhat correlated to demand for portland
cement. We are continuing our efforts to expand the demand for high-quality CCPs, develop more uses for lower-quality CCPs, and expand our CCP disposal services and site service revenue generated from
CCP management.
Energy Technology Segment. Revenues for the energy technology segment consist primarily of catalyst sales. Three refineries utilize the
HCAT catalyst
technology and on-site testing by potential new customers continues.
Until
January 2013, we owned and operated coal cleaning facilities that remove impurities from waste coal, resulting in higher-value, marketable coal. In 2011, we assessed the strategic
fit of our
39
Table of Contents
various
operations and decided to divest our coal cleaning business, which did not align with our long-term strategy. In September 2011, the Board of Directors committed to a plan to sell the coal
cleaning business, which has been classified as a discontinued operation since that time. We sold one coal cleaning facility during 2012 and the remaining ten facilities in 2013. We recognized small
estimated gains on the 2012 and 2013 sales transactions, and subsequent to the dates of sale, adjustments of the previously recorded estimated gains have been recognized. We currently expect that
additional adjustments to the recognized gains and losses may be recorded in the future as certain contingencies are resolved.
Seasonality and Weather. Both our building products and construction materials segments are greatly impacted by seasonality.
Accordingly, revenues
and profitability are generally highest in the June and September quarters.
Capitalization and Liquidity. In December 2012, we issued 11.5 million shares of common stock for net proceeds of approximately
$78.0 million. Approximately $43.3 million of the net proceeds were used to acquire the assets of Kleer Lumber. In December 2013, we issued $150.0 million of 71/4%
senior notes for net proceeds of approximately $146.7 million. Approximately $95.0 million of those net proceeds were used in 2014 to acquire the four businesses described above.
In
connection with several transactions during the March 2015 quarter, we significantly restructured our long-term debt. We repaid substantially all of the outstanding 8.75% convertible
senior subordinated notes, and now have essentially no remaining convertible debt outstanding. We entered into a new Term Loan Facility, under which a senior secured loan for $425.0 million was
obtained. This variable-rate loan currently carries an interest rate of 4.50% and matures in March 2022, subject to certain early termination provisions. The net proceeds of approximately
$414.7 million were used to pay the redemption price in connection with the redemption of all of the outstanding 7-5/8% senior secured notes which carried a maturity date of April 2019.
Finally, our ABL Revolver was amended to extend its maturity to March 2020, subject to certain early termination provisions, with more favorable interest rates.
Currently,
except for the required repayments of the Term Loan Facility of approximately $1.1 million per quarter, we have no expected debt maturities until January 2019. As of
September 30, 2015, we had approximately $142.6 million of cash on hand, total liquidity of approximately $203.0 million, and additional cash flow is expected to be generated from
operations over the next 12 months.
Capital
expenditures for each of the years 2013 through 2015 ranged from approximately $29.0 million to $37.0 million, but are currently expected to be somewhat higher
during 2016, especially if promising growth opportunities exist.
In
summary, our strategy for 2016 and subsequent years is to continue activities to improve operational efficiencies and reduce operating costs. We also plan to pursue growth
opportunities through targeted capital expenditures as well as potential additional strategic acquisitions of niche products or entities that expand our current operating platform when opportunities
arise.
Critical Accounting Policies and Estimates
Our significant accounting policies are identified and described in Note 2 to the consolidated financial statements. The
preparation of consolidated financial statements in conformity with U.S. generally accepted accounting principles requires us to make estimates and assumptions that affect i) the reported
amounts of assets and liabilities and disclosures of contingent assets and liabilities at the date of the financial statements, and ii) the reported amounts of revenue and expenses during the
reporting period. Actual results could differ materially from those estimates.
40
Table of Contents
We continually evaluate our policies and estimation procedures. Estimates are often based on historical experience and on assumptions that are believed to be
reasonable under the circumstances, but which could change in the future. Some of our accounting policies and estimation procedures require the use of substantial judgment, and actual results could
differ materially from the estimates underlying the amounts reported in the consolidated financial statements. Such policies and estimation procedures have been reviewed with our Audit Committee. The
following is a discussion of our critical accounting policies and estimates.
Income Taxes. Significant estimates and judgments are routinely required in the calculation of our income tax provisions. We recognize
potential
liabilities for anticipated tax audit issues in the U.S. and state tax jurisdictions based on estimates of whether, and the extent to which, additional taxes and interest will be due. If events occur
(or do not occur) as expected and the payment of these amounts ultimately proves to be unnecessary, the reversal of the liabilities would result in tax benefits being recognized in the period when it
is determined the liabilities are no longer required to be recorded in the consolidated financial statements. If the estimate of tax liabilities proves to be less than the ultimate assessment, a
further charge to expense would result.
Beginning
in 2011, we recorded a full valuation allowance on our net amortizable deferred tax assets and accordingly, did not recognize benefit for tax credit carryforwards, net
operating loss (NOL) carryforwards or other deferred tax assets, except to the extent of earnings in 2013 and 2014. We recorded approximately $3.9 million and $3.6 million of income tax
expense in 2013 and 2014, respectively, primarily due to state income taxes in certain state jurisdictions where we generated taxable income.
In
2015, we recorded an income tax benefit of approximately $94.5 million, primarily due to the release of approximately $109.3 million of the valuation allowance
established in prior years. A valuation allowance is required when there is significant uncertainty as to the realizability of deferred tax assets. The ability to realize deferred tax assets is
dependent upon our ability to generate sufficient taxable income within the carryforward periods provided for in the tax law for each tax jurisdiction. We consider the following possible sources of
taxable income when assessing the realization of our deferred tax assets:
- •
- future reversals of existing taxable temporary differences;
- •
- future taxable income or loss, exclusive of reversing temporary differences and carryforwards;
- •
- tax-planning strategies; and
- •
- taxable income in prior carryback years.
We
considered both positive and negative evidence in determining the continued need for a valuation allowance, including the following:
Positive evidence:
- •
- Current forecasts indicate that we will generate pre-tax income and taxable income in the future.
- •
- We had a three-year cumulative income as of September 30, 2015.
- •
- A majority of our tax attributes have significant carryover periods of 20 years or more.
Negative evidence:
- •
- We operate in cyclical industries that are difficult to forecast.
We
place more weight on objectively verifiable evidence than on other types of evidence and management believes that as of September 30, 2015 available positive evidence
outweighed the
41
Table of Contents
available
negative evidence. Management therefore determined that we met the "more likely than not" threshold that NOLs, tax credits and other deferred tax assets will be realized. Accordingly, a full
valuation allowance was no longer deemed to be required as of September 30, 2015. A valuation allowance of approximately $10.1 million was maintained against capital loss carryforwards,
certain state NOL carryforwards, and certain tax credit carryforwards as of September 30, 2015.
All
of the factors we considered in evaluating whether and when to release all or a portion of the deferred tax asset valuation allowance involved significant judgment. For example,
there are many different interpretations of "cumulative income or losses in recent years" which can be used. Also, significant judgment is involved in making projections of future financial and
taxable income, especially because our financial results are significantly dependent upon industry trends, including new housing construction, repair and remodeling, and infrastructure construction.
Most of the end use categories in which we sell our products and services are currently in varying states of recovery from the historic downturn experienced in recent years; however, it is not
possible to accurately predict whether recovery will continue, and if it does, at what rate and for how long.
As
of September 30, 2015, our U.S. and state NOL and capital loss carryforwards totaled approximately $67.5 million (tax effected). The NOLs expire from 2016 to 2035. In
addition, there are approximately $25.0 million of tax credit carryforwards as of September 30, 2015, which expire from 2028 to 2033.
As
of September 30, 2015, we had approximately $7.5 million of unrecognized income tax benefits related to uncertain tax positions. It is reasonably possible that
approximately $5.0 million of unrecognized income tax benefits could be released within the next 12 months. Most of this amount relates to state taxes and is currently expected to be
released in the December 2015 quarter due to the expiration of statute of limitation time periods. The calculation of tax liabilities involves uncertainties in the application of complex tax
regulations in multiple tax jurisdictions, and we currently have open tax years subject to examination by the IRS and state tax authorities for the years 2012 through 2014. In 2013, the IRS completed
an audit of 2009 which did not result in any material impact to earnings from continuing operations. However, the completion of this audit did result in a tax benefit of approximately
$2.7 million in discontinued operations related to the reversal of unrecognized tax benefits related to audit periods that closed. It is not possible to predict the outcome of future audits by
the IRS or any other taxing authority.
Litigation. We have ongoing litigation and asserted claims which have been incurred during the normal course of business, including the
specific
matters discussed in Note 13 to the consolidated financial statements. We intend to vigorously defend or resolve these matters by settlement, as appropriate.
Management does not currently believe that the outcome of these matters will have a material adverse effect on our operations, cash flow or financial position.
In
accounting for legal matters, we follow the guidance in ASC Topic 450 Contingencies, under which loss contingencies are accounted for based upon the likelihood of the incurrence of a
liability. If a loss contingency is "probable" and the amount of loss can be reasonably estimated, it is accrued. If a loss contingency is "probable" but the amount of loss cannot be reasonably
estimated, disclosure is made. If a loss contingency is "reasonably possible," disclosure is made, including the potential range of loss, if determinable. Loss contingencies that are "remote" are
neither accounted for nor disclosed. We record legal fees associated with loss contingencies when incurred and do not record estimated future legal fees. Management uses outside legal counsel to
assist in estimating the likelihood of the existence of liabilities with regard to all significant legal matters.
We
incurred approximately $3.3 million, $5.1 million and $2.2 million of expense for legal matters in 2013, 2014 and 2015, respectively. Except for 2014, when
$2.8 million of expense was recorded for potential losses, costs for outside legal counsel comprised a majority of our litigation-related costs in the years presented. We currently believe the
range of potential loss for all unresolved legal matters,
42
Table of Contents
excluding
costs for outside counsel, is from $2.5 million up to the amounts sought by claimants and have recorded a liability as of September 30, 2015 of $2.5 million. The
substantial claims and damages sought by claimants in excess of this amount are not currently deemed to be probable. Our outside counsel and management currently believe that unfavorable outcomes of
outstanding litigation beyond the amount accrued are neither probable nor remote. Accordingly, management cannot express an opinion as to the ultimate amount, if any, of our liability, nor is it
possible to estimate what litigation-related costs will be in future periods.
The
specific matters discussed in Note 13 raise difficult and complex legal and factual issues, and the resolution of these issues is subject to many uncertainties, including the
facts and circumstances of each case, the jurisdiction in which each case is brought, and the future decisions of juries, judges, and arbitrators. Therefore, although management believes that the
claims asserted against us in the named cases lack merit, there is a possibility of material losses in excess of the amount accrued if one or more of the cases were to be determined adversely against
us for a substantial amount of the damages asserted. It is possible that a change in the estimate of probable liability could occur, and the changes could be material. Additionally, as with any
litigation, these proceedings require that we incur substantial costs, including attorneys' fees, managerial time and other personnel resources, in pursuing resolution.
Acquisitions. A component of our growth strategy has been to acquire and integrate businesses that complement our existing operations.
We account for
business combinations in accordance with ASC 805 Business Combinations, which requires that we estimate at the date of acquisition the fair values of all assets acquired and liabilities assumed in a
transaction. Accounting for acquisitions requires us to make significant estimates and assumptions. While we believe the estimates and assumptions we have made for completed acquisitions have been
reasonable and appropriate, they are based in part on historical experience, information obtained from management of the acquired companies, and other information available at the time, much of which
is inherently uncertain and subject to refinement. During the measurement period, which can be up to one year from the acquisition date, we often record adjustments to the initial estimates of value.
When such adjustments are made, a corresponding change is made to recorded goodwill. Following the measurement period, any necessary adjustments to acquired assets or assumed liabilities are reflected
in our results of operations.
In
determining the fair values of assets acquired and liabilities assumed, we use various recognized valuation methods, including present value modeling and market values when available.
Valuations are performed by management, often with the assistance of independent valuation specialists under management's supervision. Valuation specialists are most often used in valuing intangible
assets. They also assist in determining estimated useful lives over which the intangible assets should be amortized. Examples of critical factors in the valuation of intangible assets include
estimates of future revenues and cash flows to be generated by the acquired business, market participant assumptions, and the determination of weighted cost of capital assumptions, royalty rates and
terminal values.
Estimates
are also required when a transaction involves contingent consideration, or when there are other contingent liabilities that may exist. We recognize the fair value of contingent
consideration at the date of acquisition as part of the consideration transferred to acquire a business. Such liabilities are remeasured at fair value at the end of each reporting period. There have
not been any material remeasurements of contingent consideration for any acquisition during the periods presented.
Acquisitions
consummated during the periods presented are described in detail in Note 4 to the consolidated financial statements. As of September 30, 2015, there is only
one immaterial acquisition for which the measurement period has not closed.
Valuation of Long-Lived Assets, including Property, Plant and Equipment, Intangible Assets and Goodwill. Long-lived assets consist
primarily of
property, plant and equipment, intangible assets and
43
Table of Contents
goodwill.
Intangible assets consist primarily of identifiable intangible assets obtained in connection with acquisitions. Most of our intangible assets are being amortized, using the straight-line
method, our best estimate of the pattern of economic benefit, over their estimated useful lives. We also have some indefinite-lived intangible assets, consisting of certain tradenames, which are not
amortized. Goodwill consists of the excess of the purchase price for businesses acquired over the acquisition-date fair values of identified assets, net of liabilities assumed.
Acquisition-date
fair values of property, plant and equipment and intangible assets are estimated following the consummation of each business acquisition. Outside consultants are
sometimes used to assist management in estimating the fair value of acquired property, plant and equipment, especially real estate, and in determining estimated useful lives of those assets. Outside
consultants are almost always used to assist management in estimating the fair values of acquired intangible assets, and in determining their estimated useful lives.
In
accordance with the requirements of ASC Topic 350 Intangibles—Goodwill and Other, we do not amortize goodwill or indefinite-lived intangible assets. ASC Topic 350 requires
us to periodically test these assets for impairment, at least annually, or sooner if indicators of possible impairment arise. As described in Note 7 to the consolidated financial statements, we
perform our annual impairment testing during the fourth quarter of our fiscal year, using a June 30 test date and a one- to three-step process, the first step of which is a qualitative
assessment of the likelihood of an existing impairment. Our reporting units for purposes of impairment testing are the same as our operating segments. Long-lived assets other than goodwill and
indefinite-lived intangible assets are evaluated for impairment only when indicators of potential impairment arise.
We
evaluate, based on current events and circumstances, the carrying values of all long-lived assets, as well as the related amortization periods, to determine whether adjustments to
these amounts or to the estimated useful lives are required. Changes in circumstances such as technological advances, or changes in our business model or capital strategy could result in actual useful
lives differing from our current estimates. In those cases where we determine that the useful lives of property, plant and equipment or intangible assets should be changed, we amortize the net book
value in excess of salvage value over the revised remaining useful life, thereby prospectively adjusting depreciation or amortization expense as necessary. No significant changes to estimated useful
lives were made during the periods presented.
The
carrying value of a long-lived asset other than goodwill or indefinite-lived intangible assets is considered impaired when the anticipated cumulative undiscounted cash flow from the
use and eventual disposition of that asset is less than its carrying value. In that event, a loss is recognized based on the amount by which the carrying value exceeds the fair value of the long-lived
asset. Indicators of impairment include such things as a significant adverse change in legal factors or in the general business climate, a history of operating or cash flow losses, a decline in
operating performance, a
significant change in competition, or an expectation that significant assets will be sold or otherwise disposed of.
No
material impairments of long-lived assets were recorded in any year presented. It is possible that some of our tangible or intangible long-lived assets or goodwill could be impaired
in the future and that any resulting write-downs could be material.
In
evaluating potential impairment of goodwill and indefinite-lived intangible assets, we follow the accounting rules described in Note 7 to the consolidated financial statements,
whereby companies may evaluate qualitative factors, including macroeconomic conditions, industry and market considerations, overall financial performance and cost factors, to determine whether it is
necessary to perform step 1 of the two-step impairment test. This qualitative evaluation is commonly referred to as "step 0." We concluded that it was more likely than not that the fair values
exceeded the carrying amounts of goodwill and indefinite-lived intangible assets for both the building products and construction materials
44
Table of Contents
reporting
units as of June 30, 2013, 2014 and 2015. Accordingly, further step 1 and step 2 testing for impairment was not required to be performed.
In
summary, for both reporting units, general industry trends are more positive than in recent prior years, and the overall financial performance of these reporting units improved in
2013, in 2014 and again in 2015 as compared to previous years. Based on currently available information and results of operations, management currently believes it is not likely there will be any
material impairments of goodwill or indefinite-lived intangible assets in the near future.
Year Ended September 30, 2015 Compared to Year Ended September 30, 2014
The information set forth below compares our operating results for the year ended September 30, 2015 with operating results for
the year ended September 30, 2014. Except as noted, the references to captions in the statements of income refer to continuing operations only.
Summary. Revenue for the year ended September 30, 2015 was $895.3 million, up 13% from $791.4 million for 2014. Gross
profit
increased 20%, from $225.7 million in 2014 to $269.9 million in 2015. Operating income of $66.7 million in 2014 improved by 53%, to $102.1 million in 2015. Income from
continuing operations of $16.5 million, or diluted income per share of $0.21, in 2014 improved to $132.1 million, or $1.74 per diluted share, in 2015. The results for 2015 include
$24.8 million of incremental interest expense recorded in the March 2015 quarter related to early debt repayments. Results for 2015 also include the non-routine income tax benefit of
$96.8 million from reversal of the income tax valuation allowance. Net income attributable to Headwaters for 2015 including discontinued operations was $130.8 million, or diluted income
per share of $1.73, compared to $15.3 million, or $0.20 per diluted share, in 2014.
Revenue and Gross Margins. The major components of segment revenue, along with gross margins, are discussed in the sections below.
Building Products Segment. Building products revenue increased 11%, from $472.4 million in 2014 to $523.6 million in 2015, as
a result
of organic growth and the acquisitions of Entegra and Gerard in December 2013 and May 2014, respectively. In 2015, gross profit increased by 15%, to $156.5 million from $136.2 million in
2014, and operating income increased by 37%, to $64.4 million from $46.9 million.
Revenues
increased 5% organically for the year despite soft international sales which were impacted by the strong U.S. dollar and economic challenges in Canada and some overseas markets.
Growth was wide-spread as all four of our major product groups had revenue growth in 2015. Product revenue associated with repair and remodeling construction continued to improve in 2015 as compared
to 2014, despite difficult winter conditions in the Northeast during the March 2015 quarter and record rainfall in much of the U.S. during the June 2015 quarter.
Our
Texas-based block product group performed particularly well as there was strong demand for both our standard block products as well as our higher-margin specialty blocks. Our block
business' largest exposure is to the commercial and institutional end markets, and we experienced minimal revenue impact in 2015 from lower oil prices, which can affect the strength of the Texas
economy. Product introductions also helped revenue growth in 2015 as many of our new products have been well received by the market. For example, our new specialty siding product that we introduced in
the March 2015 quarter resulted in sales that exceeded our first year expectations. We continue to look at ways to grow the business both organically and through acquisitions as we strive to offer
best-in-class products to meet growth in customer demand.
Gross
margin increased by 110 basis points to 29.9% in 2015 and the operating income margin increased by 240 basis points in 2015, as compared to 2014. We continue to benefit from the
decline in
45
Table of Contents
oil
prices through lower diesel costs in our block group and lower resin costs in siding accessories and roofing. Lower raw material and energy costs, combined with operational improvements, more than
offset increased costs in labor, cement and aggregates.
Underlying
fundamentals of our end-markets continue to strengthen as single family housing starts grew during our fiscal year. Builders have experienced shortages in skilled labor and
construction labor, which has contributed to a more gradual recovery, but demand remains strong for construction and for our building products used in new residential construction.
The
significant weakness in new housing construction and residential repair and remodeling which began several years ago appeared to ease during 2013 and 2014, but the recovery has been
somewhat uneven. In addition, there has been and continues to be significant regional differences in the strength of the improvement that has occurred. For example, the recovery has been more robust
in some sections of the West and South, including Texas, as compared to parts of the Northeast, Southeast and Midwest regions, where growth has not been as strong. These regional differences in the
health of housing construction impact the sales of our various product groups differently. We believe our niche strategy and our focus on productivity improvements, cost reductions and sales increases
have tempered somewhat the impact on our business of new housing construction. It is not possible to know whether improved selling conditions and the housing recovery will be sustainable over the
long-term.
According
to the National Association of Home Builders (NAHB), new housing construction starts as of September 2015 were at a seasonally-adjusted annualized level of approximately
1.2 million units, an increase from 0.9 million units and 1.0 million units in calendar 2013 and 2014, respectively. The most current 10- and 50-year averages for new housing
starts were 1.1 million and 1.5 million units, respectively. During the last 56 years, the seven years with the lowest number of housing starts were the seven consecutive calendar
years 2008 through 2014. According to a 2015 report by The Joint Center for Housing Studies of Harvard University, household growth is projected to average approximately 1.2 million units a
year from 2015 to 2025.
Some
of our product offerings have been impacted by the continuing weakness in some sectors of repair and remodeling, including resin-based siding, which continues to be weaker than new
housing construction. However, as noted above, some improvement has been observed in repair and remodeling activity during 2015. Key trends, such as rising home sales and values, indicate potential
for further growth in repair and remodeling, which represents the largest end use for our products.
For
September 2015, the National Association of Realtors reported that existing home sales have increased year over year for 12 consecutive months. On a seasonally adjusted basis, annual
sales increased to a rate of 5.6 million units in September 2015. For all of calendar 2014, there were 4.9 million units sold, compared to 5.1 million units sold in calendar 2013.
Total housing inventory as of September 30, 2015 was 2.2 million existing homes for sale, representing a 4.8-month supply. This compares to a 5.3-month supply as of September 30,
2014 and a 4.3-month supply in May 2005, near the peak of the housing boom. The median sales price for existing homes of all types in September 2015 was 6% higher than in September 2014, surpassing
the peak median price set in July 2006. We believe population growth, pent-up household formation, somewhat increased builder confidence and growing rental demand are some of the factors that have
resulted in positive momentum.
Given
our product leadership positions and reduced cost structure, we believe that we are positioned to benefit from a sustained recovery in housing construction. We believe the
long-term growth prospects in the industry are strong because the current seasonally-adjusted annualized housing starts are below the 50-year average.
Construction Materials Segment. Construction materials revenue increased by 14%, to $352.3 million in 2015, compared to
$309.3 million
in 2014. The increase in revenue was primarily attributable to positive pricing and increases in the volume of high-value CCPs sold. The favorable
46
Table of Contents
pricing
environment resulted from demand for high-quality CCPs to replace portland cement and continued strength in portland cement pricing. Service revenue represented approximately 21% of total
segment revenue for 2015, compared to 25% for 2014. While site-service revenue typically has lower margins than our product sales, they are not as seasonal as construction spending. The smaller
percentage of service revenue to total segment revenue in 2015 as compared to 2014 was due to the completion of a number of service contracts early in the year, and from the growth in high-quality CCP
sales.
Gross
profit increased by 22% to $103.2 million in 2015, compared to $84.4 million in 2014, and gross margin increased by 200 basis points to more than 29%. The operating
income margin increased by 180 basis points in 2015. The improved margins for the year resulted from a shift in product mix and continued cost reductions through continuous improvement.
According
to the Portland Cement Association (PCA), calendar 2012 cement consumption increased 8.6% over 2011 and calendar 2013 consumption increased 4.1% over 2012. Cement consumption
was projected to increase 8.7% in calendar 2014 and by percentages ranging from 8.0% to 5.4% in calendar
years 2015 through 2019, with a projected 7.5% increase in calendar 2015. It is not possible to accurately predict the future trends of cement consumption, nor the correlation between cement usage and
fly ash sales. Nevertheless, because fly ash is sold as an admixture for the partial replacement of portland cement in a wide variety of concrete uses—including infrastructure, commercial,
and residential construction—statistics and trends for portland and blended cement sales can be an indicator for fly ash sales. In April 2015, the PCA's Chief Economist indicated that in
2013 a trough point was reached for road construction, which accounts for the largest amount of public cement consumption.
In
December 2014 the EPA issued its final rule for regulation of coal ash disposal as a non-hazardous solid waste under Subtitle D of the Resource Conservation and Recovery Act. This
action came after several years of effort to eliminate uncertainty in the marketplace over the demonstrated beneficial use of fly ash in concrete applications.
An
important aspect of our strategy is to continue to increase our supply of high-value CCPs for marketing during the construction season. Low natural gas prices, EPA regulations, and
reduced power demand, have combined to force the long-term shutdown, temporary idling, or lower utilization of multiple coal combustion power plant units, negatively impacting the supply of CCPs for
beneficial use in certain areas. This trend, which is currently expected to continue, has impacted somewhat our CCP supplies in certain regions of the country; however, we have multiple sources of
supply and a broad distribution system, which allow us to move CCPs to locations where power plant units have closed. Reallocating CCP supplies can increase our transportation costs, some but not all
of which we have historically been able to pass on to customers. We are constantly seeking opportunities to increase the supply of high-value CCPs through incremental storage, conversion, blending,
treatment, and new contracts.
Energy Technology Segment. Energy technology segment revenue in 2015 was $19.4 million, compared to $9.7 million in 2014, and
gross
profit in 2015 was $10.2 million compared to $5.1 million in 2014. Revenue and gross profit in 2015 benefited from profitable technology design contracts. Revenue in both years was
impacted by the timing of shipments to the three refineries which use our HCAT heavy oil upgrading catalyst. Shipments depend upon the timing of orders and customer onsite inventory levels.
Operating Expenses. Selling, general and administrative expenses increased 9% from 2014 to 2015 due primarily to recurring expenses of
the businesses
acquired during 2014 and 2015, and, to a lesser extent, an increase in incentive-based compensation due to improved operating results in 2015. Amortization of intangible assets was lower in 2015 than
in 2014 due to reduced amortization from
47
Table of Contents
fully
amortized assets, partially offset by increased amortization of the assets acquired in the 2014 and 2015 business acquisitions.
Net Interest Expense. In 2015, net interest expense increased approximately $17.9 million over 2014. This increase was due
primarily to
approximately $24.8 million of non-routine interest expense related to the early repayments of debt during the March 2015 quarter which are described in detail in the Liquidity and Capital Resources—Financing
Activities portion of this management discussion, partially offset by approximately
$8.0 million of reduced interest costs incurred in the last half of 2015, also a consequence of the debt restructuring that occurred in the March 2015 quarter. As a result of that debt
restructuring, as of September 30, 2015 the current annual run-rate for interest expense is approximately $33.0 million.
Income Tax Provision. In 2014, we recorded a full valuation allowance on our net amortizable deferred tax assets and accordingly, did
not recognize
benefit for tax credit carryforwards, net operating loss (NOL) carryforwards or other deferred tax assets, except to the extent of earnings in that year. In 2015, we recorded an income tax benefit of
approximately $94.5 million, primarily due to the release of approximately $109.3 million of the valuation allowance established in prior years. A valuation allowance is required when
there is significant uncertainty as to the realizability of deferred tax assets. See "Critical Accounting Policies and Estimates—Income
Taxes" in this management discussion for a detailed discussion of this valuation allowance. Reference is made to Note 10 to the consolidated financial statements for
details about the significant income tax benefit recorded in 2015 and the 18% effective tax rate for 2014.
Beginning
in 2016, we will record income tax expense at a normalized rate of approximately 39%, but until our NOL and tax credit carryforwards are exhausted, current income taxes will be
minimal, representing primarily state income taxes in certain state jurisdictions.
Discontinued Operations. We recorded $0.5 million of loss from discontinued operations in 2015, representing small amounts of
operating losses
(primarily expenses for certain litigation which commenced prior to disposal of the business), adjustments of the previously recognized estimated gains related to the coal cleaning facilities sold in
January 2013, net of an income tax benefit. We recorded $0.4 million of loss from discontinued operations in 2014, representing $3.1 million of operating losses (primarily expenses for
litigation) and $2.7 million of gain related to the coal cleaning facilities sold in January 2013. The initial gain recorded on disposal was estimated, based on information available at
the time, and in 2014, we received $4.7 million of deferred purchase price payments, along with the collection of certain receivables which had been reserved.
For
all facility sales transactions, a majority of the consideration was in the form of potential production royalties and deferred purchase price, which amounts are dependent upon
future plant production levels. Potential future production royalties and deferred purchase price on the sales transactions were not considered in the original gain calculations and have been
accounted for in the periods when such amounts were received. Coal markets in the U.S. have deteriorated since the coal cleaning facilities were sold. We currently expect that additional adjustments
to the recognized gains and losses from sale of the facilities could be recorded in the future as certain contingencies are resolved; however, we do not currently expect to receive significant
additional cash receipts related to production royalties or deferred purchase price.
In
accordance with the terms of the asset purchase agreement for one of the sales transactions, the buyer of the coal cleaning facilities agreed to assume the lease and reclamation
obligations related to certain of the facilities. Subsequent to the date of sale, our subsidiaries which sold the facilities amended the purchase agreement to provide the buyer with additional time to
make payments, as well as fulfill contractual requirements related to the assumed reclamation obligations. One of our subsidiaries is performing permit reclamation responsibilities at one site. As of
September 30, 2014 and
48
Table of Contents
2015,
approximately $8.0 million and $7.4 million, respectively, was accrued for this reclamation liability. Certain receivables due from the buyer have also been reserved until such
time as collection is more certain. We currently expect to continue to reflect as discontinued operations all activity related to the former coal cleaning business, at least until such time as the
reclamation obligation is satisfied.
Year Ended September 30, 2014 Compared to Year Ended September 30, 2013
The information set forth below compares our operating results for the year ended September 30, 2014 with operating results for
the year ended September 30, 2013. Except as noted, the references to captions in the statements of income refer to continuing operations only.
Summary. Our total revenue for 2014 was $791.4 million, up 13% from $702.6 million for 2013. Gross profit increased 17%, from
$192.5 million in 2013 to $225.7 million in 2014, and operating income of $54.4 million in 2013 improved by 23% to $66.7 million in 2014. Income from continuing operations
increased from $8.3 million, or $0.12 per diluted share in 2013, to $16.5 million, or $0.21 per diluted share in 2014. Net income including discontinued operations increased from
$7.1 million, or $0.10 per diluted share in 2013, to $16.1 million, or $0.20 per diluted share in 2014.
Revenue and Gross Margins. The major components of revenue, along with gross margins, are discussed in the sections below, by segment.
Building Products Segment. Sales of building products in 2014 were $472.4 million with a corresponding gross profit of
$136.2 million.
Sales of building products in 2013 were $394.3 million with a corresponding gross profit of $111.2 million. The 20% revenue increase in 2014 was due to both organic growth and the
acquisition of Kleer Lumber in December 2012 and the acquisitions of Entegra and Gerard in December 2013 and May 2014, respectively. All of our major product categories experienced organic revenue
growth in 2014 over 2013. Our block group revenues were higher in 2014 than in 2013 due to increases in commercial and institutional construction and the strength of the Texas economy. Stone revenues
also increased as we experienced higher sales in all three of our major architectural stone brands, along with sales growth in our ancillary stone products. We believe our initiative to expand our
top-line organic growth by focusing on core customers was a factor in the increased revenues in 2014. Our siding group revenues increased in 2014 over 2013 and were benefitted by new product offerings
and the strength of our new trim board products, despite geographic exposure to weather impacted regions and the weakness in some sectors of the repair and remodel end markets. The gross margin
improvement in 2014 in the building products segment was due to several factors, including price increases, manufacturing efficiencies and transportation cost savings resulting from reduced reliance
on third-party trucking, all of which was partially offset by siding's revenue mix that favored more of the lower-margin products.
Construction Materials Segment. Construction materials revenues for 2014 were $309.3 million with a corresponding gross profit of
$84.4 million. Construction materials revenues for 2013 were $293.0 million with a corresponding gross profit of $73.0 million. Revenue increased during 2014 primarily due to
product volume and price increases, partially offset by a decrease in service revenue. Sales of fly ash increased in volume compared to last year, notwithstanding the impacts of extreme winter weather
in the Northeast and Midwest, limiting the use of fly ash in both regions. Service revenue represented approximately 25% of total segment revenue for 2014, compared to 29% for 2013. Gross margin
increased from 25% in 2013 to 27% in 2014. The increases in gross profit and gross margin percentage were primarily due to increases in fly ash revenue resulting from positive changes in volume and
price, as well as to cost management initiatives.
Energy Technology Segment. Energy technology segment revenues for 2014 were $9.7 million with a corresponding gross profit of
$5.1 million. Revenues for 2013 were $15.3 million with a corresponding gross profit of $8.3 million. The decreases in revenue and gross profit were due primarily to the timing of
shipments to the two refineries which used our HCAT heavy oil upgrading catalyst.
49
Table of Contents
Operating Expenses. Selling, general and administrative expenses increased 17% from 2013 to 2014 due primarily to recurring expenses of
the
businesses acquired in 2014, direct acquisition costs for those businesses, increased selling and marketing costs (including non-routine customer acquisition-related costs and costs designed to spur
incremental organic revenue growth), plus increases in several other cost categories related to revenue growth. Amortization of intangible assets was higher in 2014 than in 2013 due to amortization of
the assets acquired in the 2014 business acquisitions, partially offset by reduced amortization from fully amortized assets.
Other Income and Expense. For 2014, we reported net other expense of $46.7 million, compared to net other expense of
$42.2 million for
2013. The increase of $4.5 million was comprised of an increase in net interest expense of approximately $3.8 million and a change in net other expense of approximately
$0.7 million. Net interest expense increased primarily due to the new senior debt which was issued in December 2013, partially offset by a decrease in interest expense for convertible senior
subordinated notes, the average balance of which decreased in 2014 as compared to 2013. In 2013, there was approximately $2.1 million of accelerated debt discount and debt issue cost
amortization as a result of
early repayments of convertible debt. In 2014, we had no early repayments of long-term debt. The primary reason for the change in other expense from 2013 to 2014 was $0.5 million of losses
related to unconsolidated joint ventures in 2014.
Income Tax Provision. See Note 10 to the consolidated financial statements for the reasons for the 18% reported effective income
tax rate for
2014 and the 32% rate for 2013, including why we recorded a valuation allowance on our net operating losses, tax credits and other deferred tax assets in both years. A valuation allowance is required
when there is significant uncertainty as to the realizability of deferred tax assets. See "Critical Accounting Policies and Estimates—Income
Taxes" for a detailed discussion of this valuation allowance.
Discontinued Operations. We recorded $0.4 million of loss from discontinued operations in 2014, representing $3.1 million of
operating
losses (primarily expenses for certain litigation which commenced prior to disposal of the business) and $2.7 million of gain related to the coal cleaning facilities sold in the January 2013
sales transaction. We recorded $1.1 million of loss from discontinued operations in 2013, representing $3.8 million of operating losses (primarily the results of operations of the
facilities prior to disposal) and $2.7 million of income tax benefit, due primarily to the reversal of unrecognized income tax benefits related to audit periods that closed. In 2013, the
initial gain recorded on disposal was estimated, based on information available at the time, and in 2014, we received $4.7 million of deferred purchase price payments, along with the collection
of certain receivables which had been reserved.
Impact of Inflation and Related Matters
In certain periods, some of our operations in the building products segment have been negatively impacted by increased raw materials
costs for commodities such as polypropylene, poly-vinyl chloride, cement and aggregates. In addition, in prior periods we have experienced increases in our transportation costs in many parts of our
business. We currently believe it is likely that raw materials and commodities such as fuels, along with the prices of other goods and services, could increase in future periods. We have passed
certain increased costs to customers, but it is not possible to accurately predict the future trends of these costs, nor our ability to pass on future cost increases.
There
has been a dramatic reduction in oil prices since the summer of 2014, which has had a positive effect on fuel and transportation costs during 2015. If oil prices were to remain
near their current low level for the long-term, the positive impact on costs would continue, but revenues in certain of our operations could be negatively affected. For example, if oil prices remained
low for an extended period
of time, the Texas economy could be impacted, which in turn could impact some of our Texas-based revenues. Currently, we do not believe low oil prices will significantly affect 2016 revenues.
50
Table of Contents
Liquidity and Capital Resources
Summary of Cash Flow Activities. Net cash provided by operating activities in 2015 was approximately $63.4 million, compared to
approximately
$60.4 million in 2014. The primary difference in the components of operating cash flows between the two years was the increase in net income in 2015, most of which was offset by the significant
change in deferred income taxes related to the release of the valuation allowance. Also, there was a $14.7 million difference related to accounts receivable, primarily due to the increased
level of sales activity in the fourth quarter of 2015 as compared to 2014.
In
2015, our primary investing activity consisted of capital expenditures, and in 2014 our primary investing activities consisted of several business acquisitions along with capital
expenditures. Our primary financing activities in 2015 consisted of obtaining a new senior secured Term Loan Facility and the early repayments of our 8.75% convertible notes and the 7-5/8% senior
secured notes. In 2014, we issued $150.0 million of senior debt. More details about these and other investing and financing activities are provided in the following paragraphs.
Investing Activities. In December 2013, we acquired 80% of the equity interests in the business of Roof Tile, Inc., which sells its
products
primarily under the Entegra brand. Entegra is in the building products segment. Total consideration paid for Entegra, all of which was cash, was approximately $57.5 million. Direct acquisition
costs, consisting primarily of fees for legal services, totaled approximately $0.4 million and were included in selling, general and administrative expense in the statement of income for 2014.
During the March 2014 quarter, we acquired a company in the construction materials industry for initial cash consideration of approximately $3.1 million. In May 2014, we acquired the roofing
products business of Metals USA Building Products, L.P., which products are sold under the Gerard and Allmet brands. After $0.4 million of adjustments for the final calculation of
acquisition-date working capital, total consideration paid for Gerard was approximately $27.6 million, all of which was cash. Direct
acquisition costs, consisting primarily of fees for legal services, totaled approximately $0.3 million and were included in selling, general and administrative expense. During the September
2014 quarter, we acquired the assets of another company in the construction materials industry for cash consideration of approximately $7.4 million.
In
2015, we acquired the remaining 50% interest in a former equity method investee for a cash payment of approximately $1.2 million, and the assets of another company for initial
cash consideration of approximately $4.5 million. Both of these companies are in the building products segment. Subsequent to September 30, 2015, we acquired 100% of the equity interests
in several related companies, together which comprise a roofing products business in the building products industry. Consideration paid, net of cash acquired, was approximately $34.6 million,
which amount is subject to adjustment for the final calculation of acquisition-date working capital. Direct acquisition costs were not material.
In
both 2014 and 2015, a majority of capital expenditures for property, plant and equipment was for maintenance of operating capacity in our building products segment, with a smaller
amount related to other segments and more discretionary expenditures for new product lines or projects. Capital expenditures in 2016 for both maintenance and growth are currently expected to be
approximately $45.0 to $50.0 million, and possibly more if promising growth opportunities exist. Funding for capital expenditures is expected to come from working capital. As of
September 30, 2015, we were committed to spend approximately $1.3 million on capital projects that were in various stages of completion.
We
intend to continue to expand our business through growth of existing operations in our core building materials segments. Acquisitions have historically been an important part of our
long-term business strategy and we continue to look for bolt-on niche acquisitions that meet our criteria and enhance product offerings to our core customer base. Current debt agreements limit
potential acquisitions and investments in joint ventures. The ABL Revolver limits potential acquisitions and
51
Table of Contents
investments
in joint ventures if pro forma net excess availability is 20% or less of total potential availability under the facility.
As
noted earlier, in 2011 we assessed the strategic fit of our various operations and decided to divest our coal cleaning business, which did not align with our long-term strategy. We
sold one coal cleaning facility during 2012 and sold the remaining ten facilities in 2013. For all sales transactions, a majority of the consideration was in the form of potential production royalties
and deferred purchase price, which amounts are dependent upon plant production levels. In 2014, we received total proceeds of approximately $4.7 million related to the sale of facilities,
representing deferred purchase price
payments and the collection of certain receivables that had been reserved. We do not currently expect significant additional cash receipts related to production royalties or deferred purchase price.
One
of our subsidiaries is performing permit reclamation responsibilities at one former coal cleaning site. As of September 30, 2015, approximately $7.4 million was accrued
for this reclamation liability. Certain receivables due from the buyer have also been reserved until such time as collection is more certain. It is not possible to accurately predict the timing or
amounts of any future cash receipts or payments related to our discontinued coal cleaning business.
Financing Activities. In 2014, we issued $150.0 million of 71/4% senior unsecured notes for net proceeds
of approximately
$146.7 million, of which approximately $95.0 million was used to acquire Entegra and other businesses in 2014. We also repaid $7.7 million aggregate principal amount of
convertible notes.
In
2015, using cash on hand, we repurchased and canceled substantially all of the outstanding 8.75% convertible senior subordinated notes, pursuant to open market transactions. Premiums
and accelerated amortization of debt discount and debt issue costs aggregating approximately $3.5 million were paid and charged to interest expense. In March 2015, we entered into a new Term
Loan Facility, under which a senior secured loan for $425.0 million was obtained. Features and restrictions relating to the Term Loan Facility are described in Note 8 to the consolidated
financial statements.
The
net proceeds from the initial borrowing under the Term Loan Facility were approximately $414.7 million, after giving effect to original issue discount of approximately
$2.1 million and estimated transaction costs of approximately $8.2 million. The net proceeds from the original borrowing under the Term Loan Facility were primarily used to pay the
redemption price in connection with the redemption of all of the outstanding 7-5/8% senior secured notes. The early repayment of the 7-5/8% notes resulted in a loss on extinguishment of debt of
approximately $21.3 million, comprised of the early repayment premium of approximately $15.3 million, interest to the April 2015 redemption date totaling approximately
$2.5 million, and accelerated amortization of unamortized debt issue costs of approximately $3.5 million. The loss on debt extinguishment is reflected as interest expense in the
statement of income.
The
Term Loan Facility requires scheduled quarterly repayments in an aggregate annual amount equal to 1.0% of the original principal amount (subject to reduction for certain permitted
prepayments), with the balance due at maturity in March 2022, subject to early termination in October 2018 if more than $50.0 million of the 71/4% senior notes remains
outstanding at that time. We currently expect to reduce the outstanding amount of the 71/4% senior notes to less than $50.0 million prior to October 2018, either though repayment
or refinancing. Except for the required repayments of the senior secured term loan of approximately $1.1 million per quarter, we have no expected debt maturities until January 2019.
We
may voluntarily repay outstanding loans under the Term Loan Facility at any time without premium or penalty, other than customary breakage costs with respect to LIBO rate loans, which
shall be subject to a prepayment premium of 1.0%. The Term Loan Facility requires us to prepay outstanding term loans, subject to certain exceptions, with (i) up to 50% of our annual excess
cash
52
Table of Contents
flow,
as defined, to the extent such excess cash flow exceeds $1.0 million, commencing with fiscal year 2016, with such required prepayment to be reduced by the amount of voluntary prepayments
of term loans and certain other types of senior secured debt; (ii) 100% of the net cash proceeds of certain non-ordinary course asset sales; and (iii) 100% of the net cash proceeds of
certain issuances of debt.
The
Term Loan Facility allows us to request one or more incremental term loans and certain other types of incremental debt in an aggregate amount not to exceed $150.0 million plus
an additional amount which is dependent on our pro forma net leverage ratio, as defined. Any additional borrowings are contingent upon the receipt of commitments by existing or additional lenders.
Headwaters
is a holding company and repayment of our senior secured Term Loan Facility and 71/4% senior unsecured notes is dependent upon cash flow generated by our
subsidiaries and their ability to make such cash available to us, by dividend, debt repayment or otherwise. In the event of a default, the ABL Revolver limits the ability of the ABL borrowers, all of
which are our subsidiaries, to make distributions to enable us to make payments in respect of our senior secured Term Loan Facility and senior unsecured notes. There are no other significant
contractual or governmental restrictions on our ability to obtain funds from our guarantor subsidiaries.
We
were in compliance with all debt covenants as of September 30, 2015. The senior secured Term Loan Facility, senior notes and ABL Revolver limit the incurrence of additional
debt and liens on assets, prepayment of future new subordinated debt, merging or consolidating with another company, selling all or substantially all assets, making acquisitions and investments and
the payment of dividends or distributions, among other things. In addition, if availability under the ABL Revolver is less than 12.5% of the total $70.0 million commitment, or
$8.75 million currently, we are required to maintain a monthly fixed charge coverage ratio of at least 1.0x for the preceding twelve-month period.
There
have been no borrowings under the ABL Revolver since it was entered into in 2009. The ABL Revolver has a termination date of March 2020, with a contingent provision for early
termination at any time within three months prior to the earliest maturity date of the Term Loan Facility or the 71/4% senior notes, at which time any amounts borrowed must be repaid.
Availability under the ABL Revolver cannot exceed $70.0 million, which includes a $35.0 million sub-line for letters of credit and a $10.5 million swingline facility. Availability
under the ABL Revolver is further limited by the borrowing base valuations of the assets of our building products and construction materials segments which secure
the borrowings, currently consisting of certain trade receivables and inventories. In addition to the first lien position on these assets, the ABL Revolver lenders have a second priority position on
substantially all other assets.
As
of September 30, 2015, availability under the ABL Revolver was approximately $60.4 million. However, due primarily to the seasonality of our operations, the amount of
availability varies from period to period and, while not currently expected, it is possible that the availability under the ABL Revolver could fall below the 12.5% threshold, or $8.75 million,
in a future period. As of September 30, 2015, our fixed charge coverage ratio, as defined in the ABL Revolver agreement, is approximately 1.9. The fixed charge coverage ratio is calculated by
dividing EBITDAR minus capital expenditures and cash payments for income taxes by fixed charges, as defined. EBITDAR consists of net income (loss) i) plus net interest expense, income taxes (as
defined), depreciation and amortization, non-cash charges such as goodwill and other impairments, and rent expense; ii) plus or minus other specified adjustments such as equity earnings or loss
in joint ventures. Fixed charges consist of cash payments for interest plus certain principal payments and rent expense.
If
availability under the ABL Revolver were to decline below $8.75 million at some future date and the fixed charge coverage ratio were to also be below 1.0, the ABL Revolver
lender could issue a notice of default. If a notice of default were to become imminent, we would seek an amendment to the ABL Revolver, or alternatively, a waiver of the availability requirement
and/or fixed charge coverage ratio for a period of time. We do not currently believe it is likely we will reach the lower limits of both
53
Table of Contents
our
ABL Revolver and the fixed charge coverage ratio. See Note 8 to the consolidated financial statements for more detailed descriptions of the terms of our long-term debt and our ABL Revolver.
In
August 2015, we filed a universal shelf registration statement with the SEC. A prospectus supplement describing the terms of any future securities to be issued is required to be filed
before any offering can commence under the registration statement.
Working Capital. As of September 30, 2015, our working capital was $233.8 million (including $142.6 million of cash and
cash
equivalents) compared to $207.8 million as of September 30, 2014. We currently expect operations to produce positive cash flow during 2016 and in future years. We also currently believe
working capital will be sufficient for our operating needs for the next 12 months, and that it will not be necessary to utilize borrowing capacity under the ABL Revolver for our seasonal
operational cash needs in the foreseeable future.
Income Taxes. Cash outlays for income taxes were less than $3.3 million for both 2014 and 2015. As of September 30, 2015, our
NOL and
capital loss carryforwards totaled approximately $67.5 million (tax effected). The U.S. and state NOLs and capital losses expire from 2016 to 2035. In addition, there are approximately
$25.0 million of tax credit carryforwards which expire from 2028 to 2033. We do not currently expect cash outlays for income taxes during the next 12 months to be significant.
Summary of Future Cash Requirements. Significant cash requirements for the next 12 months, beyond seasonal operational working
capital
requirements, consist primarily of capital expenditures and interest payments on long-term debt. In subsequent periods, significant cash requirements will include the repayment of debt. See
Note 13 to the consolidated financial statements where the potential risks of litigation are described. Adverse conclusions to those legal matters could involve material amounts of cash outlays
in future periods.
Legal Matters
We have ongoing litigation and asserted claims which have been incurred during the normal course of business. Reference is made to
Note 13 to the consolidated financial statements for a description of our accounting for legal costs and for other information about legal matters.
Off-Balance Sheet Arrangements
As described in Note 13 to the consolidated financial statements, we have operating leases for certain facilities and equipment.
Other than operating leases, we do not have any off-balance sheet arrangements that have, or are reasonably likely to have, a current or future material effect on our financial condition, results of
operations, liquidity, or capital resources.
54
Table of Contents
Contractual Obligations, Commitments and Contingent Liabilities
The following table presents a summary by period of our contractual cash obligations as of September 30, 2015.
|
|
|
|
|
|
|
|
|
|
|
|
|
|
|
|
|
|
|
Payments due by Fiscal Year |
|
(in millions)
|
|
Total |
|
2016 |
|
2017 - 2018 |
|
2019 - 2020 |
|
After 2020 |
|
Senior secured term loan |
|
$ |
423.9 |
|
$ |
4.3 |
|
$ |
8.5 |
|
$ |
8.5 |
|
$ |
402.6 |
|
Senior notes |
|
|
150.0 |
|
|
0 |
|
|
0 |
|
|
150.0 |
|
|
0 |
|
|
|
|
|
|
|
|
|
|
|
|
|
|
|
|
|
|
|
Total long-term debt |
|
|
573.9 |
|
|
4.3 |
|
|
8.5 |
|
|
158.5 |
|
|
402.6 |
|
Interest payments on long-term debt |
|
|
157.8 |
|
|
30.2 |
|
|
59.7 |
|
|
40.9 |
|
|
27.0 |
|
Unconditional purchase obligations |
|
|
138.0 |
|
|
18.1 |
|
|
30.4 |
|
|
27.4 |
|
|
62.1 |
|
Operating lease obligations |
|
|
104.9 |
|
|
29.1 |
|
|
39.6 |
|
|
19.8 |
|
|
16.4 |
|
Other long-term obligations |
|
|
33.0 |
|
|
15.1 |
|
|
16.5 |
|
|
0.7 |
|
|
0.7 |
|
|
|
|
|
|
|
|
|
|
|
|
|
|
|
|
|
|
|
Total contractual cash obligations |
|
$ |
1,007.6 |
|
$ |
96.8 |
|
$ |
154.7 |
|
$ |
247.3 |
|
$ |
508.8 |
|
|
|
|
|
|
|
|
|
|
|
|
|
|
|
|
|
|
|
|
|
|
|
|
|
|
|
|
|
|
|
|
|
|
|
|
|
|
|
|
|
|
|
|
|
|
|
|
|
|
|
|
|
|
|
As
disclosed in Note 8 to the consolidated financial statements, we have no borrowings under our ABL Revolver as of September 30, 2015. The ABL Revolver provides for
potential borrowings of up to $70.0 million, which includes a $35.0 million sub-line for letters of credit and a $10.5 million swingline facility.
Reference
is made to the caption "Compensation Arrangements" in Note 13 to the consolidated financial statements for a detailed discussion of potential commitments to certain
officers and employees under employment agreements, executive change in control agreements, cash performance unit awards and cash-settled SARS. Amounts in addition to those included in the table above
could become obligations under the terms of those agreements, depending upon the outcomes of the future events described in Note 13.
As
described in Notes 11 and 13, Headwaters has two deferred compensation plans whereby directors, officers and certain employees can elect to defer receipt of certain
compensation otherwise payable when earned. The related obligations of Headwaters to make payments under these plans, totaling approximately $14.3 million as of September 30, 2015, have
not been included in the table above because of the substantial uncertainty regarding timing of these payments.
We
have ongoing litigation and asserted claims which have been incurred during the normal course of business, including the specific matters discussed in Note 13. We intend to
vigorously defend or resolve these matters by settlement, as appropriate. We have recorded a liability of $2.5 million as of September 30, 2015 for all legal matters; however, it is not
possible to know what amounts will ultimately be paid, nor when any such payments will occur and accordingly, no amounts for legal matters have been included in the table above. We do not currently
believe that the outcome of these matters will have a material adverse effect on our operations, cash flow or financial position. Final resolutions of these matters could affect the amounts included
in the table.
As
disclosed in Note 10 to the consolidated financial statements, we have certain unrecognized income tax benefits, including potential interest and penalties. At the current
time, an estimate of the range of reasonably possible outcomes cannot be made beyond amounts currently accrued, nor can we reliably estimate the timing of any potential payments.
Recent Accounting Pronouncements
See Note 2 to the consolidated financial statements for a discussion of accounting pronouncements that have been issued which we
have not yet adopted.
55
Table of Contents
ITEM 7A. QUANTITATIVE AND QUALITATIVE DISCLOSURE ABOUT MARKET RISK
We are exposed to financial market risks, primarily related to our stock price and variable-rate debt. We do not use derivative
financial instruments for speculative or trading purposes.
Cash Performance Unit Awards. As described in Note 13 to the consolidated financial statements, the Compensation Committee
approved grants of
performance unit awards to certain officers and employees based on the achievement of cash flow generated during 2013, including a provision for adjustment for changes in our average stock price
during that year. Approximately $4.7 million of expense was recorded for the 2013 awards, all of which was recognized in 2013. In 2014 and 2015, the Committee approved grants of performance
unit awards to certain officers and employees for cash flow generated during those years, with terms similar to the 2013 awards, with an added feature that provides for potential further adjustment
based on cash flows generated in the two years subsequent to the year of grant, or the base performance year. Approximately $5.1 million and $8.6 million of expense was recognized for
these awards during 2014 and 2015, which amounts are subject to adjustment, depending on cash flows generated in future years. As of September 30, 2015, approximately $15.7 million was
accrued for all performance unit awards outstanding but unpaid as of that date.
Subsequent
to September 30, 2015, the Committee approved grants of performance unit awards to certain officers and employees for cash flow generated during 2016, with terms
similar to those described above for 2014 and 2015. Expense for these awards, including adjustments for changes in our average stock price during 2016, will be recognized during 2016, subject to
potential further adjustment in 2017 and 2018, depending on cash flows generated in those years.
Cash-Settled SAR Grants. As described in Note 13 to the consolidated financial statements, in 2012 the Committee approved grants
to certain
officers and employees of approximately 1.0 million cash-settled SARs, approximately 0.1 million of which remain outstanding as of September 30, 2015. These SARs, which are
considered liability awards, vested in annual installments through September 30, 2014 and are settled in cash upon exercise by the employee. As of September 30, 2015, approximately
$1.6 million has been accrued for outstanding awards because the stock price at that date was above the grant-date stock price of $1.85. Changes in our stock price through the dates employees
exercise the SARs (whether positive or negative) will result in adjustments to compensation expense and will be reflected in our statement of income each quarter in 2016, until the SARs are exercised
or expire on September 30, 2016.
In
2011, the Committee approved grants to certain employees of approximately 0.4 million cash-settled SARs, none of which remain outstanding as of September 30, 2015, the
termination date of these awards. Compensation expense for all cash-settled SARs was approximately $4.6 million for both 2013 and 2014 and $3.1 million for 2015. A change in our stock
price of $1.00 would result in an increase or decrease of approximately $0.1 million in the ultimate payout liability for all remaining cash-settled SARs.
The
portion of total cash-based compensation expense resulting from changes in our stock price for all performance unit awards and cash-settled SARs described above, was approximately
$5.6 million for 2013 and $6.1 million for both 2014 and 2015.
Variable-Rate Debt. As described in Note 8 to the consolidated financial statements, we have outstanding a variable-rate Term Loan
Facility
which currently bears interest at 4.5%. The interest rate cannot decrease below the current level but will increase if the eurocurrency (LIBO) rate exceeds the 1% floor. Assuming there were no change
in the amount of debt outstanding and the LIBO rate did increase beyond the floor, a change in the interest rate of 1% could change our interest expense by up to approximately $4.2 million per
year. Also as described in Note 8, any future borrowings under our ABL Revolver will bear interest at a variable rate.
56
Table of Contents
ITEM 8. FINANCIAL STATEMENTS AND SUPPLEMENTARY DATA
The financial statements and supplementary financial data required by this Item 8 are set forth in Item 15 of this
Form 10-K. All information that has been omitted is either inapplicable or not required.
ITEM 9. CHANGES IN AND DISAGREEMENTS WITH ACCOUNTANTS ON ACCOUNTING AND FINANCIAL DISCLOSURE
None.
ITEM 9A. CONTROLS AND PROCEDURES
Disclosure Controls and Procedures—We maintain disclosure controls and procedures that are designed to ensure that information we are required to
disclose in the reports that we file or submit under the Securities Exchange Act of 1934 (the Exchange Act), such as this Annual Report on Form 10-K, is recorded, processed, summarized and
reported within the time periods specified by SEC rules and forms. Disclosure controls and procedures include, without limitation, controls and procedures designed to ensure that information we are
required to disclose in the reports that we file or submit under the Exchange Act is accumulated and communicated to our management, including the Chief Executive Officer (CEO) and the Chief Financial
Officer (CFO), to allow timely decisions regarding required disclosure.
Our
management evaluated, with the participation of our CEO and CFO, the effectiveness of our disclosure controls and procedures as of September 30, 2015, pursuant to
paragraph (b) of Rules 13a-15 and 15d-15 under the Exchange Act. This evaluation included a review of the controls' objectives and design, the operation of the controls, and the effect
of the controls on the information presented in this Annual Report. Our management, including the CEO and CFO, do not expect that disclosure controls can or will prevent or detect all errors and all
fraud, if any. A control system, no matter how well designed and operated, can provide only reasonable, not absolute, assurance that the objectives of the control system are met. Our disclosure
controls and procedures are designed to provide such reasonable assurance of achieving their objectives. Also, the projection of any evaluation of the disclosure controls and procedures to future
periods is subject to the risk that the disclosure controls and procedures may become inadequate because of changes in conditions, or that the degree of compliance with the policies or procedures may
deteriorate.
Based
on their review and evaluation, and subject to the inherent limitations described above, our CEO and CFO have concluded that our disclosure controls and procedures (as defined in
Rules 13a-15(e)
and 15d-15(e) under the Exchange Act) were effective as of September 30, 2015 at the above-described reasonable assurance level.
Internal Control over Financial Reporting—Management is responsible for establishing and maintaining adequate internal control over financial
reporting, as defined in Rules 13a-15(f) and 15d-15(f) under the Exchange Act. Our internal control over financial reporting is designed to provide reasonable assurance regarding the
reliability of financial reporting and the preparation of financial statements for external purposes in accordance with accounting principles generally accepted in the United States of America.
Because
of inherent limitations, internal control over financial reporting may not prevent or detect misstatements. Therefore, even internal controls determined to be effective can
provide only reasonable assurance with respect to financial statement preparation and presentation. The effectiveness of our internal control over financial reporting is subject to various inherent
limitations, including cost limitations, judgments used in decision making, assumptions about the likelihood of future events, the possibility of human error, and the risk of fraud. The projection of
any evaluation of effectiveness to future periods is subject to the risk that controls may become inadequate because of changes in
57
Table of Contents
conditions,
or that the degree of compliance with policies may deteriorate. Because of these limitations, there can be no assurance that any system of internal control over financial reporting will be
successful in preventing all errors or fraud or in making all material information known in a timely manner to the appropriate levels of management.
There
has been no change in our internal control over financial reporting during the quarter ended September 30, 2015 that has materially affected, or is reasonably likely to
materially affect, our internal control over financial reporting.
Management's Report on Internal Control over Financial Reporting
Our management is responsible for establishing and maintaining adequate internal control over financial reporting. Our internal control
system has been designed to provide
reasonable assurance regarding the reliability of financial reporting and the preparation and presentation of our financial statements.
Our
management has assessed the effectiveness of internal control over financial reporting as of September 30, 2015 using the criteria issued by the Committee of Sponsoring
Organizations of the Treadway Commission in Internal Control—Integrated Framework (2013). Based on that assessment, management believes that
our internal control over financial reporting was effective as of September 30, 2015.
BDO
USA, LLP, the independent registered public accounting firm which audits our consolidated financial statements, has issued the following attestation report on the
effectiveness of our internal control over financial reporting.
58
Table of Contents
Report of Independent Registered Public Accounting Firm
The
Board of Directors and Stockholders
Headwaters Incorporated
South Jordan, Utah
We
have audited Headwaters Incorporated's internal control over financial reporting as of September 30, 2015, based on criteria established in Internal
Control—Integrated Framework (2013) issued by the Committee of Sponsoring Organizations of the Treadway Commission
(the COSO criteria). Headwaters Incorporated's management is responsible for maintaining effective internal control over financial reporting, and for its assessment of the effectiveness of internal
control over financial reporting included in the accompanying Item 9A, Management's Report on Internal Control over Financial Reporting. Our responsibility is to express an opinion on the
Company's internal control over financial reporting based on our audit.
We
conducted our audit in accordance with the standards of the Public Company Accounting Oversight Board (United States). Those standards require that we plan and perform the audit to
obtain reasonable assurance about whether effective internal control over financial reporting was maintained in all material respects. Our audit included obtaining an understanding of internal control
over financial reporting, assessing the risk that a material weakness exists, testing and evaluating the design and operating effectiveness of internal control based on the assessed risk, and
performing such other procedures as we considered necessary in the circumstances. We believe that our audit provides a reasonable basis for our opinion.
A
company's internal control over financial reporting is a process designed to provide reasonable assurance regarding the reliability of financial reporting and the preparation of
financial statements for external purposes in accordance with generally accepted accounting principles. A company's internal control over financial reporting includes those policies and procedures
that (1) pertain to the maintenance of records that, in reasonable detail, accurately and fairly reflect the transactions and dispositions of the assets of the company; (2) provide
reasonable assurance that transactions are recorded as necessary to permit preparation of financial statements in accordance with generally accepted accounting principles, and that receipts and
expenditures of the company are being made only in accordance with authorizations of management and directors of the company; and (3) provide reasonable assurance regarding prevention or timely
detection of unauthorized acquisition, use, or disposition of the company's assets that could have a material effect on the financial statements.
Because
of its inherent limitations, internal control over financial reporting may not prevent or detect misstatements. Also, projections of any evaluation of effectiveness to future
periods are subject to the risk that controls may become inadequate because of changes in conditions, or that the degree of compliance with the policies or procedures may deteriorate.
In
our opinion, Headwaters Incorporated maintained, in all material respects, effective internal control over financial reporting as of September 30, 2015, based on the COSO
criteria.
We
also have audited, in accordance with the standards of the Public Company Accounting Oversight Board (United States), the consolidated balance sheets of Headwaters Incorporated as of
September 30, 2014 and 2015, and the related consolidated statements of income, changes in stockholders' equity (net capital deficiency), and cash flows for each of the three years in the
period ended September 30, 2015 and our report dated November 17, 2015 expressed an unqualified opinion thereon.
/s/
BDO USA, LLP
Costa
Mesa, California
November 17, 2015
ITEM 9B. OTHER INFORMATION
None.
59
Table of Contents
PART III
ITEM 10. DIRECTORS, EXECUTIVE OFFICERS AND CORPORATE GOVERNANCE
The applicable information to be set forth under the captions "Executive Officers," "Corporate Governance," "Section 16(a)
Beneficial Ownership Reporting Compliance" and "Proposal No. 1—Election of Directors" in our Proxy Statement to be filed in January 2016 for the Annual Meeting of Stockholders to be
held in 2016 (the "Proxy Statement"), is incorporated herein by reference.
ITEM 11. EXECUTIVE COMPENSATION
The applicable information to be set forth under the captions "Executive Compensation" and "Corporate Governance" in the Proxy
Statement is incorporated herein by reference.
ITEM 12. SECURITY OWNERSHIP OF CERTAIN BENEFICIAL OWNERS AND MANAGEMENT AND RELATED STOCKHOLDER MATTERS
The information to be set forth under the captions "Summary Information about Incentive Compensation Plans" and "Security Ownership of
Certain Beneficial Owners and Management" in the Proxy Statement is incorporated herein by reference.
ITEM 13. CERTAIN RELATIONSHIPS AND RELATED TRANSACTIONS, AND DIRECTOR INDEPENDENCE
The information to be set forth under the caption "Transactions with Related Persons" in the Proxy Statement is incorporated herein by
reference.
ITEM 14. PRINCIPAL ACCOUNTING FEES AND SERVICES
The information to be set forth under the caption "Audit and Non-Audit Fees" in the Proxy Statement is incorporated herein by
reference.
60
Table of Contents
PART IV
ITEM 15. EXHIBITS, FINANCIAL STATEMENT SCHEDULES
(a) 1. Financial Statements
- 2.
- Financial Statement Schedules
All
financial statement schedules for which provision is made in the applicable accounting regulations of the Securities and Exchange Commission are not required under the related
instructions, are inapplicable, or the required information has been provided in the consolidated financial statements or notes thereto.
For
convenience, the name Headwaters is used throughout this listing although in some cases the name Covol was used in the original instrument.
|
|
|
|
|
|
| Exhibit No. |
|
Description |
|
Location |
| |
1.1 |
|
Underwriting Agreement dated as of December 18, 2012 |
|
(28) |
|
3.1.9 |
|
Amended and Restated Certificate of Incorporation of Headwaters dated 1 March 2005 |
|
(5) |
|
3.1.10 |
|
Certificate of Amendment of the Amended and Restated Certificate of Incorporation of Headwaters dated February 24, 2011 |
|
(19) |
|
3.2.5 |
|
Amended and Restated By-Laws of Headwaters |
|
(7) |
|
3.2.6 |
|
Amendment of Amended and Restated By-Laws of Headwaters |
|
(13) |
|
4.1 |
|
Indenture related to the 71/4% Senior Notes due 2019, dated as of December 10, 2013, among Headwaters, the guarantors named therein and Wilmington Trust, N.A. as trustee (including forms
of 71/4% Senior Notes due 2019) |
|
(30) |
|
4.2 |
|
Term Loan Credit Agreement dated as of March 24, 2015 among Headwaters, the guarantors party thereto, and Deutsche Bank as administrative agent |
|
(35) |
|
4.9 |
|
Loan and Security Agreement dated as of October 27, 2009, among certain Headwaters subsidiaries and Bank of America, N.A. as the sole administrative agent, arranger and collateral agent, and the lenders named
therein |
|
(20) |
|
4.9.1 |
|
First Amendment to Loan and Security Agreement among certain Headwaters subsidiaries and various lenders and First Amendment to Guaranty and Security Agreement, dated as of December 10, 2010 |
|
(17) |
61
Table of Contents
|
|
|
|
|
|
| Exhibit No. |
|
Description |
|
Location |
| |
4.9.2 |
|
Second Amendment to Loan and Security Agreement and Second Amendment to Guaranty and Security Agreement, dated as of February 15, 2011 among Headwaters, certain Headwaters subsidiaries and certain lenders named
therein |
|
(18) |
|
4.9.3 |
|
Third Amendment to Loan and Security Agreement, dated as of April 15, 2011 among Headwaters, certain Headwaters subsidiaries and certain lenders named therein |
|
(21) |
|
4.9.4 |
|
Fourth Amendment to Loan and Security Agreement and Third Amendment to Guaranty and Security Agreement, dated as of December 29, 2011 among Headwaters, certain Headwaters subsidiaries and certain lenders named
therein |
|
(23) |
|
4.9.5 |
|
Fifth Amendment to Loan and Security Agreement and Fourth Amendment to Guaranty and Security Agreement, dated as of April 26, 2012 among Headwaters, certain Headwaters subsidiaries and certain lenders named
therein |
|
(25) |
|
4.9.6 |
|
Sixth Amendment to Loan and Security Agreement, dated as of May 8, 2012 among Headwaters, certain Headwaters subsidiaries and certain lenders named therein |
|
(26) |
|
4.9.7 |
|
Seventh Amendment to Loan and Security Agreement, dated as of December 13, 2012 among Headwaters, certain Headwaters subsidiaries and certain lenders named therein |
|
(27) |
|
4.9.8 |
|
Eighth Amendment to Loan and Security Agreement and Fifth Amendment to Guaranty and Security Agreement, dated as of November 6, 2013 among Headwaters, certain Headwaters subsidiaries and certain lenders named
therein |
|
(29) |
|
4.9.9 |
|
Ninth Amendment to Loan and Security Agreement and Sixth Amendment to Guaranty and Security Agreement, dated as of December 9, 2013 among Headwaters, certain Headwaters subsidiaries and certain lenders named
therein |
|
(30) |
|
4.9.10 |
|
Tenth Amendment to Loan and Security Agreement, dated as of March 26, 2014 among Headwaters, certain Headwaters subsidiaries and certain lenders named therein |
|
(32) |
|
4.9.11 |
|
Eleventh Amendment to Loan and Security Agreement and Seventh Amendment to Guaranty and Security Agreement, dated as of March 2, 2015 among Headwaters, certain Headwaters subsidiaries and certain lenders named
therein |
|
(34) |
|
10.60 |
|
Employment Agreement with Kirk A. Benson dated as of June 23, 2014 |
|
(33) |
|
10.103 |
|
Employment agreement dated December 8, 2010 between Headwaters and Donald P. Newman |
|
(16) |
|
12 |
|
Computation of ratio of earnings to combined fixed charges and preferred stock dividends |
|
* |
|
14 |
|
Code of Ethics |
|
(4) |
|
21 |
|
List of Subsidiaries of Headwaters |
|
* |
|
23 |
|
Consent of BDO USA, LLP |
|
* |
|
31.1 |
|
Rule 13a-14(a)/15d-14(a) Certification of Chief Executive Officer |
|
* |
|
31.2 |
|
Rule 13a-14(a)/15d-14(a) Certification of Chief Financial Officer |
|
* |
|
32 |
|
Section 1350 Certifications of Chief Executive Officer and Chief Financial Officer |
|
* |
62
Table of Contents
|
|
|
|
|
|
| Exhibit No. |
|
Description |
|
Location |
| |
95 |
|
Mine Safety Disclosure |
|
* |
|
99.1 |
|
2000 Employee Stock Purchase Plan, as Amended and Restated Effective 5 November 2011 |
|
(23) |
|
99.2 |
|
1995 Stock Option Plan (originally designated as Exhibit No. 10.5) |
|
(1) |
|
99.2.1 |
|
First Amendment to the 1995 Stock Option Plan (originally designated as Exhibit 10.5.1) |
|
(1) |
|
99.4 |
|
2002 Stock Incentive Plan |
|
(3) |
|
99.7 |
|
2003 Stock Incentive Plan |
|
(2) |
|
99.10 |
|
Amended and Restated Long Term Incentive Compensation Plan (Effective March 3, 2009) |
|
(12) |
|
99.11 |
|
Nominating and Corporate Governance Committee Charter, dated December 19, 2008 |
|
(11) |
|
99.12 |
|
Audit Committee Charter, dated December 19, 2008 |
|
(11) |
|
99.13 |
|
Compensation Committee Charter, dated 1 May 2015 |
|
(36) |
|
99.17 |
|
Form of 2006 Executive Change in Control Agreement |
|
(6) |
|
99.17.1 |
|
Form of (first) Amendment to 2006 Executive Change in Control Agreement |
|
(15) |
|
99.17.2 |
|
Form of (second) Amendment to 2006 Executive Change in Control Agreement |
|
(22) |
|
99.17.3 |
|
Form of 2011 Executive Change in Control Agreement |
|
(22) |
|
99.18 |
|
Amended Deferred Compensation Plan |
|
(8) |
|
99.20 |
|
Stock Appreciation Right Agreement (November 2007) |
|
(9) |
|
99.20.1 |
|
Form of Notice of Stock Appreciation Right Grant (November 2007) |
|
(9) |
|
99.21 |
|
Restricted Stock Award Agreement (November 2007) |
|
(9) |
|
99.21.1 |
|
Form of Restricted Stock Award Grant Notice (November 2007) |
|
(9) |
|
99.22 |
|
2012 Executive Master Bonus Plan |
|
(24) |
|
99.23 |
|
Broad-Based Management Bonus Plan |
|
(25) |
|
99.24 |
|
Form of Common Stock Certificate |
|
(10) |
|
99.25 |
|
Form of Performance Unit Award Agreement (October 2008) |
|
(11) |
|
99.26 |
|
Form of Director Restricted Stock Unit Award Agreement (January 2009) |
|
(11) |
|
99.29 |
|
2010 Incentive Compensation Plan |
|
(14) |
|
99.29.1 |
|
Amendment No. 1 to 2010 Incentive Compensation Plan |
|
(24) |
|
99.30 |
|
Form of Performance Unit Award Agreement (April 2010) |
|
(14) |
|
99.31 |
|
Form of Notice of Cash-Settled Stock Appreciation Right Grant (November 2010) |
|
(15) |
|
99.34 |
|
Directors' Deferred Compensation Plan |
|
(25) |
|
99.35 |
|
Form of Performance Unit Award Agreement (November 2013) |
|
(31) |
|
101.INS |
|
XBRL Instance Document |
|
* |
63
Table of Contents
|
|
|
|
|
|
| Exhibit No. |
|
Description |
|
Location |
| |
101.SCH |
|
XBRL Taxonomy Extension Schema |
|
* |
|
101.CAL |
|
XBRL Taxonomy Extension Calculation Linkbase |
|
* |
|
101.DEF |
|
XBRL Taxonomy Extension Definition Linkbase |
|
* |
|
101.LAB |
|
XBRL Taxonomy Extension Label Linkbase |
|
* |
|
101.PRE |
|
XBRL Taxonomy Extension Presentation Linkbase |
|
* |
- *
- Filed
herewith.
Unless
another exhibit number is indicated as the exhibit number for the exhibit as "originally filed," the exhibit number in the filing in which any exhibit was originally filed and to which
reference is made hereby is the same as the exhibit number assigned herein to the exhibit.
- (1)
- Incorporated
by reference to the indicated exhibit filed with Headwaters' Registration Statement on Form 10, filed February 26, 1996.
- (2)
- Incorporated
by reference to the indicated exhibit filed with Headwaters' Quarterly Report on Form 10-Q, for the quarter ended December 31,
2002.
- (3)
- Incorporated
by reference to the indicated exhibit filed with Headwaters' Annual Report on Form 10-K, for the fiscal year ended September 30,
2004.
- (4)
- Incorporated
by reference to the indicated exhibit filed with Headwaters' Quarterly Report on Form 10-Q, for the quarter ended March 31, 2005.
- (5)
- Incorporated
by reference to the indicated exhibit filed with Headwaters' Current Report on Form 8-K, for the event dated March 1, 2005, filed
March 3, 2005.
- (6)
- Incorporated
by reference to the indicated exhibit filed with Headwaters' Quarterly Report on Form 10-Q, for the quarter ended June 30, 2006.
- (7)
- Incorporated
by reference to the indicated exhibit filed with Headwaters' Annual Report on Form 10-K, for the fiscal year ended September 30,
2006.
- (8)
- Incorporated
by reference to the indicated exhibit filed with Headwaters' Annual Report on Form 10-K, for the fiscal year ended September 30,
2007.
- (9)
- Incorporated
by reference to the indicated exhibit filed with Headwaters' Quarterly Report on Form 10-Q, for the quarter ended December 31,
2007.
- (10)
- Incorporated
by reference to the indicated exhibit filed with Headwaters' Annual Report on Form 10-K, for the fiscal year ended September 30,
2008.
- (11)
- Incorporated
by reference to the indicated exhibit filed with Headwaters' Quarterly Report on Form 10-Q, for the quarter ended December 31,
2008.
- (12)
- Incorporated
by reference to the indicated exhibit filed with Headwaters' Quarterly Report on Form 10-Q, for the quarter ended March 31,
2009.
- (13)
- Incorporated
by reference to the indicated exhibit filed with Headwaters' Current Report on Form 8-K, for the event dated December 19, 2008,
filed December 22, 2008.
- (14)
- Incorporated
by reference to the indicated exhibit filed with Headwaters' Quarterly Report on Form 10-Q, for the quarter ended March 31,
2010.
- (15)
- Incorporated
by reference to the indicated exhibit filed with Headwaters' Annual Report on Form 10-K, for the fiscal year ended September 30,
2010.
64
Table of Contents
- (16)
- Incorporated
by reference to the indicated exhibit filed with Headwaters' Current Report on Form 8-K, for the event dated December 8, 2010,
filed December 10, 2010.
- (17)
- Incorporated
by reference to the indicated exhibit filed with Headwaters' Current Report on Form 8-K, for the event dated December 10, 2010,
filed December 14, 2010.
- (18)
- Incorporated
by reference to the indicated exhibit filed with Headwaters' Current Report on Form 8-K, for the event dated February 15, 2011,
filed February 16, 2011.
- (19)
- Incorporated
by reference to the indicated exhibit filed with Headwaters' Current Report on Form 8-K, for the event dated February 24, 2011,
filed February 25, 2011.
- (20)
- Incorporated
by reference to the indicated exhibit filed with Headwaters' Current Report on Form 8-K/A, for the event dated October 27, 2009,
filed March 18, 2011.
- (21)
- Incorporated
by reference to the indicated exhibit filed with Headwaters' Quarterly Report on Form 10-Q, for the quarter ended March 31,
2011.
- (22)
- Incorporated
by reference to the indicated exhibit filed with Headwaters' Current Report on Form 8-K, for the event dated August 5, 2011,
filed August 8, 2011.
- (23)
- Incorporated
by reference to the indicated exhibit filed with Headwaters' Quarterly Report on Form 10-Q, for the quarter ended December 31,
2011.
- (24)
- Incorporated
by reference to the indicated exhibit filed with Headwaters' Current Report on Form 8-K, for the event dated February 23, 2012,
filed February 27, 2012.
- (25)
- Incorporated
by reference to the indicated exhibit filed with Headwaters' Quarterly Report on Form 10-Q, for the quarter ended March 31,
2012.
- (26)
- Incorporated
by reference to the indicated exhibit filed with Headwaters' Current Report on Form 8-K, for the event dated May 7, 2012, filed
May 9, 2012.
- (27)
- Incorporated
by reference to the indicated exhibit filed with Headwaters' Current Report on Form 8-K, for the event dated December 14, 2012,
filed December 17, 2012.
- (28)
- Incorporated
by reference to the indicated exhibit filed with Headwaters' Current Report on Form 8-K, for the event dated December 18, 2012,
filed December 26, 2012.
- (29)
- Incorporated
by reference to the indicated exhibit filed with Headwaters' Current Report on Form 8-K, for the event dated November 6, 2013,
filed November 12, 2013.
- (30)
- Incorporated
by reference to the indicated exhibit filed with Headwaters' Current Report on Form 8-K, for the event dated December 9, 2013,
filed December 12, 2013.
- (31)
- Incorporated
by reference to the indicated exhibit filed with Headwaters' Quarterly Report on Form 10-Q, for the quarter ended December 31,
2013.
- (32)
- Incorporated
by reference to the indicated exhibit filed with Headwaters' Quarterly Report on Form 10-Q, for the quarter ended March 31,
2014.
- (33)
- Incorporated
by reference to the indicated exhibit filed with Headwaters' Current Report on Form 8-K, for the event dated June 23, 2014,
filed June 25, 2014.
- (34)
- Incorporated
by reference to the indicated exhibit filed with Headwaters' Current Report on Form 8-K, for the event dated March 2, 2015,
filed March 6, 2015.
- (35)
- Incorporated
by reference to the indicated exhibit filed with Headwaters' Current Report on Form 8-K, for the event dated March 24, 2015,
filed March 24, 2015.
65
Table of Contents
- (36)
- Incorporated
by reference to the indicated exhibit filed with Headwaters' Quarterly Report on Form 10-Q, for the quarter ended March 31,
2015.
(b) Exhibits
The response to this portion of Item 15 is submitted as a separate section of this report. See Item 15 (a) 3 above.
(c) Financial Statement Schedules
The response to this portion of Item 15 is submitted as a separate section of this report. See Item 15 (a) 2 above.
66
Table of Contents
SIGNATURES
Pursuant to the requirements of Section 13 or 15(d) of the Securities Exchange Act of 1934, the Registrant has duly caused this
report to be signed on its behalf by the undersigned, thereunto duly authorized.
|
|
|
|
|
| |
|
HEADWATERS INCORPORATED |
|
|
By: |
|
/s/ KIRK A. BENSON
Kirk A. Benson
Chief Executive Officer (Principal Executive Officer) |
|
|
By: |
|
/s/ DONALD P. NEWMAN
Donald P. Newman
Chief Financial Officer (Principal Financial and Accounting Officer) |
|
|
Date: November 17, 2015
|
KNOW
ALL PERSONS BY THESE PRESENTS, that each person whose signature appears below constitutes and appoints Harlan M. Hatfield and Donald P. Newman, and each of them, his/her true and
lawful attorneys-in-fact and agents, each with full power of substitution and resubstitution, for him/her and in his/her name, place and stead, in any and all capacities, to sign any and all
amendments to this report on Form 10-K, and to file the same, with exhibits thereto and other documents in connection therewith, with the Securities and Exchange Commission, granting unto said
attorneys-in-fact and agents, and each of them, full power and authority to do and perform each and every act and thing requisite and necessary to be done, as fully to all intents and purposes as
he/she might or could do in person, hereby ratifying and confirming all that each of said attorneys-in-fact and agents or their substitute or substitutes may lawfully do or cause to be done by virtue
hereof.
Pursuant
to the requirements of the Securities Exchange Act of 1934, this report has been signed below by the following persons on behalf of the Registrant and in the capacities and on
the dates indicated.
|
|
|
|
|
SIGNATURE
|
|
TITLE
|
|
DATE
|
|
|
|
|
|
/s/ KIRK A. BENSON
Kirk A. Benson |
|
Director and Chief Executive Officer (Principal Executive Officer) |
|
November 17, 2015 |
/s/ DONALD P. NEWMAN
Donald P. Newman |
|
Chief Financial Officer (Principal Financial and Accounting Officer) |
|
November 17, 2015 |
/s/ JAMES A. HERICKHOFF
James A. Herickhoff |
|
Director |
|
November 17, 2015 |
67
Table of Contents
|
|
|
|
|
SIGNATURE
|
|
TITLE
|
|
DATE
|
|
|
|
|
|
/s/ R SAM CHRISTENSEN
R Sam Christensen |
|
Director |
|
November 17, 2015 |
/s/ MALYN K. MALQUIST
Malyn K. Malquist |
|
Director |
|
November 17, 2015 |
/s/ BLAKE O. FISHER, JR.
Blake O. Fisher, Jr. |
|
Director |
|
November 17, 2015 |
/s/ SYLVIA SUMMERS
Sylvia Summers |
|
Director |
|
November 17, 2015 |
/s/ THOMAS N. CHIEFFE
Thomas N. Chieffe |
|
Director |
|
November 17, 2015 |
68
Table of Contents
Report of Independent Registered Public Accounting Firm
The
Board of Directors and Stockholders
Headwaters Incorporated
South Jordan, Utah
We
have audited the accompanying consolidated balance sheets of Headwaters Incorporated as of September 30, 2014 and 2015 and the related consolidated statements of income,
changes in stockholders' equity (net capital deficiency), and cash flows for each of the three years in the period
ended September 30, 2015. These financial statements are the responsibility of the Company's management. Our responsibility is to express an opinion on these financial statements based on our
audits.
We
conducted our audits in accordance with the standards of the Public Company Accounting Oversight Board (United States). Those standards require that we plan and perform the audit to
obtain reasonable assurance about whether the consolidated financial statements are free of material misstatement. An audit includes examining, on a test basis, evidence supporting the amounts and
disclosures in the consolidated financial statements, assessing the accounting principles used and significant estimates made by management, as well as evaluating the overall financial statement
presentation. We believe that our audits provide a reasonable basis for our opinion.
In
our opinion, the consolidated financial statements referred to above present fairly, in all material respects, the consolidated financial position of Headwaters Incorporated at
September 30, 2014 and 2015, and the consolidated results of its operations and its cash flows for each of the three years in the period ended September 30, 2015, in conformity
with accounting principles generally accepted in the United States of America.
We
also have audited, in accordance with the standards of the Public Company Accounting Oversight Board (United States), Headwaters Incorporated's internal control over financial
reporting as of September 30, 2015, based on criteria established in Internal Control—Integrated Framework (2013) issued by the
Committee of Sponsoring Organizations of the Treadway Commission (COSO) and our report dated November 17, 2015 expressed an unqualified opinion thereon.
/s/
BDO USA, LLP
Costa
Mesa, California
November 17, 2015
F-1
Table of Contents
HEADWATERS INCORPORATED
CONSOLIDATED BALANCE SHEETS
|
|
|
|
|
|
|
|
|
|
As of September 30, |
|
(in thousands, except par value)
|
|
2014 |
|
2015 |
|
ASSETS |
|
|
|
|
|
|
|
Current assets: |
|
|
|
|
|
|
|
Cash and cash equivalents |
|
$ |
152,542 |
|
$ |
142,597 |
|
Trade receivables, net |
|
|
119,330 |
|
|
134,384 |
|
Inventories |
|
|
50,633 |
|
|
55,074 |
|
Current and deferred income taxes |
|
|
11,076 |
|
|
23,762 |
|
Other |
|
|
10,536 |
|
|
11,827 |
|
|
|
|
|
|
|
|
|
|
Total current assets |
|
|
344,117 |
|
|
367,644 |
|
|
|
|
|
|
|
|
|
|
Property, plant and equipment, net |
|
|
181,298 |
|
|
185,718 |
|
|
|
|
|
|
|
|
|
|
Other assets: |
|
|
|
|
|
|
|
Goodwill |
|
|
175,586 |
|
|
178,199 |
|
Intangible assets, net |
|
|
159,863 |
|
|
143,718 |
|
Deferred income taxes |
|
|
0 |
|
|
69,419 |
|
Other |
|
|
35,442 |
|
|
34,321 |
|
|
|
|
|
|
|
|
|
|
Total other assets |
|
|
370,891 |
|
|
425,657 |
|
|
|
|
|
|
|
|
|
|
Total assets |
|
$ |
896,306 |
|
$ |
979,019 |
|
|
|
|
|
|
|
|
|
|
|
|
|
|
|
|
|
|
|
|
|
|
|
|
|
|
|
|
LIABILITIES AND STOCKHOLDERS' EQUITY |
|
|
|
|
|
|
|
Current liabilities: |
|
|
|
|
|
|
|
Accounts payable |
|
$ |
27,026 |
|
$ |
25,306 |
|
Accrued personnel costs |
|
|
48,902 |
|
|
52,544 |
|
Accrued interest |
|
|
18,273 |
|
|
2,295 |
|
Current income taxes |
|
|
368 |
|
|
0 |
|
Other accrued liabilities |
|
|
41,757 |
|
|
49,486 |
|
Current portion of long-term debt |
|
|
0 |
|
|
4,250 |
|
|
|
|
|
|
|
|
|
|
Total current liabilities |
|
|
136,326 |
|
|
133,881 |
|
|
|
|
|
|
|
|
|
|
Long-term liabilities: |
|
|
|
|
|
|
|
Long-term debt, net |
|
|
592,458 |
|
|
558,080 |
|
Income taxes |
|
|
23,242 |
|
|
6,590 |
|
Other |
|
|
28,586 |
|
|
30,186 |
|
|
|
|
|
|
|
|
|
|
Total long-term liabilities |
|
|
644,286 |
|
|
594,856 |
|
|
|
|
|
|
|
|
|
|
Total liabilities |
|
|
780,612 |
|
|
728,737 |
|
|
|
|
|
|
|
|
|
|
Commitments and contingencies |
|
|
|
|
|
|
|
Redeemable non-controlling interest in consolidated subsidiary |
|
|
13,252 |
|
|
12,431 |
|
Stockholders' equity: |
|
|
|
|
|
|
|
Common stock, $0.001 par value; authorized 200,000 shares; issued and outstanding: 73,510 shares at September 30, 2014 (including 61 shares held in
treasury) and 73,896 shares at September 30, 2015 (including 83 shares held in treasury) |
|
|
74 |
|
|
74 |
|
Capital in excess of par value |
|
|
723,648 |
|
|
728,667 |
|
Retained earnings (accumulated deficit) |
|
|
(620,688 |
) |
|
(489,889 |
) |
Treasury stock |
|
|
(592 |
) |
|
(1,001 |
) |
|
|
|
|
|
|
|
|
|
Total stockholders' equity |
|
|
102,442 |
|
|
237,851 |
|
|
|
|
|
|
|
|
|
|
Total liabilities and stockholders' equity |
|
$ |
896,306 |
|
$ |
979,019 |
|
|
|
|
|
|
|
|
|
|
|
|
|
|
|
|
|
|
|
|
|
|
|
|
|
|
|
|
See accompanying notes.
F-2
Table of Contents
HEADWATERS INCORPORATED
CONSOLIDATED STATEMENTS OF INCOME
|
|
|
|
|
|
|
|
|
|
|
|
|
Year ended September 30, |
|
(in thousands, except per-share amounts)
|
|
2013 |
|
2014 |
|
2015 |
|
Revenue: |
|
|
|
|
|
|
|
|
|
|
Building products |
|
$ |
394,324 |
|
$ |
472,434 |
|
$ |
523,643 |
|
Construction materials |
|
|
293,000 |
|
|
309,337 |
|
|
352,263 |
|
Energy technology |
|
|
15,252 |
|
|
9,676 |
|
|
19,427 |
|
|
|
|
|
|
|
|
|
|
|
|
|
Total revenue |
|
|
702,576 |
|
|
791,447 |
|
|
895,333 |
|
Cost of revenue: |
|
|
|
|
|
|
|
|
|
|
Building products |
|
|
283,128 |
|
|
336,283 |
|
|
367,163 |
|
Construction materials |
|
|
219,996 |
|
|
224,888 |
|
|
249,077 |
|
Energy technology |
|
|
6,970 |
|
|
4,583 |
|
|
9,202 |
|
|
|
|
|
|
|
|
|
|
|
|
|
Total cost of revenue |
|
|
510,094 |
|
|
565,754 |
|
|
625,442 |
|
|
|
|
|
|
|
|
|
|
|
|
|
Gross profit |
|
|
192,482 |
|
|
225,693 |
|
|
269,891 |
|
Operating expenses: |
|
|
|
|
|
|
|
|
|
|
Selling, general and administrative |
|
|
117,841 |
|
|
137,650 |
|
|
149,623 |
|
Amortization |
|
|
20,230 |
|
|
21,319 |
|
|
18,161 |
|
|
|
|
|
|
|
|
|
|
|
|
|
Total operating expenses |
|
|
138,071 |
|
|
158,969 |
|
|
167,784 |
|
|
|
|
|
|
|
|
|
|
|
|
|
Operating income |
|
|
54,411 |
|
|
66,724 |
|
|
102,107 |
|
Other income (expense): |
|
|
|
|
|
|
|
|
|
|
Net interest expense |
|
|
(42,566 |
) |
|
(46,329 |
) |
|
(64,219 |
) |
Other, net |
|
|
364 |
|
|
(348 |
) |
|
(218 |
) |
|
|
|
|
|
|
|
|
|
|
|
|
Total other income (expense), net |
|
|
(42,202 |
) |
|
(46,677 |
) |
|
(64,437 |
) |
|
|
|
|
|
|
|
|
|
|
|
|
Income from continuing operations before income taxes |
|
|
12,209 |
|
|
20,047 |
|
|
37,670 |
|
Income tax benefit (provision) |
|
|
(3,924 |
) |
|
(3,574 |
) |
|
94,458 |
|
|
|
|
|
|
|
|
|
|
|
|
|
Income from continuing operations |
|
|
8,285 |
|
|
16,473 |
|
|
132,128 |
|
Loss from discontinued operations, net of income taxes |
|
|
(1,148 |
) |
|
(415 |
) |
|
(460 |
) |
|
|
|
|
|
|
|
|
|
|
|
|
Net income |
|
|
7,137 |
|
|
16,058 |
|
|
131,668 |
|
Net income attributable to non-controlling interest |
|
|
0 |
|
|
(774 |
) |
|
(869 |
) |
|
|
|
|
|
|
|
|
|
|
|
|
Net income attributable to Headwaters Incorporated |
|
$ |
7,137 |
|
$ |
15,284 |
|
$ |
130,799 |
|
|
|
|
|
|
|
|
|
|
|
|
|
|
|
|
|
|
|
|
|
|
|
|
|
|
|
|
|
|
|
|
|
|
|
|
|
Basic income (loss) per share attributable to Headwaters Incorporated: |
|
|
|
|
|
|
|
|
|
|
From continuing operations |
|
$ |
0.12 |
|
$ |
0.21 |
|
$ |
1.79 |
|
From discontinued operations |
|
|
(0.02 |
) |
|
(0.01 |
) |
|
(0.01 |
) |
|
|
|
|
|
|
|
|
|
|
|
|
|
|
$ |
0.10 |
|
$ |
0.20 |
|
$ |
1.78 |
|
|
|
|
|
|
|
|
|
|
|
|
|
|
|
|
|
|
|
|
|
|
|
|
|
|
|
|
|
|
|
|
|
|
|
|
|
Diluted income (loss) per share attributable to Headwaters Incorporated: |
|
|
|
|
|
|
|
|
|
|
From continuing operations |
|
$ |
0.12 |
|
$ |
0.21 |
|
$ |
1.74 |
|
From discontinued operations |
|
|
(0.02 |
) |
|
(0.01 |
) |
|
(0.01 |
) |
|
|
|
|
|
|
|
|
|
|
|
|
|
|
$ |
0.10 |
|
$ |
0.20 |
|
$ |
1.73 |
|
|
|
|
|
|
|
|
|
|
|
|
|
|
|
|
|
|
|
|
|
|
|
|
|
|
|
|
|
|
|
|
|
|
|
|
|
See accompanying notes.
F-3
Table of Contents
HEADWATERS INCORPORATED
CONSOLIDATED STATEMENTS OF CHANGES IN STOCKHOLDERS' EQUITY (NET CAPITAL DEFICIENCY)
|
|
|
|
|
|
|
|
|
|
|
|
|
|
|
|
|
|
|
|
|
|
|
|
|
|
|
|
|
|
|
|
Total
stockholders'
equity (net
capital
deficiency) |
|
|
|
Common stock |
|
|
|
Retained
earnings
(accumulated
deficit) |
|
|
|
|
|
Capital in
excess
of par value |
|
Treasury
stock |
|
(in thousands)
|
|
Shares |
|
Amount |
|
Balances as of September 30, 2012 |
|
|
61,146 |
|
$ |
61 |
|
$ |
640,047 |
|
$ |
(643,109 |
) |
$ |
(128 |
) |
$ |
(3,129 |
) |
Issuance of common stock, net of offering costs of $5,418 |
|
|
11,500 |
|
|
12 |
|
|
77,945 |
|
|
|
|
|
|
|
|
77,957 |
|
Issuance of common stock pursuant to employee stock purchase plan |
|
|
101 |
|
|
0 |
|
|
742 |
|
|
|
|
|
|
|
|
742 |
|
Exercise of stock appreciation rights and restricted stock units |
|
|
250 |
|
|
0 |
|
|
|
|
|
|
|
|
|
|
|
0 |
|
Issuance of restricted stock, net of cancellations |
|
|
152 |
|
|
0 |
|
|
|
|
|
|
|
|
|
|
|
0 |
|
Stock-based compensation |
|
|
|
|
|
|
|
|
1,703 |
|
|
|
|
|
|
|
|
1,703 |
|
Net 41 share increase in treasury stock held for deferred compensation plan obligations, at cost |
|
|
|
|
|
|
|
|
391 |
|
|
|
|
|
(391 |
) |
|
0 |
|
Net income for the year ended September 30, 2013 |
|
|
|
|
|
|
|
|
|
|
|
7,137 |
|
|
|
|
|
7,137 |
|
|
|
|
|
|
|
|
|
|
|
|
|
|
|
|
|
|
|
|
|
|
Balances as of September 30, 2013 |
|
|
73,149 |
|
|
73 |
|
|
720,828 |
|
|
(635,972 |
) |
|
(519 |
) |
|
84,410 |
|
|
|
|
|
|
|
|
|
|
|
|
|
|
|
|
|
|
|
|
|
|
Issuance of common stock pursuant to employee stock purchase plan |
|
|
78 |
|
|
1 |
|
|
758 |
|
|
|
|
|
|
|
|
759 |
|
Issuance of restricted stock, net of cancellations |
|
|
150 |
|
|
0 |
|
|
|
|
|
|
|
|
|
|
|
0 |
|
Exercise of stock appreciation rights and restricted stock units |
|
|
133 |
|
|
0 |
|
|
|
|
|
|
|
|
|
|
|
0 |
|
Stock-based compensation |
|
|
|
|
|
|
|
|
2,165 |
|
|
|
|
|
|
|
|
2,165 |
|
Net 4 share decrease in treasury stock held for deferred compensation plan obligations, at cost |
|
|
|
|
|
|
|
|
73 |
|
|
|
|
|
(73 |
) |
|
0 |
|
Adjustment of estimated redemption value of non-controlling interest in consolidated subsidiary |
|
|
|
|
|
|
|
|
(176 |
) |
|
|
|
|
|
|
|
(176 |
) |
Net income attributable to Headwaters Incorporated for the year ended September 30, 2014 |
|
|
|
|
|
|
|
|
|
|
|
15,284 |
|
|
|
|
|
15,284 |
|
|
|
|
|
|
|
|
|
|
|
|
|
|
|
|
|
|
|
|
|
|
Balances as of September 30, 2014 |
|
|
73,510 |
|
|
74 |
|
|
723,648 |
|
|
(620,688 |
) |
|
(592 |
) |
|
102,442 |
|
|
|
|
|
|
|
|
|
|
|
|
|
|
|
|
|
|
|
|
|
|
Issuance of common stock pursuant to employee stock purchase plan |
|
|
58 |
|
|
0 |
|
|
804 |
|
|
|
|
|
|
|
|
804 |
|
Issuance of restricted stock, net of cancellations |
|
|
112 |
|
|
0 |
|
|
|
|
|
|
|
|
|
|
|
0 |
|
Exercise of stock appreciation rights |
|
|
216 |
|
|
0 |
|
|
|
|
|
|
|
|
|
|
|
0 |
|
Tax benefit from exercise of stock appreciation rights and vesting of restricted stock |
|
|
|
|
|
|
|
|
980 |
|
|
|
|
|
|
|
|
980 |
|
Stock-based compensation |
|
|
|
|
|
|
|
|
2,826 |
|
|
|
|
|
|
|
|
2,826 |
|
Net 22 share increase in treasury stock held for deferred compensation plan obligations, at cost |
|
|
|
|
|
|
|
|
409 |
|
|
|
|
|
(409 |
) |
|
0 |
|
Net income attributable to Headwaters Incorporated for the year ended September 30, 2015 |
|
|
|
|
|
|
|
|
|
|
|
130,799 |
|
|
|
|
|
130,799 |
|
|
|
|
|
|
|
|
|
|
|
|
|
|
|
|
|
|
|
|
|
|
Balances as of September 30, 2015 |
|
|
73,896 |
|
$ |
74 |
|
$ |
728,667 |
|
$ |
(489,889 |
) |
$ |
(1,001 |
) |
$ |
237,851 |
|
|
|
|
|
|
|
|
|
|
|
|
|
|
|
|
|
|
|
|
|
|
|
|
|
|
|
|
|
|
|
|
|
|
|
|
|
|
|
|
|
|
|
|
|
|
|
|
|
|
|
|
|
|
|
|
|
|
|
|
|
|
|
|
See accompanying notes.
F-4
Table of Contents
HEADWATERS INCORPORATED
CONSOLIDATED STATEMENTS OF CASH FLOWS
|
|
|
|
|
|
|
|
|
|
|
|
|
Year ended September 30, |
|
(in thousands)
|
|
2013 |
|
2014 |
|
2015 |
|
Cash flows from operating activities: |
|
|
|
|
|
|
|
|
|
|
Net income |
|
$ |
7,137 |
|
$ |
16,058 |
|
$ |
131,668 |
|
Adjustments to reconcile net income to net cash provided by operating activities: |
|
|
|
|
|
|
|
|
|
|
Depreciation and amortization |
|
|
52,317 |
|
|
55,134 |
|
|
53,973 |
|
Interest expense related to amortization of debt issue costs and debt discount |
|
|
5,841 |
|
|
2,175 |
|
|
6,180 |
|
Stock-based compensation |
|
|
1,703 |
|
|
2,165 |
|
|
2,826 |
|
Deferred income taxes |
|
|
698 |
|
|
1,666 |
|
|
(96,742 |
) |
Tax benefit from exercise of stock appreciation rights and vesting of restricted stock |
|
|
0 |
|
|
0 |
|
|
(1,543 |
) |
Net loss (gain) on disposition of property, plant and equipment |
|
|
(649 |
) |
|
95 |
|
|
49 |
|
Loss (gain) on sale of discontinued operations, net of income taxes |
|
|
55 |
|
|
(2,727 |
) |
|
229 |
|
Asset impairments |
|
|
0 |
|
|
1,815 |
|
|
0 |
|
Net loss of unconsolidated joint ventures |
|
|
0 |
|
|
529 |
|
|
262 |
|
Decrease (increase) in trade receivables |
|
|
(5,035 |
) |
|
517 |
|
|
(14,194 |
) |
Decrease (increase) in inventories |
|
|
2,221 |
|
|
(2,347 |
) |
|
(1,007 |
) |
Decrease in accounts payable and accrued liabilities |
|
|
(4,218 |
) |
|
(13,225 |
) |
|
(11,557 |
) |
Other changes in operating assets and liabilities, net |
|
|
(1,507 |
) |
|
(1,478 |
) |
|
(6,756 |
) |
|
|
|
|
|
|
|
|
|
|
|
|
Net cash provided by operating activities |
|
|
58,563 |
|
|
60,377 |
|
|
63,388 |
|
|
|
|
|
|
|
|
|
|
|
|
|
Cash flows from investing activities: |
|
|
|
|
|
|
|
|
|
|
Business acquisitions |
|
|
(43,250 |
) |
|
(95,604 |
) |
|
(5,650 |
) |
Investments in unconsolidated joint ventures |
|
|
0 |
|
|
(1,875 |
) |
|
(125 |
) |
Purchase of property, plant and equipment |
|
|
(29,119 |
) |
|
(35,799 |
) |
|
(36,859 |
) |
Proceeds from disposition of property, plant and equipment |
|
|
791 |
|
|
905 |
|
|
915 |
|
Proceeds from sale of discontinued operations |
|
|
4,813 |
|
|
4,666 |
|
|
0 |
|
Net decrease (increase) in long-term receivables and deposits |
|
|
(1,171 |
) |
|
7,445 |
|
|
3,450 |
|
Net change in other assets |
|
|
(437 |
) |
|
(1,556 |
) |
|
(597 |
) |
|
|
|
|
|
|
|
|
|
|
|
|
Net cash used in investing activities |
|
|
(68,373 |
) |
|
(121,818 |
) |
|
(38,866 |
) |
|
|
|
|
|
|
|
|
|
|
|
|
Cash flows from financing activities: |
|
|
|
|
|
|
|
|
|
|
Net proceeds from issuance of common stock |
|
|
77,957 |
|
|
0 |
|
|
0 |
|
Net proceeds from issuance of long-term debt |
|
|
0 |
|
|
146,650 |
|
|
414,675 |
|
Payments on long-term debt |
|
|
(47,355 |
) |
|
(7,792 |
) |
|
(449,799 |
) |
Dividends paid to non-controlling interest in consolidated subsidiary |
|
|
0 |
|
|
(950 |
) |
|
(1,690 |
) |
Employee stock purchases |
|
|
742 |
|
|
759 |
|
|
804 |
|
Tax benefit from exercise of stock appreciation rights and vesting of restricted stock |
|
|
0 |
|
|
0 |
|
|
1,543 |
|
|
|
|
|
|
|
|
|
|
|
|
|
Net cash provided by (used in) financing activities |
|
|
31,344 |
|
|
138,667 |
|
|
(34,467 |
) |
|
|
|
|
|
|
|
|
|
|
|
|
Net increase (decrease) in cash and cash equivalents |
|
|
21,534 |
|
|
77,226 |
|
|
(9,945 |
) |
Cash and cash equivalents, beginning of year |
|
|
53,782 |
|
|
75,316 |
|
|
152,542 |
|
|
|
|
|
|
|
|
|
|
|
|
|
Cash and cash equivalents, end of year |
|
$ |
75,316 |
|
$ |
152,542 |
|
$ |
142,597 |
|
|
|
|
|
|
|
|
|
|
|
|
|
|
|
|
|
|
|
|
|
|
|
|
|
|
|
|
|
|
|
|
|
|
|
|
|
Supplemental non-cash investing and financing activities: |
|
|
|
|
|
|
|
|
|
|
Increase in accrued liabilities for acquisition-related commitments |
|
$ |
0 |
|
$ |
2,614 |
|
$ |
0 |
|
Purchase of assets in exchange for future obligations |
|
$ |
0 |
|
$ |
2,875 |
|
$ |
4,203 |
|
Supplemental disclosure of cash flow information: |
|
|
|
|
|
|
|
|
|
|
Cash paid for interest |
|
$ |
37,290 |
|
$ |
42,572 |
|
$ |
58,681 |
|
Cash paid for income taxes |
|
|
2,537 |
|
|
1,729 |
|
|
3,295 |
|
See accompanying notes.
F-5
Table of Contents
HEADWATERS INCORPORATED
NOTES TO CONSOLIDATED FINANCIAL STATEMENTS
September 30, 2015
1. Description of Business and Organization
Headwaters Incorporated (Headwaters) is a building materials company incorporated in Delaware, providing products and services in two core business segments.
The
building products segment designs, manufactures, and sells a wide variety of building products, including exterior vinyl siding accessories (such as shutters, mounting blocks, and
vents), manufactured architectural stone, roofing materials and concrete block. Revenues from Headwaters' building products businesses are diversified geographically and also by end use, including new
housing construction and residential repair and remodeling, as well as commercial construction.
The
construction materials segment is the nationwide leader in the management and marketing of coal combustion products (CCPs), including fly ash which is primarily sold directly to
concrete manufacturers who use it as a mineral admixture for the partial replacement of portland cement in concrete. Headwaters' construction materials business is comprised of a nationwide supply,
storage and distribution network. Headwaters also provides services to electric utilities related to the management of CCPs.
In
addition to the two building materials segments described above, Headwaters also has a non-core energy technology segment which has been focused on reducing waste and increasing the
value of energy-related feedstocks, primarily in the areas of low-value oil and coal. In oil, Headwaters' heavy oil upgrading process uses a liquid catalyst precursor to generate a highly active
molecular catalyst to convert low-value residual oil into higher-value distillates that can be further refined into gasoline, diesel and other products. In coal, Headwaters owned and operated coal
cleaning facilities that separate ash from waste coal to provide a refined coal product that is higher in Btu value and lower in impurities than the feedstock coal. As described in Note 5,
Headwaters disposed of its remaining coal cleaning facilities in January 2013 and the results of Headwaters' coal cleaning operations have been presented as discontinued operations for all periods.
Headwaters'
fiscal year ends on September 30 and unless otherwise noted, references to years refer to Headwaters' fiscal year rather than a calendar year.
2. Summary of Significant Accounting Policies
Principles of Consolidation—The consolidated financial statements include the accounts of Headwaters, all of its
subsidiaries and other entities in which Headwaters has a controlling interest. In accordance with the requirements of Accounting Standards Codification (ASC) Topic 810 Consolidation, Headwaters is
required to consolidate any variable interest entities for which it is the
primary beneficiary. For investments in entities in which Headwaters has a significant influence over operating and financial decisions (generally defined as owning a voting or economic interest of
20% to 50%), Headwaters applies the equity method of accounting. In instances where Headwaters' investment is less than 20% and significant influence does not exist, investments are carried at cost.
As of September 30, 2015, there are no material variable interest entities or equity-method investments. All significant intercompany transactions and accounts are eliminated in consolidation.
Use of Estimates—The preparation of consolidated financial statements in conformity with U.S. generally accepted
accounting principles (GAAP) requires management to make estimates and assumptions that affect i) the reported amounts of assets and liabilities and disclosures of contingent assets and
liabilities at the date of the financial statements, and ii) the reported amounts of revenue and expenses during the reporting period. Actual results could differ materially from those
estimates.
F-6
Table of Contents
HEADWATERS INCORPORATED
NOTES TO CONSOLIDATED FINANCIAL STATEMENTS (Continued)
September 30, 2015
2. Summary of Significant Accounting Policies (Continued)
Segment Reporting, Major Customers and Other Concentrations of Risk—Headwaters currently operates three business
segments: building products, construction materials and energy technology. Additional information about these segments is presented in Note 3. No customer accounted for over 10% of total
revenue in any year presented and less than 10% of Headwaters' revenue was from sales outside the United States. Approximately 12%, 10% and 9% of Headwaters' total revenue and cost of revenue was for
services in 2013, 2014 and 2015, respectively. Substantially all service-related revenue for all periods was in the construction materials segment. Headwaters normally purchases a majority of the
polypropylene and poly vinyl chloride (PVC) used in its resin-based building products from a limited number of suppliers; however, both materials could be obtained from other suppliers if necessary
and management currently believes any required change in suppliers would not be materially disruptive.
Revenue Recognition and Cost of Revenue—Revenue from the sale of building products, CCPs and energy-related products is
recognized upon passage of title to the customer, which coincides with physical delivery and assumption of risk of loss by the customer. Estimated sales rebates and discounts pertaining to the sale of
building products are provided for at the time of sale and are based primarily upon established policies and historical experience. Revenues include transportation charges and shipping and handling
fees associated with delivering products and materials to customers when the
transportation and/or shipping and handling is contractually provided for between the customer and Headwaters. Cost of revenue includes shipping and handling fees.
CCP
service revenues are primarily earned under long-term contracts to dispose of residual materials created by coal-fired electric power generation. Generally, revenues under long-term
site service contracts are recognized concurrently with the removal of material and are based on the volume of material removed at established prices per ton. Certain service revenue under these
contracts is recognized on a time and materials basis in the period in which the services are performed. In compliance with contractual obligations, the cost of CCPs purchased from certain utilities
is based on a percentage of the "net revenues" from sale of the CCPs purchased. Costs also include landfill fees and transportation charges to deliver non-marketable CCPs to landfills.
Cash and Cash Equivalents—Headwaters considers all short-term, highly-liquid investments with a maturity of three months
or less when purchased to be cash equivalents. Certain cash and cash equivalents are deposited with financial institutions, and at times such amounts exceed insured depository limits.
Receivables—Allowances are provided for uncollectible accounts and notes when deemed necessary. Such allowances are based
on an account-by-account analysis of collectability or impairment plus a provision for non-customer specific defaults based upon historical collection experience. Headwaters performs periodic credit
evaluations of its customers but collateral is not required for trade receivables. Collateral is generally required for notes receivable, which were not material during the periods presented.
Inventories—Inventories are stated at the lower of cost or market (net realizable value). Cost includes direct material,
transportation, direct labor and allocations of manufacturing overhead costs and is determined primarily using the first-in, first-out method.
F-7
Table of Contents
HEADWATERS INCORPORATED
NOTES TO CONSOLIDATED FINANCIAL STATEMENTS (Continued)
September 30, 2015
2. Summary of Significant Accounting Policies (Continued)
Property, Plant and Equipment—Property, plant and equipment are recorded at cost. For
significant self-constructed assets, cost includes direct labor and interest. Expenditures for major improvements are capitalized; expenditures for maintenance, repairs and minor improvements are
charged to expense as incurred. Assets are depreciated using primarily the straight-line method over their estimated useful lives, limited to the lease terms for improvements to leased assets. The
units-of-production method is used to depreciate certain building products segment assets. Upon the sale or retirement of property, plant and equipment, any gain or loss on disposition is reflected in
results of operations and the related asset cost and accumulated depreciation are removed from the respective accounts.
Intangible Assets and Goodwill—Intangible assets consist primarily of identifiable intangible assets obtained in
connection with acquisitions. With the exception of certain indefinite-lived trade names, intangible assets are amortized using the straight-line method, Headwaters' best estimate of the pattern of
economic benefit, over their estimated useful lives. Goodwill consists of the excess of the purchase price for acquired businesses over the fair value of assets acquired, net of liabilities assumed.
As described in more detail in Note 7, in accordance with ASC Topic 350 Intangibles—Goodwill and Other, goodwill and indefinite-lived intangible assets are not amortized, but are
tested at least annually for impairment. Amortizable intangible assets are tested for impairment only when an indicator of impairment exists.
Valuation of Long-Lived Assets—Headwaters evaluates the carrying value of long-lived assets, including amortizable
intangible assets, as well as the related depreciation and amortization periods, to determine whether adjustments to carrying amounts or to estimated useful lives are required based on current events
and circumstances. The carrying value of a long-lived asset is considered impaired when the anticipated cumulative undiscounted cash flow from that asset is less than its carrying value. In that
event, a loss is recognized based on the amount by which the carrying value exceeds the fair value of the long-lived asset.
Debt Issue Costs and Debt Repayment Premiums—Debt issue costs represent direct costs incurred for the issuance of
long-term debt and, except for costs related to the ABL Revolver (see Note 8), are reflected as a reduction of the carrying value of the respective long-term debt to which they relate. Debt
issue costs related to the ABL Revolver are classified in other assets because the ABL Revolver has not been drawn since inception. Debt issue costs are amortized to interest expense over the terms of
the respective debt using the effective interest method. When debt is repaid early, the portion of unamortized debt issue costs related to the early principal repayment is written off and included in
interest expense. Any premiums associated with the repayment of debt are also charged to interest expense.
Financial Instruments—Derivatives are recorded in the consolidated balance sheet at fair
value, as required by ASC Topic 815 Derivatives and Hedging. Accounting for changes in the fair value of a derivative depends on the intended use of the derivative, which is established at inception.
For derivatives designated as cash flow hedges and which meet the effectiveness guidelines of ASC Topic 815, changes in fair value, to the extent effective, are recognized in other comprehensive
income until the hedged item is recognized in earnings. Hedge effectiveness is measured at least quarterly based on the relative changes in fair value between the derivative contract and the hedged
item over time. Any
F-8
Table of Contents
HEADWATERS INCORPORATED
NOTES TO CONSOLIDATED FINANCIAL STATEMENTS (Continued)
September 30, 2015
2. Summary of Significant Accounting Policies (Continued)
change
in fair value of a derivative resulting from ineffectiveness, or an excluded component of the gain or loss, is recognized immediately and is recorded as interest expense.
Headwaters
formally documents all hedge transactions at inception of the contract, including identification of the hedging instruments and the hedged items, as well as its risk
management objectives and strategies for undertaking the hedge transaction. This process includes linking the derivatives that are designated as hedges to specific assets, liabilities, firm
commitments or forecasted transactions. Headwaters also formally assesses the effectiveness of any hedging instruments on an ongoing basis. Historically, Headwaters has entered into hedge agreements
primarily to limit its exposure for interest rate movements and certain commodity price fluctuations.
In
connection with the issuance of certain convertible senior subordinated notes, Headwaters entered into convertible note hedge and warrant transactions for the purpose of effectively
increasing the common stock conversion price. This convertible note hedge terminated when the notes were repaid in full in 2014. Since that time, and as of September 30, 2015, Headwaters has
had no material hedge agreements or other derivatives in place.
Asset Retirement Obligations—From time to time Headwaters incurs asset retirement obligations associated with the
restoration of certain CCP disposal sites. Headwaters records its legal obligations associated with the retirement of long-lived assets in accordance with the requirements of ASC Topic 410
Asset Retirements and Environmental Obligations. The fair value of a liability for an asset retirement obligation is recognized in the consolidated financial statements when the asset is placed in
service. At such time, the fair value of the liability is estimated using discounted cash flows. In subsequent periods, the retirement obligation is accreted to its estimated future value as of the
asset retirement date through charges to operating expenses. An asset equal in value to the retirement obligation is also recorded as a component of the carrying amount of the long-lived asset and is
depreciated over the asset's useful life. As of September 30, 2014 and 2015, CCP asset retirement obligations totaled $0. However, as described in Note 5, one of Headwaters' subsidiaries
is performing permit reclamation responsibilities at a former coal cleaning facility site. As of September 30, 2014 and 2015, approximately $8.0 million and $7.4 million,
respectively, was accrued for this reclamation liability.
Income Taxes—Headwaters files a consolidated federal income tax return with substantially all of its subsidiaries.
Income taxes are determined on an entity-by-entity basis and are accounted for in accordance with ASC Topic 740 Income Taxes. Headwaters recognizes deferred tax assets or liabilities for the expected
future tax consequences of events that have been recognized in the financial statements or in income tax returns. Deferred tax assets or liabilities are determined based upon the differences between
the financial statement and tax bases of assets and liabilities using enacted tax rates expected to apply when the differences are expected to be settled or realized. Deferred income tax assets are
periodically reviewed for recoverability based on current events, and valuation allowances are provided as necessary. Expenses for interest and penalties related to income taxes are classified within
the income tax provision.
Advertising Costs—Advertising costs are expensed as incurred, except for the cost of certain materials which are
capitalized and amortized to expense as the materials are distributed. Total
F-9
Table of Contents
HEADWATERS INCORPORATED
NOTES TO CONSOLIDATED FINANCIAL STATEMENTS (Continued)
September 30, 2015
2. Summary of Significant Accounting Policies (Continued)
advertising
costs were approximately $6.2 million, $8.0 million and $7.1 million in 2013, 2014 and 2015, respectively.
Warranty Costs—Provision is made for warranty costs at the time of sale, based upon established policies and historical
experience.
Contingencies—In accounting for legal matters and other contingencies, Headwaters follows the guidance in ASC Topic 450
Contingencies, under which loss contingencies are accounted for based upon the likelihood of an impairment of an asset or the incurrence of a liability. If a loss contingency is "probable" and the
amount of loss can be reasonably estimated, it is accrued. If a loss contingency is "probable" but the amount of loss cannot be reasonably estimated, disclosure is made. If a loss contingency is
"reasonably possible," disclosure is made, including the potential range of loss, if determinable. Loss contingencies that are "remote" are neither accounted for nor disclosed. Gain contingencies are
given no accounting recognition until realized, but are disclosed if material. Headwaters records legal fees associated with loss contingencies when incurred and does not record estimated future legal
fees.
Stock-Based Compensation—Headwaters uses the fair value method of accounting for stock-based compensation required by ASC
Topic 718 Compensation—Stock Compensation. ASC Topic 718 requires companies to expense the value of equity-based awards. Stock-based compensation expense is reported within the same
expense line items as used for cash compensation expense. Excess tax benefits resulting from exercise of stock options and stock appreciation rights (SARs) are reflected as necessary in the
consolidated statement of changes in stockholders' equity and in financing cash flows in the statement of cash flows.
Headwaters
recognizes compensation expense equal to the grant-date fair value of stock-based awards for all awards expected to vest, over the period during which the related service is
rendered by grantees. The fair value of stock-based awards is determined primarily using the Black-Scholes-Merton option pricing model (B-S-M model), adjusted where necessary to account for specific
terms of awards that the B-S-M model does not have the capability to consider; for example, awards which have a cap on allowed appreciation. For such awards, the output determined by the B-S-M model
has been reduced by an amount determined by a Quasi-Monte Carlo simulation to reflect the reduction in fair value associated with the appreciation cap or other award feature.
The
B-S-M model was developed for use in estimating the fair value of traded options that have no vesting restrictions and that are fully transferable. Option valuation models require
the input of certain subjective assumptions, including expected stock price volatility and expected term. For stock-based awards, Headwaters primarily uses the "graded vesting" or accelerated method
to allocate compensation expense over the requisite service periods. Estimated forfeiture rates are based largely on historical data and ranged from 1% to 2% during the periods presented. As of
September 30, 2015, the estimated forfeiture rate for most unvested awards was 1% per year.
Earnings per Share Calculation—Earnings per share (EPS) has been computed based on the weighted-average number of common
shares outstanding. Diluted EPS computations reflect the increase in weighted-average common shares outstanding that would result from the assumed exercise of outstanding stock-based awards calculated
using the treasury stock method, and the assumed
F-10
Table of Contents
HEADWATERS INCORPORATED
NOTES TO CONSOLIDATED FINANCIAL STATEMENTS (Continued)
September 30, 2015
2. Summary of Significant Accounting Policies (Continued)
conversion
of convertible securities using the if-converted method, when such stock-based awards or convertible securities are dilutive.
In
accordance with the requirements of ASC Topic 260 Earnings Per Share, the diluted EPS calculations consider all of the following as assumed proceeds in using the treasury stock method
to calculate whether and to what extent options and SARs are dilutive: i) the amount employees must pay upon exercise; plus ii) the average amount of unrecognized compensation cost
during the period attributed to future service; plus iii) the amount of tax benefits, if any, that would be credited to additional paid-in capital if the award were to be exercised.
Recent Accounting Pronouncements—In April 2015, the Financial Accounting Standards Board (FASB) issued Accounting
Standards Update (ASU) 2015-03, Interest—Imputation of Interest (ASC Topic 835-30). This new rule was issued to simplify the presentation of debt issue costs to require that debt issue
costs related to a recognized debt liability be presented in the balance sheet as a direct deduction from the carrying amount of that debt liability, consistent with debt discounts. The recognition
and measurement guidance for debt issue costs were not affected by the amendments in the ASU. Early adoption of ASU 2015-03 is permitted for financial statements that have not been previously issued
and Headwaters elected to adopt the ASU effective as of March 31, 2015, with retrospective application to the September 30, 2014 balance sheet.
The
effect of the adoption of ASU 2015-03 was to reclassify debt issue costs of approximately $7.1 million as of September 30, 2014 as a deduction from the related debt
liabilities. Accordingly, other assets and total assets in the 2014 balance sheet were reduced by that amount, and long-term debt and total liabilities were reduced by the same amount. There was no
effect on net income.
In
May 2014, the FASB issued ASU 2014-09, Revenue from Contracts with Customers (ASC Topic 606). This new revenue standard creates a single source of revenue guidance for all
companies in all industries and is more principles-based than current revenue guidance. In August 2015, the FASB issued ASU 2015-14, Revenue from Contracts with Customers (Topic 606): Deferral of the
Effective Date, which deferred the effective date of ASU 2014-09. The mandatory adoption date of ASC 606 for Headwaters is now October 1, 2018. There are two methods of adoption allowed, either
a "full" retrospective adoption or a "modified" retrospective adoption. Headwaters is currently evaluating the impact of ASC 606, but at the current time does not know what impact the new standard
will have on revenue recognized and other accounting decisions in future periods, if any, nor what method of adoption will be selected if the impact is material.
Headwaters
has reviewed other recently issued accounting standards which have not yet been adopted in order to determine their potential effect, if any, on the results of operations or
financial position of Headwaters. Based on the review of these other recently issued standards, Headwaters does not currently believe that any of those accounting pronouncements will have a
significant effect on its current or future financial position, results of operations, cash flows or disclosures.
Reclassifications—Certain prior period amounts, including the changes described above
for the accounting for debt issue costs, have been reclassified to conform to the current period's presentation. The reclassifications had no effect on net income, but the reclassification of debt
issue costs did affect total assets and total liabilities.
F-11
Table of Contents
HEADWATERS INCORPORATED
NOTES TO CONSOLIDATED FINANCIAL STATEMENTS (Continued)
September 30, 2015
3. Segment Reporting
Headwaters currently operates three business segments: building products, construction materials and energy technology. These segments are managed and evaluated separately by management
due to differences in their operations, products and services. Revenues for the building products segment consist of product sales to wholesale and retail distributors, contractors and other users of
building products. Revenues for the construction materials segment consist primarily of CCP sales to ready-mix concrete businesses, with a smaller amount from services provided to coal-fueled electric
generating utilities. Continuing revenues for the energy technology segment consist primarily of catalyst sales to oil refineries. As described in Note 5, Headwaters sold all of its coal
cleaning facilities in 2012 and 2013 and the results of operations have been reflected as discontinued operations in the accompanying statements of income for all periods. Intersegment sales are
immaterial.
The
following segment information has been prepared in accordance with ASC Topic 280 Segment Reporting. Segment performance is evaluated primarily on revenue and operating income,
although other factors are also used, such as Adjusted EBITDA, a non-GAAP financial measure. Headwaters defines Adjusted EBITDA as net income plus net interest expense, income taxes, depreciation and
amortization, stock-based compensation, cash-based compensation tied to stock price, goodwill and other impairments, and other non-routine adjustments that arise from time to time.
Segment
costs and expenses considered in deriving segment operating income include cost of revenue, amortization, and segment-specific selling, general and administrative expenses.
Amounts included in the Corporate column represent expenses that are not allocated to any segment and include administrative departmental costs and general corporate overhead. Segment assets reflect
those specifically attributable to individual segments and primarily include cash, accounts receivable, inventories, property, plant and equipment, goodwill and intangible assets. Certain other assets
are included in the Corporate column. The net operating results of the discontinued coal cleaning business are reflected in the single line item for discontinued operations.
|
|
|
|
|
|
|
|
|
|
|
|
|
|
|
|
|
|
|
2013 |
|
(in thousands)
|
|
Building
products |
|
Construction
materials |
|
Energy
technology |
|
Corporate |
|
Totals |
|
Segment revenue |
|
$ |
394,324 |
|
$ |
293,000 |
|
$ |
15,252 |
|
$ |
0 |
|
$ |
702,576 |
|
|
|
|
|
|
|
|
|
|
|
|
|
|
|
|
|
|
|
|
|
|
|
|
|
|
|
|
|
|
|
|
|
|
|
|
|
|
|
|
|
|
|
|
|
|
|
|
|
|
|
|
|
|
|
Depreciation and amortization |
|
$ |
(37,065 |
) |
$ |
(12,809 |
) |
$ |
(2,153 |
) |
$ |
(290 |
) |
$ |
(52,317 |
) |
|
|
|
|
|
|
|
|
|
|
|
|
|
|
|
|
|
|
|
|
|
|
|
|
|
|
|
|
|
|
|
|
|
|
|
|
|
|
|
|
|
|
|
|
|
|
|
|
|
|
|
|
|
|
Operating income (loss) |
|
$ |
34,194 |
|
$ |
43,519 |
|
$ |
(1,939 |
) |
$ |
(21,363 |
) |
$ |
54,411 |
|
|
|
|
|
|
|
|
|
|
|
|
|
|
|
|
|
|
|
|
|
|
|
|
|
|
|
|
|
|
|
|
|
|
|
|
|
|
|
|
|
|
|
|
|
|
|
|
|
|
|
|
|
|
|
Net interest expense |
|
|
|
|
|
|
|
|
|
|
|
|
|
|
(42,566 |
) |
Other income (expense), net |
|
|
|
|
|
|
|
|
|
|
|
|
|
|
364 |
|
Income tax provision |
|
|
|
|
|
|
|
|
|
|
|
|
|
|
(3,924 |
) |
|
|
|
|
|
|
|
|
|
|
|
|
|
|
|
|
|
|
Income from continuing operations |
|
|
|
|
|
|
|
|
|
|
|
|
|
|
8,285 |
|
Loss from discontinued operations, net of income taxes |
|
|
|
|
|
|
|
|
|
|
|
|
|
|
(1,148 |
) |
|
|
|
|
|
|
|
|
|
|
|
|
|
|
|
|
|
|
Net income |
|
|
|
|
|
|
|
|
|
|
|
|
|
$ |
7,137 |
|
|
|
|
|
|
|
|
|
|
|
|
|
|
|
|
|
|
|
|
|
|
|
|
|
|
|
|
|
|
|
|
|
|
|
|
|
|
|
|
|
|
|
|
|
|
|
|
|
|
|
|
|
|
|
Capital expenditures |
|
$ |
21,455 |
|
$ |
4,851 |
|
$ |
634 |
|
$ |
2,179 |
|
$ |
29,119 |
|
|
|
|
|
|
|
|
|
|
|
|
|
|
|
|
|
|
|
|
|
|
|
|
|
|
|
|
|
|
|
|
|
|
|
|
|
|
|
|
|
|
|
|
|
|
|
|
|
|
|
|
|
|
|
Segment assets |
|
$ |
306,686 |
|
$ |
358,684 |
|
$ |
34,509 |
|
$ |
18,648 |
|
$ |
718,527 |
|
|
|
|
|
|
|
|
|
|
|
|
|
|
|
|
|
|
|
|
|
|
|
|
|
|
|
|
|
|
|
|
|
|
|
|
|
|
|
|
|
|
|
|
|
|
|
|
|
|
|
|
|
|
|
F-12
Table of Contents
HEADWATERS INCORPORATED
NOTES TO CONSOLIDATED FINANCIAL STATEMENTS (Continued)
September 30, 2015
3. Segment Reporting (Continued)
|
|
|
|
|
|
|
|
|
|
|
|
|
|
|
|
|
|
|
2014 |
|
(in thousands)
|
|
Building
products |
|
Construction
materials |
|
Energy
technology |
|
Corporate |
|
Totals |
|
Segment revenue |
|
$ |
472,434 |
|
$ |
309,337 |
|
$ |
9,676 |
|
$ |
0 |
|
$ |
791,447 |
|
|
|
|
|
|
|
|
|
|
|
|
|
|
|
|
|
|
|
|
|
|
|
|
|
|
|
|
|
|
|
|
|
|
|
|
|
|
|
|
|
|
|
|
|
|
|
|
|
|
|
|
|
|
|
Depreciation and amortization |
|
$ |
(39,425 |
) |
$ |
(13,706 |
) |
$ |
(1,731 |
) |
$ |
(272 |
) |
$ |
(55,134 |
) |
|
|
|
|
|
|
|
|
|
|
|
|
|
|
|
|
|
|
|
|
|
|
|
|
|
|
|
|
|
|
|
|
|
|
|
|
|
|
|
|
|
|
|
|
|
|
|
|
|
|
|
|
|
|
Operating income (loss) |
|
$ |
46,888 |
|
$ |
51,503 |
|
$ |
(6,829 |
) |
$ |
(24,838 |
) |
$ |
66,724 |
|
|
|
|
|
|
|
|
|
|
|
|
|
|
|
|
|
|
|
|
|
|
|
|
|
|
|
|
|
|
|
|
|
|
|
|
|
|
|
|
|
|
|
|
|
|
|
|
|
|
|
|
|
|
|
Net interest expense |
|
|
|
|
|
|
|
|
|
|
|
|
|
|
(46,329 |
) |
Other income (expense), net |
|
|
|
|
|
|
|
|
|
|
|
|
|
|
(348 |
) |
Income tax provision |
|
|
|
|
|
|
|
|
|
|
|
|
|
|
(3,574 |
) |
|
|
|
|
|
|
|
|
|
|
|
|
|
|
|
|
|
|
Income from continuing operations |
|
|
|
|
|
|
|
|
|
|
|
|
|
|
16,473 |
|
Loss from discontinued operations, net of income taxes |
|
|
|
|
|
|
|
|
|
|
|
|
|
|
(415 |
) |
|
|
|
|
|
|
|
|
|
|
|
|
|
|
|
|
|
|
Net income |
|
|
|
|
|
|
|
|
|
|
|
|
|
$ |
16,058 |
|
|
|
|
|
|
|
|
|
|
|
|
|
|
|
|
|
|
|
|
|
|
|
|
|
|
|
|
|
|
|
|
|
|
|
|
|
|
|
|
|
|
|
|
|
|
|
|
|
|
|
|
|
|
|
Capital expenditures |
|
$ |
25,307 |
|
$ |
5,721 |
|
$ |
473 |
|
$ |
4,298 |
|
$ |
35,799 |
|
|
|
|
|
|
|
|
|
|
|
|
|
|
|
|
|
|
|
|
|
|
|
|
|
|
|
|
|
|
|
|
|
|
|
|
|
|
|
|
|
|
|
|
|
|
|
|
|
|
|
|
|
|
|
Segment assets |
|
$ |
411,968 |
|
$ |
325,140 |
|
$ |
22,674 |
|
$ |
136,524 |
|
$ |
896,306 |
|
|
|
|
|
|
|
|
|
|
|
|
|
|
|
|
|
|
|
|
|
|
|
|
|
|
|
|
|
|
|
|
|
|
|
|
|
|
|
|
|
|
|
|
|
|
|
|
|
|
|
|
|
|
|
|
|
|
|
|
|
|
|
|
|
|
|
|
|
|
|
|
|
|
2015 |
|
(in thousands)
|
|
Building
products |
|
Construction
materials |
|
Energy
technology |
|
Corporate |
|
Totals |
|
Segment revenue |
|
$ |
523,643 |
|
$ |
352,263 |
|
$ |
19,427 |
|
$ |
0 |
|
$ |
895,333 |
|
|
|
|
|
|
|
|
|
|
|
|
|
|
|
|
|
|
|
|
|
|
|
|
|
|
|
|
|
|
|
|
|
|
|
|
|
|
|
|
|
|
|
|
|
|
|
|
|
|
|
|
|
|
|
Depreciation and amortization |
|
$ |
(36,933 |
) |
$ |
(15,155 |
) |
$ |
(1,372 |
) |
$ |
(513 |
) |
$ |
(53,973 |
) |
|
|
|
|
|
|
|
|
|
|
|
|
|
|
|
|
|
|
|
|
|
|
|
|
|
|
|
|
|
|
|
|
|
|
|
|
|
|
|
|
|
|
|
|
|
|
|
|
|
|
|
|
|
|
Operating income (loss) |
|
$ |
64,418 |
|
$ |
64,984 |
|
$ |
731 |
|
$ |
(28,026 |
) |
$ |
102,107 |
|
|
|
|
|
|
|
|
|
|
|
|
|
|
|
|
|
|
|
|
|
|
|
|
|
|
|
|
|
|
|
|
|
|
|
|
|
|
|
|
|
|
|
|
|
|
|
|
|
|
|
|
|
|
|
Net interest expense |
|
|
|
|
|
|
|
|
|
|
|
|
|
|
(64,219 |
) |
Other income (expense), net |
|
|
|
|
|
|
|
|
|
|
|
|
|
|
(218 |
) |
Income tax benefit |
|
|
|
|
|
|
|
|
|
|
|
|
|
|
94,458 |
|
|
|
|
|
|
|
|
|
|
|
|
|
|
|
|
|
|
|
Income from continuing operations |
|
|
|
|
|
|
|
|
|
|
|
|
|
|
132,128 |
|
Loss from discontinued operations, net of income taxes |
|
|
|
|
|
|
|
|
|
|
|
|
|
|
(460 |
) |
|
|
|
|
|
|
|
|
|
|
|
|
|
|
|
|
|
|
Net income |
|
|
|
|
|
|
|
|
|
|
|
|
|
$ |
131,668 |
|
|
|
|
|
|
|
|
|
|
|
|
|
|
|
|
|
|
|
|
|
|
|
|
|
|
|
|
|
|
|
|
|
|
|
|
|
|
|
|
|
|
|
|
|
|
|
|
|
|
|
|
|
|
|
Capital expenditures |
|
$ |
25,454 |
|
$ |
5,855 |
|
$ |
325 |
|
$ |
5,225 |
|
$ |
36,859 |
|
|
|
|
|
|
|
|
|
|
|
|
|
|
|
|
|
|
|
|
|
|
|
|
|
|
|
|
|
|
|
|
|
|
|
|
|
|
|
|
|
|
|
|
|
|
|
|
|
|
|
|
|
|
|
Segment assets |
|
$ |
412,867 |
|
$ |
294,057 |
|
$ |
45,671 |
|
$ |
226,424 |
|
$ |
979,019 |
|
|
|
|
|
|
|
|
|
|
|
|
|
|
|
|
|
|
|
|
|
|
|
|
|
|
|
|
|
|
|
|
|
|
|
|
|
|
|
|
|
|
|
|
|
|
|
|
|
|
|
|
|
|
|
4. Acquisitions
Kleer Lumber—On December 31, 2012, a subsidiary of Headwaters acquired certain assets and assumed certain liabilities of Kleer
Lumber, Inc., a privately-held Massachusetts-based company in the building products industry. Kleer Lumber's results of operations have been included with Headwaters' consolidated results
beginning January 1, 2013.
F-13
Table of Contents
HEADWATERS INCORPORATED
NOTES TO CONSOLIDATED FINANCIAL STATEMENTS (Continued)
September 30, 2015
4. Acquisitions (Continued)
Kleer
Lumber is a manufacturer of high quality cellular PVC products, primarily trim board, but also millwork, sheet stock, paneling, and moulding. Headwaters believes the demand for
cellular PVC building products is growing due to the ability to cut, mill, shape, and install in the same manner as wood products, but with the added benefit of cellular PVC requiring significantly
less maintenance than wood. Kleer Lumber distributes its products to independent lumber yards located primarily in the Northeast and Mid-Atlantic states.
Total
consideration paid for Kleer Lumber was approximately $43.3 million, all of which was cash. Direct acquisition costs, consisting primarily of fees for advisory, legal and
other professional services, totaled approximately $0.9 million and were included in selling, general and administrative expense in the statement of income for 2013.
The
Kleer Lumber acquisition was accounted for as a business combination in accordance with the requirements of ASC 805 Business Combinations. The following table sets forth the
estimated fair values of assets acquired and liabilities assumed as of the acquisition date:
|
|
|
|
|
|
|
(in thousands) |
|
Current assets |
|
$ |
5,818 |
|
Current liabilities |
|
|
(3,093 |
) |
Property, plant and equipment |
|
|
4,098 |
|
Intangible assets: |
|
|
|
|
Customer relationships (15 year life) |
|
|
11,100 |
|
Trade name (indefinite life) |
|
|
4,800 |
|
Goodwill |
|
|
20,527 |
|
|
|
|
|
|
|
Net assets acquired |
|
$ |
43,250 |
|
|
|
|
|
|
|
|
|
|
|
|
|
|
|
|
|
|
|
Kleer
Lumber's future growth attributable to new customers, geographic presence and assembled workforce are additional assets that are not separable and which contributed to recorded
goodwill, all of which is tax deductible over 15 years.
Entegra—On December 12, 2013, Headwaters acquired 80% of the equity interests of Roof Tile Acquisition, LLC, a privately-held
Florida-based company in the building products industry, which sells its products primarily under the Entegra brand. Entegra's results of operations have been included with Headwaters' consolidated
results beginning December 13, 2013.
Entegra
is a leading manufacturer of concrete roof tiles and accessories which are sold primarily in Florida. The acquisition of Entegra provides additional product offerings to
Headwaters' current roofing products portfolio. Headwaters believes the strategic location of Entegra's centralized manufacturing plant in Florida, the quality of its contractor/customer
relationships, and the scope of its products and services provide a competitive advantage. Many of its customers are currently customers of Headwaters, and provide Headwaters the opportunity to expand
existing sales and distribution within Florida, which is one of the fastest growing states in the U.S. in terms of population.
Total
consideration paid for Entegra was approximately $57.5 million, all of which was cash. Direct acquisition costs, consisting primarily of fees for legal services, totaled
approximately $0.4 million and were included in selling, general and administrative expense in the statement of income for fiscal 2014.
F-14
Table of Contents
HEADWATERS INCORPORATED
NOTES TO CONSOLIDATED FINANCIAL STATEMENTS (Continued)
September 30, 2015
4. Acquisitions (Continued)
Headwaters
has the right, but not the obligation, to acquire the non-controlling 20% equity interest in Entegra for a stipulated multiple of EBITDA adjusted for certain prescribed items. This call
right is exercisable at any time after five years following the date of acquisition, unless certain defined events occur prior to that time, in which case the right is exercisable earlier. The
non-controlling owners have the right, but not the obligation, to require Headwaters to acquire the non-controlling 20% equity interest, again for a stipulated multiple of EBITDA adjusted for certain
prescribed items. This put right became exercisable in June 2015.
The
Entegra acquisition has been accounted for as a business combination in accordance with the requirements of ASC 805 Business Combinations. The following table sets forth the
estimated fair values of assets acquired and liabilities assumed as of the acquisition date:
|
|
|
|
|
|
|
(in thousands) |
|
Current assets |
|
$ |
8,261 |
|
Current liabilities |
|
|
(3,422 |
) |
Property, plant and equipment |
|
|
10,589 |
|
Intangible assets: |
|
|
|
|
Customer relationships (15 year life) |
|
|
20,600 |
|
Trade name (indefinite life) |
|
|
6,600 |
|
Goodwill |
|
|
28,156 |
|
|
|
|
|
|
|
Net assets acquired |
|
|
70,784 |
|
Less redeemable non-controlling interest |
|
|
(13,252 |
) |
|
|
|
|
|
|
Net assets attributable to Headwaters |
|
$ |
57,532 |
|
|
|
|
|
|
|
|
|
|
|
|
|
|
|
|
|
|
|
Entegra's
future growth attributable to new customers, geographic presence and assembled workforce are additional assets that are not separable and which contributed to recorded
goodwill, most of which is tax deductible over 15 years.
Gerard—On May 16, 2014, Headwaters acquired certain assets and assumed certain liabilities of the roofing products business of Metals USA
Building Products, L.P., which products are sold under the Gerard and Allmet brands. Gerard's results of operations are being reported within the building products segment and have been
included with Headwaters' consolidated results beginning May 16, 2014.
Gerard
is one of the largest manufacturers of stone coated metal roofing materials in the U.S. and sells niche roofing products that combine profiles resembling tile, shake, or slate
with a fire proof material and a low lifetime installed cost. The acquisition of Gerard increases the number of specialty niche roofing products that Headwaters provides to its core customers and is
an area of focus for Headwaters. With the addition of Gerard, Headwaters now has three product categories in niche roofing, including resin-based composite, concrete, and metal, which could increase
opportunities for cross selling. Besides broadening the niche roofing product lines, Gerard also expands Headwaters geographic footprint in the roofing category.
Total
consideration paid for Gerard was approximately $27.6 million, all of which was cash. Direct acquisition costs, consisting primarily of fees for legal services, totaled
approximately $0.3 million and were included in selling, general and administrative expense in the statement of income for fiscal 2014.
F-15
Table of Contents
HEADWATERS INCORPORATED
NOTES TO CONSOLIDATED FINANCIAL STATEMENTS (Continued)
September 30, 2015
4. Acquisitions (Continued)
The Gerard acquisition has been accounted for as a business combination in accordance with the requirements of ASC 805 Business Combinations. The following table sets forth the estimated
fair values of assets acquired and liabilities assumed as of the acquisition date:
|
|
|
|
|
|
|
(in thousands) |
|
Current assets |
|
$ |
9,236 |
|
Current liabilities |
|
|
(1,691 |
) |
Property, plant and equipment |
|
|
8,314 |
|
Intangible assets: |
|
|
|
|
Customer relationships (15 year life) |
|
|
4,000 |
|
Trade name (indefinite life) |
|
|
3,900 |
|
Goodwill |
|
|
7,719 |
|
Long-term liabilities |
|
|
(3,906 |
) |
|
|
|
|
|
|
Net assets acquired |
|
$ |
27,572 |
|
|
|
|
|
|
|
|
|
|
|
|
|
|
|
|
|
|
|
Gerard's
future growth attributable to new customers, geographic presence and assembled workforce are additional assets that are not separable and which contributed to recorded goodwill,
most of which is tax deductible over 15 years.
Other—During the March 2014 quarter, Headwaters acquired the assets of a company in the construction materials industry
located in the Northeast U.S. for initial cash consideration of approximately $3.1 million. This acquisition increased Headwaters' supply of fly ash and bottom ash, improving its competitive
position in that region. During the September 2014 quarter, Headwaters acquired the assets of another company in the construction materials industry located in the Southeast U.S. for cash
consideration of approximately $7.4 million. This acquisition increased Headwaters' supply of CCPs produced by industrial boilers and has strengthened the ability to meet customers' needs along
the Gulf Coast. During the September 2015 quarter, Headwaters acquired the assets of a company in the building products industry located in Texas for initial cash consideration of approximately
$4.5 million. This acquisition strengthens Headwaters' ability to market its block products in the central Texas region.
Investments
in entities in which Headwaters has a significant influence over operating and financial decisions are accounted for using the equity method of accounting. Headwaters
acquired 100% of one such equity method investee in the December 2014 quarter for a cash payment of approximately $1.2 million. As a result of Headwaters obtaining a controlling financial
interest, the investee has been consolidated within the building products segment.
In
November 2015, Headwaters acquired 100% of the equity interests in several related companies, together which comprise a business in the building products industry located in
California known as Metro Roof Products. Consideration paid, net of cash acquired, was approximately $34.6 million, which amount is subject to adjustment for the final calculation of
acquisition-date working capital. Direct acquisition costs were not material. Metro is a manufacturer of stone coated metal roofing materials in the U.S. and this acquisition is expected to expand
Headwaters' presence in the roofing products sector.
F-16
Table of Contents
HEADWATERS INCORPORATED
NOTES TO CONSOLIDATED FINANCIAL STATEMENTS (Continued)
September 30, 2015
4. Acquisitions (Continued)
Headwaters'
goodwill from all acquisitions plus all indefinite-lived trade names are tested for impairment annually. In addition, all acquired goodwill and intangible assets are subject
to review for impairment if indicators of potential impairment develop in the future.
Combined Financial Information—The actual revenue included in Headwaters' statements of income for 2013, 2014 and 2015
from the acquisitions that occurred in each fiscal year was approximately $28.6 million, $47.6 million and $3.2 million, respectively, and the actual earnings (loss) (including
non-controlling interest) included in Headwaters' statements of income for 2013, 2014 and 2015 was approximately $1.6 million, $5.2 million and $(1.2) million, respectively. The
following unaudited information presents the pro forma consolidated revenue and net income for Headwaters for the years indicated as if the 2013 Kleer Lumber acquisition had been included in
Headwaters' consolidated results of operations prior to October 1, 2012, the 2014 acquisitions had been included in Headwaters' consolidated results of operations beginning October 1,
2012, and the 2015 acquisitions had been included in Headwaters' consolidated results of operations beginning October 1, 2013.
|
|
|
|
|
|
|
|
|
|
|
Unaudited (in thousands)
|
|
2013 |
|
2014 |
|
2015 |
|
Revenue |
|
$ |
784,395 |
|
$ |
835,864 |
|
$ |
902,537 |
|
Net income |
|
$ |
12,387 |
|
$ |
20,409 |
|
$ |
132,084 |
|
The
above unaudited pro forma results have been calculated by combining the historical results of Headwaters and the acquired businesses as if all acquisitions had occurred as of
October 1 of the fiscal year prior to the respective acquisition dates, and then adjusting the income tax provisions as if they had been calculated on the resulting, combined results. The pro
forma results include estimates for intangible asset amortization for the 2015 acquisitions which are subject to change when the final asset values have been determined.
The
pro forma results reflect elimination of the following 2013 expenses (since for purposes of the pro forma presentation they would be reflected in 2012 instead of in 2013):
$0.9 million of direct acquisition costs, $0.5 million of nonrecurring expense related to the fair value adjustment to acquisition-date inventory, and $0.3 million of other costs.
The pro forma results reflect the following 2014 expenses in 2013 instead of in 2014: $0.7 million of direct acquisition costs and $1.2 million of nonrecurring expense related to the
fair value adjustments to acquisition-date inventories. There were no material 2015 expenses reflected in 2014 instead of in 2015. For all periods presented, historical depreciation and amortization
expense of the acquired companies was adjusted to reflect the acquisition date fair value amounts of the related assets. No other material pro forma adjustments were deemed necessary, either to
conform the acquisitions to Headwaters' accounting policies or for any other situation. The pro forma information is not necessarily indicative of the results that would have been achieved had the
transactions occurred on the dates indicated or that may be achieved in the future.
Non-controlling Interest in Consolidated Subsidiary—As described above, Headwaters acquired 80% of the equity interests
of Entegra, and the non-controlling owners have the right to require Headwaters to acquire the non-controlling 20% equity interest. This put right is not deemed to be a freestanding financial
instrument and because it is not solely within the control of Headwaters, the non-controlling interest does not qualify as permanent equity and has been reported outside the
F-17
Table of Contents
HEADWATERS INCORPORATED
NOTES TO CONSOLIDATED FINANCIAL STATEMENTS (Continued)
September 30, 2015
4. Acquisitions (Continued)
stockholders'
equity section of the balance sheet as temporary, or mezzanine, equity. The value of the non-controlling interest was affected by the lack of control as well as the estimated fair values
of the put and call rights.
Because
there is no fixed redemption date for the put right, Headwaters compares quarterly the carrying value of the non-controlling interest to its estimated redemption value. The
estimated redemption value is calculated based on the EBITDA formula described previously to determine the price that would be paid if the put right were to have been exercised at the end of the
reporting period. If applicable, the carrying amount is increased, but not decreased, to the estimated redemption value. The following table summarizes the activity of the non-controlling interest
during 2014 and 2015:
|
|
|
|
|
|
|
(in thousands) |
|
Estimated fair value as of acquisition date |
|
$ |
13,252 |
|
Net income attributable to non-controlling interest |
|
|
774 |
|
Dividends paid to non-controlling interest |
|
|
(950 |
) |
Adjustment of estimated redemption value |
|
|
176 |
|
|
|
|
|
|
|
Balance as of September 30, 2014 |
|
|
13,252 |
|
Net income attributable to non-controlling interest |
|
|
869 |
|
Dividends paid to non-controlling interest |
|
|
(1,690 |
) |
|
|
|
|
|
|
Balance as of September 30, 2015 |
|
$ |
12,431 |
|
|
|
|
|
|
|
|
|
|
|
|
|
|
|
|
|
|
|
5. Discontinued Operations
In September 2011, the Board of Directors committed to a plan to sell Headwaters' coal cleaning business, which was part of the energy technology segment. At that time the business met
all of the criteria for classification as held for sale and presentation as a discontinued operation. Following the sale of all remaining coal cleaning facilities in January 2013, there are no
remaining assets held for sale. The results of operations for the coal cleaning business have been presented as discontinued operations for all periods presented and certain summarized information for
the discontinued business is presented in the following table:
|
|
|
|
|
|
|
|
|
|
|
(in thousands)
|
|
2013 |
|
2014 |
|
2015 |
|
Revenue |
|
$ |
4,386 |
|
$ |
0 |
|
$ |
0 |
|
|
|
|
|
|
|
|
|
|
|
|
|
|
|
|
|
|
|
|
|
|
|
|
|
|
|
|
|
|
|
|
|
|
|
|
|
Loss from operations of discontinued operations before income taxes |
|
$ |
(3,752 |
) |
$ |
(3,175 |
) |
$ |
(496 |
) |
Gain (loss) on disposal |
|
|
(55 |
) |
|
2,727 |
|
|
(229 |
) |
Income tax benefit |
|
|
2,659 |
|
|
33 |
|
|
265 |
|
|
|
|
|
|
|
|
|
|
|
|
|
Loss from discontinued operations, net of income taxes |
|
$ |
(1,148 |
) |
$ |
(415 |
) |
$ |
(460 |
) |
|
|
|
|
|
|
|
|
|
|
|
|
|
|
|
|
|
|
|
|
|
|
|
|
|
|
|
|
|
|
|
|
|
|
|
|
In
2013, Headwaters recognized a tax benefit of approximately $2.7 million, due primarily to the reversal of unrecognized income tax benefits related to completion of the 2009 IRS
audit. Headwaters sold all of its coal cleaning facilities in 2012 and 2013, and recognized estimated gains on the sales
F-18
Table of Contents
HEADWATERS INCORPORATED
NOTES TO CONSOLIDATED FINANCIAL STATEMENTS (Continued)
September 30, 2015
5. Discontinued Operations (Continued)
dates.
Subsequent to the dates of sale, adjustments of the previously recognized estimated gains on the sales transactions have been recorded, including the reported amounts reflected in the table
above. Headwaters currently expects that additional adjustments to the recognized gains and losses may be recorded in the future as certain contingencies are resolved. The loss from operations
reflected in the table includes expenses for certain litigation which commenced prior to disposal of the business.
For
all sales transactions, a majority of the consideration was in the form of potential production royalties and deferred purchase price, which amounts are dependent upon future plant
production levels. Potential future production royalties and deferred purchase price on the sales transactions were not considered as being probable in the original gain calculations and have been
accounted for in the periods when such amounts were received. During 2014, Headwaters received approximately $4.7 million in deferred purchase price payments, royalties and the collection of
certain receivables which had been reserved.
In
accordance with the terms of the asset purchase agreement for one of the sales transactions, the buyer of the coal cleaning facilities agreed to assume the lease and reclamation
obligations related to certain of the facilities. Subsequent to the date of sale, the Headwaters subsidiaries which sold the facilities amended the purchase agreement to provide the buyer with
additional time to make payments, as well as fulfill contractual requirements related to the assumed reclamation obligations. One of Headwaters' subsidiaries is performing permit reclamation
responsibilities at one site. As of September 30, 2014 and 2015, approximately $8.0 million and $7.4 million, respectively, was accrued for this reclamation liability. Certain
receivables due from the buyer have also been reserved until such time as collection is more certain.
Headwaters
currently expects to continue to reflect as discontinued operations all activity related to the former coal cleaning business, at least until such time as the significant
reclamation obligation is satisfied.
6. Current Assets and Current Liabilities
Receivables—Activity in the trade receivables allowance account was as follows for the three-year period ended
September 30, 2015:
|
|
|
|
|
|
|
|
|
|
|
|
|
|
(in thousands)
|
|
Balance at
beginning
of year |
|
Charged
to expense |
|
Accounts
written off |
|
Balance at
end of year |
|
2013 |
|
$ |
2,423 |
|
$ |
1,302 |
|
$ |
(948 |
) |
$ |
2,777 |
|
2014 |
|
|
2,777 |
|
|
2,022 |
|
|
(1,261 |
) |
|
3,538 |
|
2015 |
|
|
3,538 |
|
|
1,424 |
|
|
(1,152 |
) |
|
3,810 |
|
In
addition to the allowance for trade receivables, in 2013 Headwaters had additional activity of approximately $9.0 million in the allowance account for other receivables, all
related to amounts owed to Headwaters by one of the buyers of some of the coal cleaning facilities described in Note 5. The $9.0 million represented a 100% reserve on a note receivable
and other payments contractually agreed to by the buyer, given the level of uncertainty of collection from the buyer. In 2014, approximately $2.0 million of the $9.0 million receivable
was collected, which amount was reflected as gain on disposal from discontinued operations.
F-19
Table of Contents
HEADWATERS INCORPORATED
NOTES TO CONSOLIDATED FINANCIAL STATEMENTS (Continued)
September 30, 2015
6. Current Assets and Current Liabilities (Continued)
Inventories—Inventories consisted of the following at September 30:
|
|
|
|
|
|
|
|
(in thousands)
|
|
2014 |
|
2015 |
|
Raw materials |
|
$ |
12,017 |
|
$ |
12,831 |
|
Finished goods |
|
|
38,616 |
|
|
42,243 |
|
|
|
|
|
|
|
|
|
|
|
|
$ |
50,633 |
|
$ |
55,074 |
|
|
|
|
|
|
|
|
|
|
|
|
|
|
|
|
|
|
|
|
|
|
|
|
|
|
|
|
Warranty Liabilities—Activity in the warranty liability account was as follows for the three-year period ended
September 30, 2015:
|
|
|
|
|
|
|
|
|
|
|
|
|
|
|
|
|
|
|
|
(in thousands)
|
|
Balance at
beginning
of year |
|
Charged
to expense |
|
Changes in
prior year
estimates |
|
Additions
from
acquisitions |
|
Payments
for claims |
|
Balance at
end of year |
|
2013 |
|
$ |
1,834 |
|
$ |
1,629 |
|
$ |
0 |
|
$ |
40 |
|
$ |
(1,362 |
) |
$ |
2,141 |
|
2014 |
|
|
2,141 |
|
|
1,992 |
|
|
32 |
|
|
4,842 |
|
|
(1,788 |
) |
|
7,219 |
|
2015 |
|
|
7,219 |
|
|
2,020 |
|
|
(461 |
) |
|
0 |
|
|
(2,010 |
) |
|
6,768 |
|
Other Accrued Liabilities—Other accrued liabilities consisted of the following at September 30:
|
|
|
|
|
|
|
|
(in thousands)
|
|
2014 |
|
2015 |
|
Products and services received but not yet invoiced |
|
$ |
19,870 |
|
$ |
24,215 |
|
Other |
|
|
21,887 |
|
|
25,271 |
|
|
|
|
|
|
|
|
|
|
|
|
$ |
41,757 |
|
$ |
49,486 |
|
|
|
|
|
|
|
|
|
|
|
|
|
|
|
|
|
|
|
|
|
|
|
|
|
|
|
|
7. Long-Lived Assets
Property, Plant and Equipment—Property, plant and equipment consisted of the following at September 30:
|
|
|
|
|
|
|
|
|
|
(in thousands of dollars)
|
|
Estimated
useful lives |
|
2014 |
|
2015 |
|
Land and improvements |
|
15 - 40 years |
|
$ |
15,298 |
|
$ |
15,904 |
|
Buildings and improvements |
|
5 - 40 years |
|
|
69,018 |
|
|
69,645 |
|
Equipment and vehicles |
|
3 - 20 years |
|
|
221,987 |
|
|
239,759 |
|
Dies and molds |
|
3 - 20 years |
|
|
83,299 |
|
|
85,880 |
|
Construction in progress |
|
— |
|
|
16,402 |
|
|
18,271 |
|
|
|
|
|
|
|
|
|
|
|
|
|
|
|
|
|
406,004 |
|
|
429,459 |
|
Less accumulated depreciation |
|
|
|
|
(224,706 |
) |
|
(243,741 |
) |
|
|
|
|
|
|
|
|
|
|
|
Net property, plant and equipment |
|
|
|
$ |
181,298 |
|
$ |
185,718 |
|
|
|
|
|
|
|
|
|
|
|
|
|
|
|
|
|
|
|
|
|
|
|
|
|
|
|
|
|
|
|
|
|
|
Depreciation
expense was approximately $32.1 million, $33.8 million and $35.8 million in 2013, 2014 and 2015, respectively.
F-20
Table of Contents
HEADWATERS INCORPORATED
NOTES TO CONSOLIDATED FINANCIAL STATEMENTS (Continued)
September 30, 2015
7. Long-Lived Assets (Continued)
Intangible Assets—Headwaters' identified intangible assets are being amortized over the estimated useful lives shown in
the table below. The table also summarizes the gross carrying amounts and related accumulated amortization of intangible assets as of September 30:
|
|
|
|
|
|
|
|
|
|
|
|
|
|
|
|
|
|
|
|
2014 |
|
2015 |
|
(in thousands of dollars)
|
|
Estimated
useful lives |
|
Gross
Carrying
Amount |
|
Accumulated
Amortization |
|
Gross
Carrying
Amount |
|
Accumulated
Amortization |
|
Trade names |
|
Indefinite |
|
$ |
15,300 |
|
$ |
— |
|
$ |
15,300 |
|
$ |
— |
|
CCP contracts |
|
15 - 20 years |
|
|
112,300 |
|
|
64,192 |
|
|
112,300 |
|
|
69,875 |
|
Customer relationships |
|
5 - 17 years |
|
|
107,953 |
|
|
50,355 |
|
|
109,078 |
|
|
57,844 |
|
Trade names |
|
5 - 20 years |
|
|
67,220 |
|
|
33,394 |
|
|
66,960 |
|
|
36,554 |
|
Patents and patented technologies |
|
5 - 19 years |
|
|
14,526 |
|
|
11,686 |
|
|
14,526 |
|
|
12,574 |
|
Other |
|
5 - 17 years |
|
|
3,935 |
|
|
1,744 |
|
|
4,585 |
|
|
2,184 |
|
|
|
|
|
|
|
|
|
|
|
|
|
|
|
|
|
|
|
|
|
|
$ |
321,234 |
|
$ |
161,371 |
|
$ |
322,749 |
|
$ |
179,031 |
|
|
|
|
|
|
|
|
|
|
|
|
|
|
|
|
|
|
|
|
|
|
|
|
|
|
|
|
|
|
|
|
|
|
|
|
|
|
|
|
|
|
|
|
|
|
|
|
|
|
|
|
The
above table includes provisional amounts for the intangible assets acquired in 2015 because the process of identifying and valuing those assets has not been completed. Total
amortization expense related to intangible assets was approximately $20.2 million, $21.3 million and $18.2 million in 2013, 2014 and 2015, respectively. The primary reason for the
decrease in amortization expense from 2014 to 2015 is that certain assets have been fully amortized. Total estimated annual amortization expense for 2016 through 2020 is shown in the following table:
|
|
|
|
|
Year ending September 30:
|
|
(in thousands) |
|
2016 |
|
$ |
17,974 |
|
2017 |
|
|
17,096 |
|
2018 |
|
|
17,046 |
|
2019 |
|
|
16,018 |
|
2020 |
|
|
11,771 |
|
Goodwill—Changes in the carrying amount of goodwill, by segment, are as follows for the two-year period ended
September 30, 2015:
|
|
|
|
|
|
|
|
|
|
|
(in thousands)
|
|
Building
products |
|
Construction
materials |
|
Total |
|
Balances as of September 30, 2013 |
|
$ |
21,199 |
|
$ |
115,999 |
|
$ |
137,198 |
|
Goodwill related to 2014 acquisitions |
|
|
35,488 |
|
|
2,900 |
|
|
38,388 |
|
|
|
|
|
|
|
|
|
|
|
|
|
Balances as of September 30, 2014 |
|
|
56,687 |
|
|
118,899 |
|
|
175,586 |
|
Goodwill related to 2015 acquisitions |
|
|
2,687 |
|
|
0 |
|
|
2,687 |
|
Adjustments to previously recorded amounts for 2014 acquisitions |
|
|
390 |
|
|
(464 |
) |
|
(74 |
) |
|
|
|
|
|
|
|
|
|
|
|
|
Balances as of September 30, 2015 |
|
$ |
59,764 |
|
$ |
118,435 |
|
$ |
178,199 |
|
|
|
|
|
|
|
|
|
|
|
|
|
|
|
|
|
|
|
|
|
|
|
|
|
|
|
|
|
|
|
|
|
|
|
|
|
F-21
Table of Contents
HEADWATERS INCORPORATED
NOTES TO CONSOLIDATED FINANCIAL STATEMENTS (Continued)
September 30, 2015
7. Long-Lived Assets (Continued)
Impairment Testing—In accordance with the requirements of ASC Topic 350 Intangibles—Goodwill and Other,
Headwaters does not amortize goodwill or indefinite-lived intangible assets, all of which relate to acquisitions. However, Headwaters is required to periodically test these assets for impairment at
least annually, or sooner if indicators of possible
impairment arise. Headwaters performs its annual impairment testing during the fourth quarter of its fiscal year using a June 30 test date and a one- to three-step process. Headwaters'
reporting units for purposes of impairment testing are the same as its operating segments.
Headwaters
evaluates qualitative factors, including macroeconomic conditions, industry and market considerations, overall financial performance and cost factors, to determine whether it
is necessary to perform step 1 of the two-step impairment test. This qualitative evaluation is commonly referred to as "step 0." After assessing the appropriate qualitative factors, only if it is
determined that it is more likely than not that the fair value of a reporting unit is less than its carrying amount, is it necessary to perform step 1.
Step
1 of impairment testing consists of determining and comparing the fair value of a reporting unit, calculated primarily using discounted expected future cash flows, to the carrying
value of the reporting unit. If step 1 is failed for a reporting unit, indicating a potential impairment, Headwaters is required to complete step 2, which is a more detailed test to calculate the
implied fair value of goodwill and indefinite-lived intangible assets, and compare that value to the carrying value. If the carrying value of goodwill and indefinite-lived assets exceeds the implied
fair value, an impairment loss is required to be recorded.
For
all years presented, Headwaters performed a step 0 qualitative evaluation for both the construction materials and building products reporting units and concluded that it was more
likely than not that the fair values exceeded the carrying amounts of goodwill and indefinite-lived assets. Accordingly, further step 1 and step 2 testing for impairment was not required to be
performed.
8. Long-Term Debt
The total undiscounted face amount of Headwaters' outstanding long-term debt was approximately
$599.8 million as of September 30, 2014 and $573.9 million as of September 30, 2015. As of those dates, the discounted carrying value of long-term debt consisted of the
following:
|
|
|
|
|
|
|
|
(in thousands)
|
|
2014 |
|
2015 |
|
Senior secured term loan, due March 2022 (face amount $423,938) |
|
$ |
0 |
|
$ |
414,490 |
|
71/4% Senior notes, due January 2019 (face amount $150,000) |
|
|
147,192 |
|
|
147,840 |
|
7-5/8% Senior secured notes, repaid in March 2015 (face amount $400,000) |
|
|
396,058 |
|
|
0 |
|
8.75% Convertible senior subordinated notes, repaid in February 2015 (face amount $49,791) |
|
|
49,208 |
|
|
0 |
|
|
|
|
|
|
|
|
|
|
Carrying amount of long-term debt, net of discounts and debt issue costs |
|
|
592,458 |
|
|
562,330 |
|
Less current portion |
|
|
0 |
|
|
(4,250 |
) |
|
|
|
|
|
|
|
|
|
Long-term debt |
|
$ |
592,458 |
|
$ |
558,080 |
|
|
|
|
|
|
|
|
|
|
|
|
|
|
|
|
|
|
|
|
|
|
|
|
|
|
|
|
F-22
Table of Contents
HEADWATERS INCORPORATED
NOTES TO CONSOLIDATED FINANCIAL STATEMENTS (Continued)
September 30, 2015
8. Long-Term Debt (Continued)
Senior Secured Term Loan—In March 2015, Headwaters entered into a new Term Loan Facility, under which a senior secured
loan for $425.0 million was obtained. The loan will mature in March 2022, subject to certain exceptions described below. The Term Loan Facility requires scheduled quarterly repayments in an
aggregate annual amount equal to 1.0% of the original principal amount (subject to reduction for certain permitted prepayments), with the balance due at maturity. In the event that in October 2018
Headwaters has more than $50.0 million outstanding of the 71/4% senior notes and has not received a binding commitment to refinance those notes, the maturity date of the Term
Loan Facility will be October 2018.
The
Term Loan Facility allows Headwaters to request one or more incremental term loans and certain other types of incremental debt in an aggregate amount not to exceed
$150.0 million plus an additional amount which is dependent on Headwaters' pro forma net leverage ratio, as defined. Any additional borrowings are contingent upon the receipt of commitments by
existing or additional lenders.
Borrowings
under the Term Loan Facility bear interest at a rate equal to, at Headwaters' option, either (a) a base rate determined by reference to the highest of (i) the
publicly announced prime rate of the administrative agent, (ii) the federal funds rate plus 0.50%, and (iii) the eurocurrency (LIBO) rate for a one-month interest period plus 1.0%,
subject in all cases to a 2.0% floor; or (b) a eurocurrency (LIBO) rate determined by reference to the cost of funds for eurocurrency deposits in dollars, subject to a 1.0% floor; plus, in each
case, an applicable margin of 3.5% for any eurocurrency loan and 2.5% for any alternate base rate loan. Interest is payable quarterly, and as of September 30, 2015, the interest rate on
borrowings under the Term Loan Facility was 4.5%.
Headwaters
may voluntarily repay outstanding loans under the Term Loan Facility at any time without premium or penalty, other than customary breakage costs with respect to LIBO rate
loans, which shall be subject to a prepayment premium of 1.0%. The Term Loan Facility requires Headwaters to prepay outstanding term loans, subject to certain exceptions, with (i) up to 50% of
Headwaters' annual excess cash flow, as defined, to the extent such excess cash flow exceeds $1.0 million, commencing with fiscal year 2016, with such required prepayment to be reduced by the
amount of voluntary prepayments of term loans and certain other types of senior secured debt; (ii) 100% of the net cash proceeds of certain non-ordinary course asset sales; and
(iii) 100% of the net cash proceeds of certain issuances of debt.
The
Term Loan Facility is secured by substantially all assets of Headwaters, except that the obligations have a second priority position with respect to the assets that secure
Headwaters' ABL Revolver, primarily consisting of certain trade receivables and inventories of Headwaters' building products and construction materials segments. The Term Loan Facility contains
customary covenants restricting the ability of Headwaters to incur additional debt and liens on assets, prepay future new subordinated debt, merge or consolidate with another company, sell all or
substantially all assets, make investments and pay dividends or distributions, among other things. The Term Loan Facility contains customary events of default, including with respect to a change in
control of Headwaters. Headwaters was in compliance with all covenants as of September 30, 2015.
The
net proceeds from the initial borrowing under the Term Loan Facility were approximately $414.7 million, after giving effect to original issue discount of approximately
$2.1 million and transaction costs of approximately $8.2 million. As described below, the net proceeds from the original
F-23
Table of Contents
HEADWATERS INCORPORATED
NOTES TO CONSOLIDATED FINANCIAL STATEMENTS (Continued)
September 30, 2015
8. Long-Term Debt (Continued)
borrowing
under the Term Loan Facility were primarily used to pay the redemption price for all of the outstanding 7-5/8% senior secured notes.
71/4% Senior Notes—In December 2013, Headwaters issued $150.0 million of 71/4%
senior notes for net proceeds of approximately $146.7 million. The 71/4% notes are unsecured, mature in January 2019 and bear interest at a rate of 7.25%, payable semiannually.
The notes are subordinate in priority to the senior secured Term Loan Facility described above and the ABL Revolver described below, to the extent of the value of the assets securing such debt, and
are senior to all other future subordinated debt.
Headwaters
can redeem the 71/4% notes, in whole or in part, at any time after January 15, 2016 at redemption prices that decline over time from 103.625% to 100.0%,
depending on the redemption date. In addition, until January 15, 2016, Headwaters can redeem at a price of 107.25% up to 35% of the outstanding notes with the net proceeds from one or more
equity offerings. Headwaters can also redeem any of the notes at any time prior to January 15, 2016 at a price equal to 100% of the principal amount plus a make-whole premium. If there is a
change in control, Headwaters will be required to offer to purchase the notes from holders at a purchase price equal to 101% of the principal amount.
The
71/4% notes limit Headwaters in the incurrence of additional debt and liens on assets, prepayment of subordinated debt, merging or consolidating with another company,
selling all or substantially all assets, making investments and the payment of dividends or distributions, among other things. Headwaters was in compliance with all covenants as of
September 30, 2015.
ABL Revolver—Since entering into the ABL Revolver, Headwaters has not borrowed any funds under the arrangement and has no
borrowings outstanding as of September 30, 2015. Availability under the ABL Revolver cannot exceed $70.0 million, which includes a $35.0 million sub-line for letters of credit and
a $10.5 million swingline facility. Availability under the ABL Revolver is further limited by the borrowing base valuations of the assets of Headwaters' building products and construction
materials segments which secure the borrowings, currently consisting of certain trade receivables and inventories. In addition to the first lien position on these assets, the ABL Revolver lenders have
a second priority position on substantially all other assets of Headwaters.
As
of September 30, 2015, Headwaters had secured letters of credit under the ABL Revolver of approximately $7.6 million for various purposes and had availability under the
ABL Revolver of approximately $60.4 million. The ABL Revolver terminates in March 2020. There is a contingent
provision for early termination at any time within three months prior to the earliest maturity date of the senior secured Term Loan Facility or the 71/4% senior notes, at which time any
amounts borrowed must be repaid.
Outstanding
borrowings under the ABL Revolver accrue interest at Headwaters' option, at either i) the London Interbank Offered Rate (LIBOR) plus 1.5%, 1.75% or 2.0%, depending on
Headwaters' average net excess availability under the ABL; or ii) the "Base Rate" plus 0.25%, 0.5% or 0.75%, again depending on average net excess availability. The base rate is subject to a
floor equal to the highest of i) the prime rate, ii) the federal funds rate plus 0.5%, and iii) the 30-day LIBO rate plus 1.0%. Fees on the unused portion of the ABL Revolver
range from 0.25% to 0.375%, depending on the amount of the credit facility which is utilized. If there would have been borrowings outstanding under the ABL
F-24
Table of Contents
HEADWATERS INCORPORATED
NOTES TO CONSOLIDATED FINANCIAL STATEMENTS (Continued)
September 30, 2015
8. Long-Term Debt (Continued)
Revolver
as of September 30, 2015, the interest rate on those borrowings would have been approximately 1.8%.
The
ABL Revolver contains restrictions and covenants common to such agreements, including limitations on the incurrence of additional debt and liens on assets, prepayment of subordinated
debt, merging or consolidating with another company, selling assets, making acquisitions and investments and the payment of dividends or distributions, among other things. In addition, if availability
under the ABL Revolver is less than 12.5%, Headwaters is required to maintain a monthly fixed charge coverage ratio of at least 1.0x for the preceding twelve-month period. Headwaters was in compliance
with all covenants as of September 30, 2015.
7-5/8% Senior Secured Notes—In 2011, Headwaters issued $400.0 million of 7-5/8% senior secured notes. In March
2015, Headwaters irrevocably deposited with the trustee of the notes an amount sufficient to pay and discharge all obligations under the notes and the related indenture, which discharge the trustee
acknowledged. This discharge resulted in a loss on extinguishment of debt of approximately $21.3 million, comprised of the early repayment premium of approximately $15.3 million,
interest to the April 2015 redemption date totaling approximately $2.5 million, and accelerated amortization of unamortized debt issue costs of approximately $3.5 million. The loss on
debt extinguishment is reflected as interest expense in Headwaters' statement of income for 2015.
Convertible Senior Subordinated Notes—In 2013, Headwaters repurchased and canceled approximately $47.4 million in
aggregate principal amount of 2.50% convertible senior subordinated
notes for cash consideration of approximately $47.7 million. The premiums and accelerated debt discount and debt issue costs aggregating approximately $2.4 million were charged to
interest expense. The remaining 2.50% notes, aggregating approximately $7.7 million, matured and were fully repaid in February 2014.
Pursuant
to open market transactions in February 2015, Headwaters repurchased and canceled substantially all of the outstanding 8.75% convertible senior subordinated notes, aggregating
approximately $49.0 million. Premiums and accelerated amortization of debt discount and debt issue costs aggregating approximately $3.5 million were paid and charged to interest expense.
Headwaters'
Chairman and CEO was a holder of $1.16 million of the 2.50% notes referred to above that were exchanged for 8.75% notes in 2012, which holding and exchange were
approved by the Board of Directors and occurred under the same terms as for other debt holders. Due to immateriality, the remaining balance of these 8.75% convertible notes, repayable in 2016, has
been included with other accrued liabilities in the consolidated balance sheet as of September 30, 2015.
Interest Costs and Debt Maturities—During 2013, Headwaters incurred total interest costs of approximately
$42.9 million, including approximately $5.8 million of non-cash interest expense. During 2014, Headwaters incurred total interest costs of approximately $46.9 million, including
approximately $2.2 million of non-cash interest expense. During 2015, Headwaters incurred total interest costs of approximately $64.9 million, including approximately $6.2 million
of non-cash interest expense. As described above, approximately $21.3 million of interest expense incurred in 2015 resulted from the early repayment of the 7-5/8% senior secured notes. Neither
capitalized interest nor interest income was material for any period presented.
F-25
Table of Contents
HEADWATERS INCORPORATED
NOTES TO CONSOLIDATED FINANCIAL STATEMENTS (Continued)
September 30, 2015
8. Long-Term Debt (Continued)
The
weighted-average interest rate on the face amount of outstanding long-term debt, excluding amortizable debt discount and debt issue costs, was approximately 7.6% at
September 30, 2014 and 5.2% at September 30, 2015. Except for the required repayments of the Term Loan Facility of approximately $1.1 million per quarter, Headwaters has no debt
maturities until January 2019.
Future
maturities of long-term debt as of September 30, 2015 are shown in the following table:
|
|
|
|
|
Year ending September 30,
|
|
(in thousands) |
|
2016 |
|
$ |
4,250 |
|
2017 |
|
|
4,250 |
|
2018 |
|
|
4,250 |
|
2019 |
|
|
154,250 |
|
2020 |
|
|
4,250 |
|
Thereafter |
|
|
402,688 |
|
|
|
|
|
|
|
Total long-term debt |
|
$ |
573,938 |
|
|
|
|
|
|
|
|
|
|
|
|
|
|
|
|
|
|
|
9. Fair Value of Financial Instruments
Headwaters' material financial instruments consist primarily of cash and cash equivalents, trade receivables, accounts payable and long-term debt. All of these financial instruments
except some long-term debt are either carried at fair value in the consolidated balance sheets or are short-term in nature. Accordingly, the carrying values for those financial instruments as
reflected in the consolidated balance sheets closely approximate their fair values.
All
of Headwaters' outstanding long-term debt as of September 30, 2014 was fixed-rate. Using fair values for the debt, the aggregate fair value of Headwaters' long-term debt as of
September 30, 2014 would have been approximately $626.0 million, compared to a carrying value of $592.5 million. As of September 30, 2015, only the 71/4%
senior notes have a fixed rate and the aggregate fair value of this debt as of September 30, 2015 would have been approximately $156.4 million, compared to a carrying value of
$147.8 million.
Fair
value "Level 2" estimates for long-term debt were based primarily on price estimates from broker-dealers. The fair values for long-term debt differ from the carrying values
primarily due to interest rates that differ from current market interest rates, and for the convertible senior subordinated notes that were outstanding at September 30, 2014, the difference
between Headwaters' common stock price at that date and the conversion price.
10. Income Taxes
Headwaters recorded income tax expense of approximately $3.9 million and $3.6 million in 2013 and 2014, respectively. For both years, Headwaters recorded a full valuation
allowance on its net amortizable deferred tax assets and accordingly, did not recognize benefit for tax credit carryforwards, net operating loss (NOL) carryforwards or other deferred tax assets,
except to the extent of earnings. The reported 32% and 18% effective tax rates for 2013 and 2014 were due primarily to state income taxes in certain state jurisdictions. In 2013, Headwaters also
recognized a tax benefit of approximately
F-26
Table of Contents
HEADWATERS INCORPORATED
NOTES TO CONSOLIDATED FINANCIAL STATEMENTS (Continued)
September 30, 2015
10. Income Taxes (Continued)
$2.7 million
in discontinued operations, due primarily to the reversal of unrecognized income tax benefits related to audit periods that closed.
In
2015, Headwaters recorded an income tax benefit of approximately $94.5 million, primarily due to the release of approximately $109.3 million of the valuation allowance
established in prior years. A valuation allowance is required when there is significant uncertainty as to the realizability of deferred tax assets. Realization of deferred tax assets is dependent upon
Headwaters' ability to generate sufficient taxable income within the carryforward periods provided for in the tax law for each tax jurisdiction. Headwaters considered the following possible sources of
taxable income when assessing the realization of its deferred tax assets:
- •
- future reversals of existing taxable temporary differences;
- •
- future taxable income or loss, exclusive of reversing temporary differences and carryforwards;
- •
- tax-planning strategies; and
- •
- taxable income in prior carryback years.
Headwaters
considered both positive and negative evidence in determining the continued need for a valuation allowance, including the following:
Positive evidence:
- •
- Current forecasts indicate that Headwaters will generate pre-tax income and taxable income in the future.
- •
- Headwaters had a three-year cumulative income as of September 30, 2015.
- •
- A majority of Headwaters' tax attributes have significant carryover periods of 20 years or more.
Negative evidence:
- •
- Headwaters operates in cyclical industries that are difficult to forecast.
Headwaters
placed more weight on objectively verifiable evidence than on other types of evidence and management believes that available positive evidence outweighed the available
negative evidence. Management therefore determined that Headwaters met the "more likely than not" threshold that NOLs, tax credits and other deferred tax assets will be realized. Accordingly, a full
valuation allowance was no longer deemed to be required as of September 30, 2015. A valuation allowance of approximately $10.1 million was maintained against capital loss carryforwards,
certain state NOL carryforwards, and certain tax credit carryforwards as of September 30, 2015.
All
of the factors Headwaters considered in evaluating whether and when to release all or a portion of the deferred tax asset valuation allowance involved significant judgment. For
example, there are many different interpretations of "cumulative income or losses in recent years" which can be used. Also, significant judgment is involved in making projections of future financial
and taxable income, especially because Headwaters' financial results are significantly dependent upon industry trends, including new housing construction, repair and remodeling, and infrastructure
construction. Most of the end use categories in which Headwaters sells its products and services are currently in varying states of
F-27
Table of Contents
HEADWATERS INCORPORATED
NOTES TO CONSOLIDATED FINANCIAL STATEMENTS (Continued)
September 30, 2015
10. Income Taxes (Continued)
recovery
from the historic downturn experienced in recent years; however, it is not possible to accurately predict whether recovery will continue, and if it does, at what rate and for how long.
As
of September 30, 2015, Headwaters' U.S. and state NOL and capital loss carryforwards totaled approximately $67.5 million (tax effected). The NOLs expire from 2016 to
2035. In addition, there are approximately $25.0 million of tax credit carryforwards as of September 30, 2015, which expire from 2028 to 2033.
The
income tax provision consisted of the following for the years ended September 30:
|
|
|
|
|
|
|
|
|
|
|
(in thousands)
|
|
2013 |
|
2014 |
|
2015 |
|
Current tax benefit (provision): |
|
|
|
|
|
|
|
|
|
|
Federal |
|
$ |
(1,292 |
) |
$ |
65 |
|
$ |
8 |
|
State |
|
|
(1,934 |
) |
|
(1,973 |
) |
|
(2,027 |
) |
|
|
|
|
|
|
|
|
|
|
|
|
Total current tax provision |
|
|
(3,226 |
) |
|
(1,908 |
) |
|
(2,019 |
) |
Deferred tax benefit (provision): |
|
|
|
|
|
|
|
|
|
|
Federal |
|
|
(5,473 |
) |
|
(10,956 |
) |
|
(14,100 |
) |
State |
|
|
820 |
|
|
1,296 |
|
|
1,300 |
|
Change in valuation allowance |
|
|
3,955 |
|
|
7,994 |
|
|
109,277 |
|
|
|
|
|
|
|
|
|
|
|
|
|
Total deferred tax benefit (provision) |
|
|
(698 |
) |
|
(1,666 |
) |
|
96,477 |
|
|
|
|
|
|
|
|
|
|
|
|
|
Total income tax benefit (provision) |
|
$ |
(3,924 |
) |
$ |
(3,574 |
) |
$ |
94,458 |
|
|
|
|
|
|
|
|
|
|
|
|
|
|
|
|
|
|
|
|
|
|
|
|
|
|
|
|
|
|
|
|
|
|
|
|
|
The
provision for income taxes differs from the amount computed using the statutory federal income tax rate due to the following:
|
|
|
|
|
|
|
|
|
|
|
(in thousands)
|
|
2013 |
|
2014 |
|
2015 |
|
Tax provision at U.S. statutory rate |
|
$ |
(4,273 |
) |
$ |
(7,016 |
) |
$ |
(13,185 |
) |
State income taxes, net of federal tax effect |
|
|
(1,934 |
) |
|
(1,973 |
) |
|
(931 |
) |
Valuation allowance |
|
|
3,955 |
|
|
7,994 |
|
|
109,277 |
|
Non-deductible executive compensation |
|
|
0 |
|
|
(1,242 |
) |
|
(105 |
) |
Unrecognized tax benefits |
|
|
(1,245 |
) |
|
101 |
|
|
706 |
|
Other |
|
|
(427 |
) |
|
(1,438 |
) |
|
(1,304 |
) |
|
|
|
|
|
|
|
|
|
|
|
|
Income tax benefit (provision) |
|
$ |
(3,924 |
) |
$ |
(3,574 |
) |
$ |
94,458 |
|
|
|
|
|
|
|
|
|
|
|
|
|
|
|
|
|
|
|
|
|
|
|
|
|
|
|
|
|
|
|
|
|
|
|
|
|
F-28
Table of Contents
HEADWATERS INCORPORATED
NOTES TO CONSOLIDATED FINANCIAL STATEMENTS (Continued)
September 30, 2015
10. Income Taxes (Continued)
The components of Headwaters' deferred income tax assets and liabilities were as follows as of September 30:
|
|
|
|
|
|
|
|
(in thousands)
|
|
2014 |
|
2015 |
|
Deferred tax assets: |
|
|
|
|
|
|
|
NOL and capital loss carryforwards |
|
$ |
70,320 |
|
$ |
67,505 |
|
Tax credit carryforwards |
|
|
24,784 |
|
|
24,954 |
|
Estimated liabilities |
|
|
15,925 |
|
|
19,240 |
|
Stock-based compensation |
|
|
6,958 |
|
|
5,903 |
|
Debt repurchase premium |
|
|
12,711 |
|
|
5,154 |
|
Reserves and allowances |
|
|
4,860 |
|
|
2,469 |
|
Deferred revenue |
|
|
5,898 |
|
|
170 |
|
Other |
|
|
1,644 |
|
|
3,006 |
|
Valuation allowances |
|
|
(119,424 |
) |
|
(10,146 |
) |
|
|
|
|
|
|
|
|
|
Total deferred tax assets |
|
|
23,676 |
|
|
118,255 |
|
Deferred tax liabilities: |
|
|
|
|
|
|
|
Property, plant and equipment basis differences |
|
|
(20,483 |
) |
|
(15,797 |
) |
Goodwill and intangible asset basis differences |
|
|
(8,062 |
) |
|
(9,606 |
) |
|
|
|
|
|
|
|
|
|
Total deferred tax liabilities |
|
|
(28,545 |
) |
|
(25,403 |
) |
|
|
|
|
|
|
|
|
|
Net deferred tax asset (liability) |
|
$ |
(4,869 |
) |
$ |
92,852 |
|
|
|
|
|
|
|
|
|
|
|
|
|
|
|
|
|
|
|
|
|
|
|
|
|
|
|
|
A
reconciliation of the change in the amount of gross unrecognized income tax benefits, not including interest and penalties, is as follows:
|
|
|
|
|
|
|
|
|
|
|
(in thousands)
|
|
2013 |
|
2014 |
|
2015 |
|
Gross unrecognized income tax benefits at beginning of year |
|
$ |
4,872 |
|
$ |
4,552 |
|
$ |
4,497 |
|
Changes based on tax positions related to the current year |
|
|
0 |
|
|
0 |
|
|
25 |
|
Increases for tax positions related to prior years |
|
|
1,214 |
|
|
0 |
|
|
1,055 |
|
Reductions for tax positions related to prior years |
|
|
(1,439 |
) |
|
0 |
|
|
0 |
|
Settlements |
|
|
(16 |
) |
|
0 |
|
|
0 |
|
Lapse of statute of limitations |
|
|
(79 |
) |
|
(55 |
) |
|
(575 |
) |
|
|
|
|
|
|
|
|
|
|
|
|
Gross unrecognized income tax benefits at end of year |
|
$ |
4,552 |
|
$ |
4,497 |
|
$ |
5,002 |
|
|
|
|
|
|
|
|
|
|
|
|
|
|
|
|
|
|
|
|
|
|
|
|
|
|
|
|
|
|
|
|
|
|
|
|
|
During
2013, Headwaters accrued approximately $0.3 million of liabilities for interest and penalties. During 2014, Headwaters accrued approximately $0.1 million of
liabilities for interest and penalties. During 2015, Headwaters released approximately $0.2 million of liabilities for interest and penalties and as of September 30, 2015, approximately
$2.5 million was accrued for the payment of interest and penalties. Changes to the estimated liability during 2013 were primarily the result of additional state income tax reserves and the
reversal in discontinued operations of unrecognized income tax benefits related to completion of the 2009 IRS audit. Changes to the estimated liability
F-29
Table of Contents
HEADWATERS INCORPORATED
NOTES TO CONSOLIDATED FINANCIAL STATEMENTS (Continued)
September 30, 2015
10. Income Taxes (Continued)
during
2014 were primarily the result of the expiration of statute of limitation time periods. Changes to the estimated liability during 2015 were primarily the result of the expiration of statute of
limitation time periods. As of September 30, 2015, approximately $3.9 million of unrecognized income tax benefits would affect the 2015 effective tax rate if released into income.
The
calculation of tax liabilities involves uncertainties in the application of complex tax regulations in multiple tax jurisdictions. Headwaters currently has open tax years subject to
examination by the IRS and state tax authorities for the years 2012 through 2014. Headwaters recognizes potential liabilities for anticipated tax audit issues in the U.S. and state tax jurisdictions
based on estimates of whether, and the extent to which, additional taxes and interest will be due. If events occur (or do not occur) as expected and the payment of these amounts ultimately proves to
be unnecessary, the reversal of the liabilities would result in tax benefits being recognized in the period when it is determined the liabilities are no longer required to be recorded in the
consolidated financial statements. If the estimate of tax liabilities proves to be less than the ultimate assessment, a further charge to expense would result. It is reasonably possible that
approximately $5.0 million of Headwaters' unrecognized income tax benefits will be released within the next 12 months. Most of this amount relates to state taxes and is currently
expected to be released in the December 2015 quarter due to the expiration of statute of limitation time periods.
11. Equity Securities and Stock-Based Compensation
Authorized Stock—In addition to the 200.0 million shares of authorized common stock, Headwaters also has
10.0 million shares of authorized preferred stock. No preferred stock was issued or outstanding as of September 30, 2015 or at any time during the periods presented.
Issuance of Common Stock—In 2013, Headwaters issued 11.5 million shares of common stock for gross cash proceeds of
approximately $83.4 million. Offering costs totaled approximately $5.4 million, resulting in net proceeds of approximately $78.0 million.
Shelf Registration—In August 2015, Headwaters filed a universal shelf registration statement with the SEC. A prospectus
supplement describing the terms of any future securities to be issued is required to be filed before any offering can commence under the registration statement.
Treasury Shares Held for Deferred Compensation Obligation—In accordance with the terms of the Directors' Deferred
Compensation Plan (DDCP), non-employee directors can elect to defer certain compensation and choose from various options how the deferred compensation will be invested. One of the investment options
is Headwaters common stock. When a director chooses Headwaters stock as an investment option, Headwaters purchases the common stock in accordance with the director's request and holds the shares until
such time as the deferred compensation obligation becomes payable, normally when the director retires from the Board. At such time, the shares held by Headwaters are distributed to the director in
satisfaction of the obligation. Headwaters accounts for the purchase of common stock as treasury stock, at cost. The corresponding deferred compensation obligation is reflected in capital in excess of
par value. Changes in the fair value of the treasury stock are not recognized. As of September 30, 2015, the treasury stock and related deferred compensation obligation had fair values of
approximately $1.6 million, which was $0.6 million higher than the carrying values at cost.
F-30
Table of Contents
HEADWATERS INCORPORATED
NOTES TO CONSOLIDATED FINANCIAL STATEMENTS (Continued)
September 30, 2015
11. Equity Securities and Stock-Based Compensation (Continued)
Grants and Cancellations of Stock Incentive Awards—The Compensation Committee of Headwaters' Board of Directors (the
Committee) approved grants of approximately 0.5 million, 0.5 million and 0.3 million stock-based awards during 2013, 2014 and 2015, respectively. The awards consisted of
stock-settled SARs and restricted stock granted to officers and employees. Subsequent to September 30, 2015, the Committee approved grants of approximately 0.3 million stock-based awards
to officers and employees.
All
stock-based awards for the years 2013 through 2015 and subsequent thereto were granted under the stockholder-approved 2010 Incentive Compensation Plan, and all of the SARs vest over
an approximate three-year period, have an exercise price equal to the fair market value of Headwaters' common stock on the dates of grant and a contractual term of 10 years. Vesting of the SARs
and restricted stock granted prior to September 30, 2015 was subject to 60-day average stock price hurdles that precluded vesting unless the stock price exceeded by predetermined amounts the
stock prices on the dates of grant, which thresholds must be reached prior to the final vest dates. The stock price thresholds for all of those SAR and restricted stock grants have been met. When
exercised by grantees, stock-settled SARs are settled in Headwaters' common stock. Headwaters has also granted cash-settled SARs as described in Note 13.
Stock-Based Compensation—Stock-based compensation expense was approximately $1.7 million in 2013,
$2.2 million in 2014 and $2.8 million in 2015. The total income tax benefit recognized for stock-based compensation in the consolidated statements of income was $0 for 2013 and 2014 and
$1.0 million for 2015.
Valuation Assumptions—The fair values of stock-settled SARs have been estimated using the B-S-M model. The following
table summarizes the assumptions used in determining the fair values of these awards for the years indicated.
|
|
|
|
|
|
|
|
|
|
|
|
|
2013 |
|
2014 |
|
2015 |
|
Expected stock volatility |
|
|
65% |
|
|
60% |
|
|
60% |
|
Risk-free interest rates |
|
|
0.8% - 1.2% |
|
|
1.4% - 2.0% |
|
|
1.0% - 1.7% |
|
Expected lives (beyond vest dates) |
|
|
4 years |
|
|
4 years |
|
|
4 years |
|
Dividend yield |
|
|
0% |
|
|
0% |
|
|
0% |
|
Expected
stock price volatility was estimated primarily using historical volatilities of Headwaters' stock. Implied volatilities of traded options on Headwaters' stock, volatility
predicted by other models, and an analysis of volatilities used by other public companies in comparable lines of business to Headwaters were also considered. Risk-free interest rates used were the
U.S. Treasury bond yields with terms corresponding to the expected terms of the awards being valued. In estimating expected lives, Headwaters considered the contractual and vesting terms of awards,
along with historical experience; however, due to insufficient pertinent historical data from which to reliably estimate expected lives, Headwaters used estimates based on the "simplified method" set
forth by the SEC in Staff Accounting Bulletins No. 107 and 110, where expected life is estimated by summing the award's vesting term and contractual term and dividing that result by two.
Insufficient historical data from which to more reliably estimate expected lives is expected to exist for the foreseeable future due to the varying terms of awards granted in recent and past years,
along with other factors.
F-31
Table of Contents
HEADWATERS INCORPORATED
NOTES TO CONSOLIDATED FINANCIAL STATEMENTS (Continued)
September 30, 2015
11. Equity Securities and Stock-Based Compensation (Continued)
Equity Compensation Plans—Headwaters has five equity compensation plans under which outstanding awards have been granted,
four of which have been approved by stockholders. In connection with stockholder approval of the newest plan, the 2010 Incentive Compensation Plan (2010 ICP), Headwaters agreed to not issue any
additional stock-based awards under any of its other existing incentive compensation plans. Following the grants of equity-based awards made subsequent to September 30, 2015, approximately
3.3 million shares were available for future grants under the 2010 ICP.
Headwaters
uses newly issued shares to meet its obligations to issue stock when awards are exercised. The Committee, or in its absence the full Board, administers and interprets all
equity compensation plans. This Committee is authorized to grant stock-based awards and other awards both under the plans and outside of any plan to eligible employees, officers, directors, and
consultants of Headwaters. Terms of awards granted under the plans, including vesting requirements, are determined by the Committee and historically have varied significantly. Most outstanding awards
granted under the plans vest over a three-year period, expire ten years from the date of grant and are not transferable other than by will or by the laws of descent and distribution.
Stockholder Approval of Equity Compensation Plans—The following table presents information related to stockholder
approval of equity compensation plans as of September 30, 2015:
|
|
|
|
|
|
|
|
|
|
|
| (in thousands of shares) |
|
Plan Category
|
|
Maximum shares
to be issued upon
exercise of options
and other awards |
|
Weighted-average
exercise price of
outstanding
options and
other awards |
|
Shares remaining
available for future
issuance under existing
equity compensation plans
(excluding shares reflected
in the first column) |
|
Plans approved by stockholders |
|
|
3,602 |
|
$ |
7.28 |
|
|
3,625 |
|
Plan not approved by stockholders |
|
|
225 |
|
|
14.97 |
|
|
0 |
|
|
|
|
|
|
|
|
|
|
|
|
|
Total |
|
|
3,827 |
|
$ |
7.73 |
|
|
3,625 |
|
|
|
|
|
|
|
|
|
|
|
|
|
|
|
|
|
|
|
|
|
|
|
|
|
|
|
|
|
|
|
|
|
|
|
|
|
F-32
Table of Contents
HEADWATERS INCORPORATED
NOTES TO CONSOLIDATED FINANCIAL STATEMENTS (Continued)
September 30, 2015
11. Equity Securities and Stock-Based Compensation (Continued)
Stock Options—The following table summarizes the activity for all of Headwaters' stock options:
|
|
|
|
|
|
|
|
|
|
|
|
|
|
(in thousands, except per-share amounts)
|
|
Shares |
|
Weighted-
average
exercise
price |
|
Weighted-
average
remaining
contractual
term
in years |
|
Aggregate
intrinsic
value |
|
Outstanding at September 30, 2012 |
|
|
1,262 |
|
$ |
22.95 |
|
|
|
|
|
|
|
Forfeited or expired |
|
|
(644 |
) |
|
18.66 |
|
|
|
|
|
|
|
|
|
|
|
|
|
|
|
|
|
|
|
|
|
|
Outstanding at September 30, 2013 |
|
|
618 |
|
$ |
27.42 |
|
|
1.2 |
|
$ |
0 |
|
|
|
|
|
|
|
|
|
|
|
|
|
|
|
|
|
|
|
|
|
|
|
|
|
|
|
|
|
|
|
|
|
|
|
|
|
|
|
|
|
|
|
|
|
|
Forfeited or expired |
|
|
(437 |
) |
|
26.28 |
|
|
|
|
|
|
|
|
|
|
|
|
|
|
|
|
|
|
|
|
|
|
Outstanding at September 30, 2014 |
|
|
181 |
|
$ |
30.17 |
|
|
1.0 |
|
$ |
0 |
|
|
|
|
|
|
|
|
|
|
|
|
|
|
|
|
|
|
|
|
|
|
|
|
|
|
|
|
|
|
|
|
|
|
|
|
|
|
|
|
|
|
|
|
|
|
Forfeited or expired |
|
|
(85 |
) |
|
32.62 |
|
|
|
|
|
|
|
|
|
|
|
|
|
|
|
|
|
|
|
|
|
|
Outstanding at September 30, 2015 |
|
|
96 |
|
$ |
27.99 |
|
|
0.8 |
|
$ |
126 |
|
|
|
|
|
|
|
|
|
|
|
|
|
|
|
|
|
|
|
|
|
|
|
|
|
|
|
|
|
|
|
|
|
|
|
|
|
|
|
|
|
|
|
|
|
|
Exercisable at September 30, 2013 |
|
|
618 |
|
$ |
27.42 |
|
|
1.2 |
|
$ |
0 |
|
|
|
|
|
|
|
|
|
|
|
|
|
|
|
|
|
|
|
|
|
|
|
|
|
|
|
|
|
|
|
|
|
|
|
|
|
|
|
|
|
|
|
|
|
|
Exercisable at September 30, 2014 |
|
|
181 |
|
$ |
30.17 |
|
|
1.0 |
|
$ |
0 |
|
|
|
|
|
|
|
|
|
|
|
|
|
|
|
|
|
|
|
|
|
|
|
|
|
|
|
|
|
|
|
|
|
|
|
|
|
|
|
|
|
|
|
|
|
|
Exercisable at September 30, 2015 |
|
|
96 |
|
$ |
27.99 |
|
|
0.8 |
|
$ |
126 |
|
|
|
|
|
|
|
|
|
|
|
|
|
|
|
|
|
|
|
|
|
|
|
|
|
|
|
|
|
|
|
|
|
|
|
|
|
|
|
|
|
|
|
|
|
|
F-33
Table of Contents
HEADWATERS INCORPORATED
NOTES TO CONSOLIDATED FINANCIAL STATEMENTS (Continued)
September 30, 2015
11. Equity Securities and Stock-Based Compensation (Continued)
SARs—The following table summarizes the activity for all of Headwaters' stock-settled SARs:
|
|
|
|
|
|
|
|
|
|
|
|
|
|
(in thousands, except per-share amounts)
|
|
Shares |
|
Weighted-
average
threshold
price |
|
Weighted-
average
remaining
contractual
term
in years |
|
Aggregate
intrinsic
value |
|
Outstanding at September 30, 2012 |
|
|
3,894 |
|
$ |
7.41 |
|
|
|
|
|
|
|
Granted |
|
|
307 |
|
$ |
6.79 |
|
|
|
|
|
|
|
Exercised |
|
|
(322 |
) |
|
4.51 |
|
|
|
|
|
|
|
Forfeited or expired |
|
|
(240 |
) |
|
12.93 |
|
|
|
|
|
|
|
|
|
|
|
|
|
|
|
|
|
|
|
|
|
|
Outstanding at September 30, 2013 |
|
|
3,639 |
|
$ |
7.25 |
|
|
6.4 |
|
$ |
13,157 |
|
|
|
|
|
|
|
|
|
|
|
|
|
|
|
|
|
|
|
|
|
|
|
|
|
|
|
|
|
|
|
|
|
|
|
|
|
|
|
|
|
|
|
|
|
|
Granted |
|
|
314 |
|
$ |
9.19 |
|
|
|
|
|
|
|
Exercised |
|
|
(146 |
) |
|
5.18 |
|
|
|
|
|
|
|
Forfeited or expired |
|
|
(77 |
) |
|
16.15 |
|
|
|
|
|
|
|
|
|
|
|
|
|
|
|
|
|
|
|
|
|
|
Outstanding at September 30, 2014 |
|
|
3,730 |
|
$ |
7.31 |
|
|
5.7 |
|
$ |
22,893 |
|
|
|
|
|
|
|
|
|
|
|
|
|
|
|
|
|
|
|
|
|
|
|
|
|
|
|
|
|
|
|
|
|
|
|
|
|
|
|
|
|
|
|
|
|
|
Granted |
|
|
234 |
|
$ |
13.03 |
|
|
|
|
|
|
|
Exercised |
|
|
(344 |
) |
|
6.92 |
|
|
|
|
|
|
|
Forfeited or expired |
|
|
(42 |
) |
|
24.83 |
|
|
|
|
|
|
|
|
|
|
|
|
|
|
|
|
|
|
|
|
|
|
Outstanding at September 30, 2015 |
|
|
3,578 |
|
$ |
7.52 |
|
|
5.1 |
|
$ |
41,685 |
|
|
|
|
|
|
|
|
|
|
|
|
|
|
|
|
|
|
|
|
|
|
|
|
|
|
|
|
|
|
|
|
|
|
|
|
|
|
|
|
|
|
|
|
|
|
Exercisable at September 30, 2013 |
|
|
3,027 |
|
$ |
8.01 |
|
|
6.0 |
|
$ |
9,801 |
|
|
|
|
|
|
|
|
|
|
|
|
|
|
|
|
|
|
|
|
|
|
|
|
|
|
|
|
|
|
|
|
|
|
|
|
|
|
|
|
|
|
|
|
|
|
Exercisable at September 30, 2014 |
|
|
3,418 |
|
$ |
7.21 |
|
|
5.5 |
|
$ |
21,604 |
|
|
|
|
|
|
|
|
|
|
|
|
|
|
|
|
|
|
|
|
|
|
|
|
|
|
|
|
|
|
|
|
|
|
|
|
|
|
|
|
|
|
|
|
|
|
Exercisable at September 30, 2015 |
|
|
3,320 |
|
$ |
7.21 |
|
|
4.8 |
|
$ |
39,793 |
|
|
|
|
|
|
|
|
|
|
|
|
|
|
|
|
|
|
|
|
|
|
|
|
|
|
|
|
|
|
|
|
|
|
|
|
|
|
|
|
|
|
|
|
|
|
The
weighted-average grant-date fair value of SARs granted was $3.38, $4.40 and $6.41 in 2013, 2014 and 2015, respectively. The total intrinsic value of SARs exercised was approximately
$1.8 million, $1.1 million and $3.9 million in 2013, 2014 and 2015, respectively.
Other Stock-Based Awards and Unrecognized Compensation Cost—In addition to the SARs granted as reflected in the table
above, during 2013 through 2015 Headwaters also issued approximately 0.4 million shares of restricted common stock to officers and employees, all of which vests over an approximate three-year
period. The restricted stock was issued at no cost to the recipients and compensation expense equal to the trading price of the stock on the dates of grant is therefore
F-34
Table of Contents
HEADWATERS INCORPORATED
NOTES TO CONSOLIDATED FINANCIAL STATEMENTS (Continued)
September 30, 2015
11. Equity Securities and Stock-Based Compensation (Continued)
recognized
over the respective vesting periods, which also represent the requisite service periods. The following table summarizes the activity for Headwaters' nonvested restricted stock during 2015:
|
|
|
|
|
|
|
|
(in thousands of shares)
|
|
Shares |
|
Weighted-
average
grant date
fair value |
|
Outstanding at beginning of year |
|
|
151 |
|
$ |
8.38 |
|
Granted |
|
|
116 |
|
|
13.03 |
|
Vested |
|
|
(138 |
) |
|
9.38 |
|
Forfeited |
|
|
(3 |
) |
|
9.85 |
|
|
|
|
|
|
|
|
|
|
Outstanding at end of year |
|
|
126 |
|
$ |
11.51 |
|
|
|
|
|
|
|
|
|
|
|
|
|
|
|
|
|
|
|
|
|
|
|
|
|
|
|
|
Headwaters
also recognizes compensation expense in connection with its Employee Stock Purchase Plan (ESPP). Compensation expense related to restricted stock and the ESPP was
approximately $0.7 million, $0.9 million and $1.4 million in 2013, 2014 and 2015, respectively.
As
of September 30, 2015, there was approximately $2.3 million of total compensation cost related to unvested awards not yet recognized, which will be recognized over a
weighted-average period of approximately 1.7 years. Due to the grant of stock-based awards subsequent to September 30, 2015 described above, the amount of total compensation cost related
to nonvested awards has increased, and the weighted-average period over which compensation cost will be recognized has changed.
12. Earnings Per Share
The following table sets forth the computations of basic and diluted EPS for the years indicated, reflecting the amounts attributable to Headwaters and excluding the amounts attributable
to the non-controlling interest in Entegra. In accordance with ASC 260, income from continuing operations for each period is used as the control number in determining whether potentially dilutive
common
F-35
Table of Contents
HEADWATERS INCORPORATED
NOTES TO CONSOLIDATED FINANCIAL STATEMENTS (Continued)
September 30, 2015
12. Earnings Per Share (Continued)
shares
should be included in the diluted earnings per share computations for those periods, even when the effect of doing so is anti-dilutive to the other per-share amounts.
|
|
|
|
|
|
|
|
|
|
|
(in thousands, except per-share amounts)
|
|
2013 |
|
2014 |
|
2015 |
|
Numerator: |
|
|
|
|
|
|
|
|
|
|
Income from continuing operations |
|
$ |
8,285 |
|
$ |
16,473 |
|
$ |
132,128 |
|
Income from continuing operations attributable to non-controlling interest |
|
|
0 |
|
|
(774 |
) |
|
(869 |
) |
Adjustment of estimated redemption value of non-controlling interest |
|
|
0 |
|
|
(176 |
) |
|
0 |
|
|
|
|
|
|
|
|
|
|
|
|
|
Numerator for basic and diluted earnings per share from continuing operations—income from continuing operations attributable to Headwaters
Incorporated |
|
|
8,285 |
|
|
15,523 |
|
|
131,259 |
|
Numerator for basic and diluted earnings per share from discontinued operations—loss from discontinued operations, net of income taxes |
|
|
(1,148 |
) |
|
(415 |
) |
|
(460 |
) |
|
|
|
|
|
|
|
|
|
|
|
|
Numerator for basic and diluted earnings per share—net income attributable to Headwaters Incorporated |
|
$ |
7,137 |
|
$ |
15,108 |
|
$ |
130,799 |
|
|
|
|
|
|
|
|
|
|
|
|
|
|
|
|
|
|
|
|
|
|
|
|
|
|
|
|
|
|
|
|
|
|
|
|
|
Denominator: |
|
|
|
|
|
|
|
|
|
|
Denominator for basic earnings per share—weighted-average shares outstanding |
|
|
70,128 |
|
|
73,160 |
|
|
73,570 |
|
Effect of dilutive securities—shares issuable upon exercise of options and SARs and vesting of restricted stock |
|
|
1,124 |
|
|
1,291 |
|
|
2,032 |
|
|
|
|
|
|
|
|
|
|
|
|
|
Denominator for diluted earnings per share—weighted-average shares outstanding after assumed exercises and vesting |
|
|
71,252 |
|
|
74,451 |
|
|
75,602 |
|
|
|
|
|
|
|
|
|
|
|
|
|
|
|
|
|
|
|
|
|
|
|
|
|
|
|
|
|
|
|
|
|
|
|
|
|
Basic income (loss) per share attributable to Headwaters Incorporated: |
|
|
|
|
|
|
|
|
|
|
From continuing operations |
|
$ |
0.12 |
|
$ |
0.21 |
|
$ |
1.79 |
|
From discontinued operations |
|
|
(0.02 |
) |
|
(0.01 |
) |
|
(0.01 |
) |
|
|
|
|
|
|
|
|
|
|
|
|
|
|
$ |
0.10 |
|
$ |
0.20 |
|
$ |
1.78 |
|
|
|
|
|
|
|
|
|
|
|
|
|
|
|
|
|
|
|
|
|
|
|
|
|
|
|
|
|
|
|
|
|
|
|
|
|
Diluted income (loss) per share attributable to Headwaters Incorporated: |
|
|
|
|
|
|
|
|
|
|
From continuing operations |
|
$ |
0.12 |
|
$ |
0.21 |
|
$ |
1.74 |
|
From discontinued operations |
|
|
(0.02 |
) |
|
(0.01 |
) |
|
(0.01 |
) |
|
|
|
|
|
|
|
|
|
|
|
|
|
|
$ |
0.10 |
|
$ |
0.20 |
|
$ |
1.73 |
|
|
|
|
|
|
|
|
|
|
|
|
|
|
|
|
|
|
|
|
|
|
|
|
|
|
|
|
|
|
|
|
|
|
|
|
|
Anti-dilutive securities not considered in diluted EPS calculation: |
|
|
|
|
|
|
|
|
|
|
Stock-settled SARs |
|
|
2,479 |
|
|
2,279 |
|
|
1,258 |
|
Stock options |
|
|
906 |
|
|
446 |
|
|
89 |
|
Restricted stock |
|
|
105 |
|
|
126 |
|
|
66 |
|
13. Commitments and Contingencies
Commitments and contingencies as of September 30, 2015 not disclosed elsewhere, are as follows.
F-36
Table of Contents
HEADWATERS INCORPORATED
NOTES TO CONSOLIDATED FINANCIAL STATEMENTS (Continued)
September 30, 2015
13. Commitments and Contingencies (Continued)
Leases—Headwaters has noncancellable operating leases for certain facilities and equipment. These leases, most of which
are in the construction materials segment, currently are set to expire in various years through 2032, but many have renewal options under which the lease term can be extended. Rental expense was
approximately $34.9 million, $33.4 million and $34.4 million in 2013, 2014 and 2015, respectively. As of September 30, 2015, minimum rental payments due under these leases
are as follows:
|
|
|
|
|
Year ending September 30:
|
|
(in thousands) |
|
2016 |
|
$ |
29,067 |
|
2017 |
|
|
22,879 |
|
2018 |
|
|
16,756 |
|
2019 |
|
|
12,148 |
|
2020 |
|
|
7,644 |
|
Thereafter |
|
|
16,443 |
|
|
|
|
|
|
|
|
|
$ |
104,937 |
|
|
|
|
|
|
|
|
|
|
|
|
|
|
|
|
|
|
|
Purchase Commitments—Certain CCP contracts with suppliers require Headwaters to make minimum purchases of CCP materials.
Actual purchases under contracts with minimum requirements were approximately $14.9 million, $20.3 million and $32.7 million in 2013, 2014 and 2015, respectively. As of
September 30, 2015, minimum future purchase requirements are as follows:
|
|
|
|
|
Year ending September 30:
|
|
(in thousands) |
|
2016 |
|
$ |
18,123 |
|
2017 |
|
|
16,499 |
|
2018 |
|
|
13,930 |
|
2019 |
|
|
13,539 |
|
2020 |
|
|
13,811 |
|
Thereafter |
|
|
62,096 |
|
|
|
|
|
|
|
|
|
$ |
137,998 |
|
|
|
|
|
|
|
|
|
|
|
|
|
|
|
|
|
|
|
Subsequent
to September 30, 2015, certain contract extensions were executed that increased the minimum future purchase requirements shown in the above table by a total of
approximately $43.0 million.
Compensation Arrangements—Employment Agreements. Headwaters has entered
into employment agreements with its Chief Executive Officer (CEO), Chief Financial Officer (CFO) and three other employees. The agreements have original terms of approximately three years and the CEO
and CFO agreements are renewable for one-year terms. The CEO's agreement calls for supplemental retirement contributions equal to 72.5% of his salary during the term of the agreement. The aggregate
commitment for salaries and other obligations for all future periods as of September 30, 2015, assuming no renewals, is approximately $3.3 million. The agreements also provide for
certain termination benefits. If the officers' and employees' employment would have terminated on September 30, 2015 (but not by reason of a change in control, which is described hereafter),
the aggregate termination
F-37
Table of Contents
HEADWATERS INCORPORATED
NOTES TO CONSOLIDATED FINANCIAL STATEMENTS (Continued)
September 30, 2015
13. Commitments and Contingencies (Continued)
benefits
as of that date would have been approximately $10.3 million, of which approximately $4.0 million has been expensed and accrued.
Executive Change in Control Agreements. The Compensation Committee (Committee) has approved "Executive Change in Control Agreements"
with certain
officers and employees. Upon a change in control, as defined, the agreements provide for immediate vesting and exercisability of all outstanding stock-based awards. In addition, if termination of
employment occurs within a specified period of a change in control, the agreements provide for i) severance pay equal to a stipulated multiple of the sum of the person's current annual salary
plus a bonus component based on either past bonuses paid or the target bonus for the fiscal year in which the change in control occurs; and ii) continuance of health and
other benefits and perquisites for a stipulated period following the change in control. Further, if any long-term cash awards are not continued, payment shall be made based on the pro-rated level of
performance achieved as of the end of the most recently completed fiscal quarter. If terminations associated with a change in control would have occurred on September 30, 2015, the cash
severance payments due to the officers and employees (including amounts due under long-term cash awards and the estimated costs of continuing benefits and perquisites) and the excess of the market
value of unvested stock-based awards on that date above related exercise prices would have aggregated approximately $25.6 million (of which approximately $10.8 million has been expensed
and accrued).
Cash Performance Unit Awards. In 2013, the Committee approved grants of performance unit awards to certain officers and employees, to
be settled in
cash, based on the achievement of cash flow generated during 2013. For purposes of these awards, cash flow is generally defined as operating income plus depreciation, amortization and asset
impairments, reduced by capital expenditures. The number of awards granted was determined using a target compensation amount for each participant and was adjusted, subject to prescribed limitations,
based on the actual cash flow generated during the 2013 performance year, using a threshold/target/maximum adjustment structure. The awards provided for 50% vesting as of September 30, 2014 and
50% vesting as of September 30, 2015, provided the participant was still employed by Headwaters on those vest dates. The terms of the awards also provided for adjustment for changes in
Headwaters' average stock price for the 60 days prior to and including September 30, 2013 as compared to Headwaters' average stock price for the 60 days prior to and including
September 30, 2012. Approximately $4.7 million of expense was recorded for the 2013 awards, all of which was recognized in 2013.
In
2014 and 2015, the Committee approved grants of performance unit awards to certain officers and employees for cash flow generated during those fiscal years, with terms similar to the
2013 awards described above, with an added feature that provides for potential further adjustment based on cash flows generated in the two years subsequent to the year of grant, or the base
performance year. Approximately $5.1 million and $8.6 million of expense was recognized for these awards during 2014 and 2015, which amounts are subject to adjustment, depending on cash
flows generated in future years. As of September 30, 2015, approximately $15.7 million was accrued for all performance unit awards outstanding but unpaid as of that date.
Subsequent
to September 30, 2015, the Committee approved grants of performance unit awards to certain officers and employees for cash flow generated during 2016, with terms
similar to those
F-38
Table of Contents
HEADWATERS INCORPORATED
NOTES TO CONSOLIDATED FINANCIAL STATEMENTS (Continued)
September 30, 2015
13. Commitments and Contingencies (Continued)
described
above for 2014 and 2015. Expense for these awards will be recognized during 2016, subject to potential adjustments in 2017 and 2018, depending on cash flows generated in those years.
Cash-Settled SAR Grants. In 2012, the Committee approved grants to certain officers and employees of approximately 1.0 million
cash-settled
SARs, approximately 0.1 million of which remain outstanding as of September 30, 2015. These SARs, which are considered liability awards, vested in annual installments through
September 30, 2014 and are settled in cash upon exercise by the employee. As of September 30, 2015, approximately $1.6 million has been accrued for outstanding awards because the
stock price at that date was above the grant-date stock price of $1.85. Changes in Headwaters' stock price through the dates employees exercise the SARs (whether positive or negative) will result in
adjustments to compensation expense and will be reflected in Headwaters' statement of income each quarter in fiscal 2016, until the SARs are exercised or expire on September 30, 2016.
In
2011, the Committee approved grants to certain employees of approximately 0.4 million cash-settled SARs, none of which remain outstanding as of September 30, 2015, the
termination date of these awards. Compensation expense for all cash-settled SARs was approximately $4.6 million for both 2013 and 2014 and $3.1 million for 2015.
Employee Benefit Plans—In addition to standard health and life insurance programs, Headwaters has six employee benefit
plans that were operative during the years presented: the 401(k) Profit Sharing Plan (401(k) Plan), the 2000 Employee Stock Purchase Plan (ESPP), the Incentive Bonus Plan (IBP), the Deferred
Compensation Plan (DCP), the 2010 Incentive Compensation Plan (2010 ICP) and an Executive Retirement Program (ERP). Substantially all employees of Headwaters are eligible to participate in the 401(k)
Plan and the ESPP after meeting length of service requirements. Only designated employees are eligible to participate in the IBP, DCP, 2010 ICP and ERP.
The
total expense for all of Headwaters' benefit plans combined, including all general and discretionary bonuses and cash-settled SARs, but excluding stock-settled SARs and ESPP expenses
(which are included in stock-based compensation) and standard health and life insurance programs, was approximately $23.0 million, $26.7 million and $34.8 million in 2013, 2014
and 2015, respectively.
401(k) Plan. Under the terms of the 401(k) Plan, eligible employees may elect to make tax-deferred contributions of up to 50% of their
compensation,
subject to statutory limitations. Headwaters has a "safe harbor" 401(k) plan which requires a mandatory minimum employer match of employee contributions and immediate vesting of employer
contributions. Headwaters is not required to be profitable to make the matching contributions.
ESPP. The ESPP provides eligible employees with an opportunity to purchase Headwaters common stock on favorable terms and to pay for
such purchases
through payroll deductions. Approximately 4.3 million shares of common stock have been reserved for issuance under the ESPP and approximately 2.3 million shares remain available for
future issuance as of September 30, 2015. In accordance with terms of the ESPP, participating employees purchase shares of stock directly from Headwaters, which provides newly-issued shares to
meet its commitment. The ESPP is intended to comply with Section 423 of the Internal Revenue Code, but is not subject to the requirements of ERISA. Employees purchase stock through payroll
deductions of 1% to 10% of cash compensation, subject to certain limitations, which stock is purchased in a series of quarterly offerings. The cost per
F-39
Table of Contents
HEADWATERS INCORPORATED
NOTES TO CONSOLIDATED FINANCIAL STATEMENTS (Continued)
September 30, 2015
13. Commitments and Contingencies (Continued)
share
to the employee is 85% of the stock's fair market value at the end of each quarterly offering period.
IBP. The IBP, the specifics of which are approved annually by the Committee, provides for annual cash bonuses to be paid if Headwaters
accomplishes
certain financial goals and if participating employees meet individual goals.
DCP. The DCP is a nonqualified plan that allows eligible employees to make tax-deferred contributions of up to 50% of their base
compensation and
100% of their incentive compensation. Headwaters may match employee contributions up to a designated maximum rate, which matching contributions have historically vested after three years of plan
eligibility. Effective January 1, 2013, Headwaters agreed to a match (similar to the "safe harbor" 401(k) match discussed above) of certain employee contributions, again with immediate vesting
of employer contributions. Headwaters is not required to be profitable to make the matching contributions.
2010 ICP. Following stockholder approval of the 2010 ICP, Headwaters has issued long-term cash and equity awards under that plan.
Significant
obligations under the 2010 ICP include i) the cash performance unit awards described above; ii) the cash-settled SAR grants described above; and iii) grants of certain stock-based
awards described in Note 11.
ERP. In 2013, Headwaters initiated the ERP to provide retirement benefits to designated officers and employees. There is no formal plan
document
governing this program, which operates and is funded at the sole discretion of the Committee. Although it is the current intent of the Committee to consider funding the ERP annually, there is no
obligation to make contributions in any amount for any period, irrespective of whether Headwaters is profitable. Headwaters' contributions to participants in the ERP vest 20% per year once a
participant reaches the age of 61 and become fully vested at age 65.
Self Insurance—Headwaters has adopted self-insured medical insurance plans that cover substantially all employees. There
is stop-loss coverage for amounts in excess of approximately $0.2 million per individual per year. Headwaters also self insures for workers compensation claims in most states, limited by
stop-loss coverage which begins for amounts in excess of $0.35 million per occurrence and approximately $5.2 million in the aggregate annually. Headwaters has contracted with third-party
administrators to assist in the payment and administration of claims. Insurance claims are recognized as expense when incurred and include an estimate of costs for claims incurred but not reported at
the balance sheet date. As of September 30, 2015, approximately $5.5 million was accrued for medical and workers compensation claims incurred on or before September 30, 2015 that
have not been paid or reported.
Property, Plant and Equipment—As of September 30, 2015, Headwaters was committed to spend approximately
$1.3 million on capital projects that were in various stages of completion.
Legal Matters—Headwaters has ongoing litigation and asserted claims which have been incurred during the normal course of
business, including the specific matters discussed below. Headwaters intends to vigorously defend or resolve these matters by settlement, as appropriate. Management does not currently believe that the
outcome of these matters will have a material adverse effect on Headwaters' operations, cash flow or financial position.
F-40
Table of Contents
HEADWATERS INCORPORATED
NOTES TO CONSOLIDATED FINANCIAL STATEMENTS (Continued)
September 30, 2015
13. Commitments and Contingencies (Continued)
Headwaters
incurred approximately $3.3 million, $5.1 million and $2.2 million of expense for legal matters in 2013, 2014 and 2015, respectively. Except for 2014,
when $2.8 million of expense was recorded for potential losses, costs for outside legal counsel comprised a majority of Headwaters' litigation-related costs in the years presented. Headwaters
currently believes the range of potential loss for all unresolved legal matters, excluding costs for outside counsel, is from $2.5 million up to the amounts sought by claimants and has recorded
a liability as of September 30, 2015 of $2.5 million. The substantial claims
and damages sought by claimants in excess of this amount are not currently deemed to be probable. Headwaters' outside counsel and management currently believe that unfavorable outcomes of outstanding
litigation beyond the amount accrued are neither probable nor remote. Accordingly, management cannot express an opinion as to the ultimate amount, if any, of Headwaters' liability, nor is it possible
to estimate what litigation-related costs will be in future periods.
The
specific matters discussed below raise difficult and complex legal and factual issues, and the resolution of these issues is subject to many uncertainties, including the facts and
circumstances of each case, the jurisdiction in which each case is brought, and the future decisions of juries, judges, and arbitrators. Therefore, although management believes that the claims
asserted against Headwaters in the named cases lack merit, there is a possibility of material losses in excess of the amount accrued if one or more of the cases were to be determined adversely against
Headwaters for a substantial amount of the damages asserted. It is possible that a change in the estimate of probable liability could occur, and the changes could be material. Additionally, as with
any litigation, these proceedings require that Headwaters incur substantial costs, including attorneys' fees, managerial time and other personnel resources, in pursuing resolution.
EPA. In April 2012, Headwaters Resources, Inc. (HRI) filed a complaint in the United States District Court for the District of
Columbia
against the United States Environmental Protection Agency (EPA). The complaint alleged that the EPA failed to review, and where necessary, revise RCRA subtitle D regulations applicable to the
disposal of coal ash within the timeframe required by statute. Other parties also initiated litigation against the EPA alleging the same (and other) failures of the EPA to perform its duties regarding
coal ash disposal regulations. HRI's complaint sought certain declaratory relief with respect to EPA rulemaking at issue in the case. The District Court consolidated HRI's case with related actions
brought by other parties. In October 2013, the District Court granted summary judgment that the EPA failed to fulfill its statutory duty to review coal ash disposal regulations, among other things,
ordering the EPA to propose a schedule to complete its review of coal ash disposal regulations, and, as necessary, revise the regulations. In May 2014, the District Court entered a consent decree
ordering the EPA to take final action in December 2014 regarding EPA's proposed revisions of RCRA subtitle D regulations pertaining to coal combustion residuals. In December 2014, the EPA issued a
prepublication notice of a final rule to regulate the disposal of coal combustion residuals as solid (non-hazardous) waste under subtitle D of RCRA, with national minimum criteria for CCR landfills
and impoundments consisting of location restrictions, design and operating criteria, groundwater monitoring and corrective action, closure requirements, post closure care, recordkeeping and reporting,
and other requirements. The final rule was published in the Federal Register in April 2015 and became effective October 19, 2015. The litigation has been terminated.
Fentress Families Trust. VFL Technology Corporation (VFL), acquired by HRI in 2004, provides services related to fly ash management to
Virginia
Electric and Power Company (VEPCO). In February
F-41
Table of Contents
HEADWATERS INCORPORATED
NOTES TO CONSOLIDATED FINANCIAL STATEMENTS (Continued)
September 30, 2015
13. Commitments and Contingencies (Continued)
2012,
383 plaintiffs, most of whom are residents living in the City of Chesapeake, Virginia, filed a complaint in the State of Virginia Chesapeake Circuit Court against 15 defendants, including VEPCO,
and certain other persons associated with the Battlefield Golf Course, including owners, developers, contractors, and others, including VFL and Headwaters, alleging causes of action for nuisance and
negligence. The complaint alleges that fly ash used to construct the golf course was carried in the air and contaminated water exposing plaintiffs to dangerous chemicals and causing property damage.
Plaintiffs' complaint seeks injunctive relief and damages of approximately $850.0 million for removal and remediation of the fly ash and the water supply, $1.9 billion for vexation,
$8.0 million and other unspecified amounts for personal injuries, and $55.0 million as damages to properties, plus prejudgment interest, attorney fees, and costs. In a related case,
other plaintiffs have filed a separate lawsuit asserting the same claims against the same defendants claiming additional damages totaling approximately $307.2 million. In August 2013 the court
ruled on VEPCO's demurrer ordering that claims for personal injury or property damage based upon allegations of groundwater contamination were dismissed but that claims of nuisance and negligence
based upon allegations of air-borne ash and contaminated surface water would not be dismissed. These cases are based on substantially the same alleged circumstances asserted in complaints filed by the
plaintiffs in 2009 and voluntarily dismissed in 2010. Discovery is underway. HRI has filed claims for defense and indemnity with several of its insurers. In 2010, HRI filed suit in the United States
District Court for the District of Utah against two insurers that denied coverage based on allegations in the 2009 Fentress complaints. The District Court ruled in the insurers' favor, which ruling
was affirmed in October 2014 by the United States Court of Appeals for the Tenth Circuit. Another insurer continues to pay for the defense of the underlying cases under a reservation of rights. The
relatively novel fly ash claims of the plaintiffs together with multiple insurance policies and policy periods make insurance coverage issues complex and uncertain. Moreover, plaintiffs' total claims
exceed the potential limits of insurance available to HRI. Because resolution of the litigation is uncertain, legal counsel and management cannot express an opinion as to the ultimate amount, if any,
of HRI's liability, or the insurers' obligation to indemnify HRI against loss, if any.
Clary. In August 2014, 77 plaintiffs filed suit in the State of West Virginia Circuit Court of Mason County against four defendants,
including
American Electric Power Co., Inc., Ohio Power Company and an individual. Plaintiffs claim injury resulting from exposure to coal combustion waste from the Gavin Power Plant in Cheshire,
Ohio while working as employees of contractors in the Gavin landfill. Plaintiffs claim wrongful death, failure to warn and protect, negligence per se, negligence, negligent infliction of emotional
distress, heightened duty, strict liability, battery, fraud, fraudulent concealment, misrepresentation and related causes of action, seeking unspecified damages for medical monitoring and other costs,
loss of consortium, lost wages, personal injuries, and punitive damages. In September 2015, the Ohio Power Company filed a third-party complaint against Headwaters and two other entities who were
contractors to Ohio Power Company. Ohio Power Company claims that the third-party defendant contractors operated the Gavin landfill and that plaintiffs are former employees or family members of the
third-party defendants. Ohio Power Company denies the plaintiffs' allegations, but states that Headwaters and the other third-party defendants are required to indemnify Ohio Power and provide
contribution to the extent that Ohio Power is found liable to plaintiffs, including interest, fees, and costs. The case is stayed while issues about the proper venue for the litigation are resolved.
Because resolution of the litigation is uncertain, legal counsel and management cannot express an
F-42
Table of Contents
HEADWATERS INCORPORATED
NOTES TO CONSOLIDATED FINANCIAL STATEMENTS (Continued)
September 30, 2015
13. Commitments and Contingencies (Continued)
opinion
as to the ultimate amount, if any, of Headwaters' liability, or whether insurers have an obligation to indemnify Headwaters against loss, if any.
Building Products Matters. There are litigation and pending and threatened claims made against certain subsidiaries within Headwaters'
building
products segment, with respect to several types of exterior finish systems manufactured and sold by its subsidiaries for application by contractors on residential and commercial buildings. The
plaintiffs or claimants in these matters typically allege that the structures have suffered damage from water penetration due to some alleged failure of the roofing product or wall system. The claims
most often involve alleged liabilities associated with certain roofing, stucco, and architectural stone products which are produced and sold by certain subsidiaries of Headwaters.
The
foregoing litigation and claims typically cite damages for alleged personal injuries, property damage, economic loss, unfair business practices and punitive damages. Claims made
against Headwaters and its subsidiaries generally have been paid by their insurers, subject to Headwaters' payment of deductibles or self-insured retentions, although such insurance carriers typically
have issued "reservation of rights" letters. There is no guarantee of insurance coverage or continuing coverage. These and future proceedings may result in substantial costs to Headwaters and its
subsidiaries, including attorneys' fees, managerial time and other personnel resources and costs. Adverse resolution of these proceedings could have a materially negative effect on Headwaters'
businesses, financial condition, and results of operation, and its ability to meet its financial obligations. Although Headwaters carries general and product liability insurance, subject to exclusions
and self-insured retentions, Headwaters cannot assure that such insurance coverage will remain available, that Headwaters' insurance carriers will remain viable, will accept claims or that the insured
amounts will cover all claims in excess of self-insured retentions. Future rate increases may also make such insurance uneconomical for Headwaters to maintain. Because resolution of the litigation,
claims, and insurance coverage is uncertain, legal counsel and management cannot express an opinion as to the ultimate amount, if any, of Headwaters' or its subsidiaries' liability.
Construction Materials Matters. In addition, there are litigation and pending and threatened claims made against HRI within Headwaters'
construction
materials segment, with respect to coal combustion products. The plaintiffs or claimants in these matters have alleged that inhalation or other exposure to fly ash is unsafe, and that HRI has failed
to warn about the alleged dangers of fly ash exposure and the use of adequate protection, resulting in personal injury, contamination of land and water, and diminution in property value. The Fentress Family
Trust and Clary cases summarized above are examples of these types of claims. The
application of relatively novel fly ash claims to insurance policies is complex and uncertain and HRI has had limited success in tendering defense of such claims to
insurers, which is dependent upon the alleged facts and specific policy terms. Adverse resolution of these claims and insurance coverage disputes could have a materially negative effect on Headwaters'
businesses, financial condition, and results of operation, and its ability to meet its financial obligations. Because resolution of the litigation, claims, and insurance coverage disputes is
uncertain, legal counsel and management cannot express an opinion as to the ultimate amount, if any, of HRI's liability.
F-43
Table of Contents
HEADWATERS INCORPORATED
NOTES TO CONSOLIDATED FINANCIAL STATEMENTS (Continued)
September 30, 2015
13. Commitments and Contingencies (Continued)
Discontinued Coal Cleaning Operations. The following litigation relates to the discontinued coal cleaning business:
RLF Chinook Properties. In September 2015, RLF Chinook Properties, LLC filed suit in the State of Indiana Circuit Court of Clay
against Covol
Fuels No. 2, LLC, Headwaters Energy Services Corp., other Covol companies (collectively, "Covol"), as well as BRC Chinook, LLC and other BRC affiliates (collectively, "BRC").
Covol entered into a coal recovery agreement with plaintiff in 2007 with respect to coal at the RLF Chinook site. Covol assigned the coal recovery agreement to BRC in 2013. Plaintiff alleges that BRC
has failed to fulfill certain obligations under the coal recovery agreement, including failure to submit reclamation plans to State of Indiana for approval and to restore and reclaim the site per the
approved plan. Plaintiff alleges that Covol is liable for the claimed breaches under the coal recovery agreement, and seeks unspecified damages, together with attorney fees and costs. Because
resolution of the litigation is uncertain, legal counsel and management cannot express an opinion as to the ultimate amount, if any, of Covol's liability.
Other. Headwaters and its subsidiaries are also involved in other legal proceedings that have arisen in the normal course of business.
Because
resolution of these proceedings is uncertain, legal counsel and management cannot express an opinion as to the ultimate amount, if any, of Headwaters' liability.
14. Related Party Transactions
In addition to transactions disclosed elsewhere, Headwaters was involved in the following transactions with related parties. A director of Headwaters, who retired from the Board in 2014,
was also a principal in one of the insurance brokerage companies Headwaters uses to purchase certain insurance benefits for its employees. Commissions paid to that company by providers of insurance
services to Headwaters totaled approximately $0.1 million in both 2013 and 2014.
Until
December 2013, when the contract was terminated, a majority of one of Headwaters' subsidiary's transportation needs was provided by a company, two of the principals of which are
related to an officer of the subsidiary. Costs incurred were approximately $6.4 million in 2013 and $1.4 million in 2014.
15. Condensed Consolidating Financial Information
Headwaters' borrowings under the Term Loan Facility and the 71/4% senior notes are jointly and severally, fully and unconditionally guaranteed by Headwaters Incorporated
and by substantially all of
Headwaters' 100%-owned domestic subsidiaries. Separate stand-alone financial statements and disclosures for Headwaters Incorporated and each of the guarantor subsidiaries are not presented because the
guarantees are full and unconditional and the guarantor subsidiaries have joint and several liability.
There
are no significant restrictions on the ability of Headwaters Incorporated to obtain funds from the guarantor subsidiaries nor on the ability of the guarantor subsidiaries to obtain
funds from Headwaters Incorporated or other guarantor subsidiaries. Non-guaranteeing entities include subsidiaries that are not 100% owned, foreign subsidiaries and joint ventures in which Headwaters
has a non-controlling ownership interest.
F-44
Table of Contents
HEADWATERS INCORPORATED
NOTES TO CONSOLIDATED FINANCIAL STATEMENTS (Continued)
September 30, 2015
15. Condensed Consolidating Financial Information (Continued)
CONDENSED CONSOLIDATING BALANCE SHEET—September 30, 2014
|
|
|
|
|
|
|
|
|
|
|
|
|
|
|
|
|
(in thousands)
|
|
Guarantor
Subsidiaries |
|
Non-guarantor
Subsidiaries |
|
Parent
Company |
|
Eliminations
and
Reclassifications |
|
Headwaters
Consolidated |
|
ASSETS |
|
|
|
|
|
|
|
|
|
|
|
|
|
|
|
|
Current assets: |
|
|
|
|
|
|
|
|
|
|
|
|
|
|
|
|
Cash and cash equivalents |
|
$ |
33,552 |
|
$ |
5,764 |
|
$ |
113,226 |
|
$ |
— |
|
$ |
152,542 |
|
Trade receivables, net |
|
|
113,940 |
|
|
5,390 |
|
|
|
|
|
|
|
|
119,330 |
|
Inventories |
|
|
48,482 |
|
|
2,151 |
|
|
|
|
|
|
|
|
50,633 |
|
Deferred income taxes |
|
|
15,509 |
|
|
289 |
|
|
18,427 |
|
|
(23,149 |
) |
|
11,076 |
|
Other |
|
|
9,286 |
|
|
168 |
|
|
1,082 |
|
|
|
|
|
10,536 |
|
|
|
|
|
|
|
|
|
|
|
|
|
|
|
|
|
|
|
Total current assets |
|
|
220,769 |
|
|
13,762 |
|
|
132,735 |
|
|
(23,149 |
) |
|
344,117 |
|
|
|
|
|
|
|
|
|
|
|
|
|
|
|
|
|
|
|
Property, plant and equipment, net |
|
|
162,458 |
|
|
10,861 |
|
|
7,979 |
|
|
— |
|
|
181,298 |
|
|
|
|
|
|
|
|
|
|
|
|
|
|
|
|
|
|
|
Other assets: |
|
|
|
|
|
|
|
|
|
|
|
|
|
|
|
|
Goodwill |
|
|
145,068 |
|
|
30,518 |
|
|
|
|
|
|
|
|
175,586 |
|
Intangible assets, net |
|
|
131,150 |
|
|
28,713 |
|
|
|
|
|
|
|
|
159,863 |
|
Investments in subsidiaries |
|
|
|
|
|
|
|
|
406,327 |
|
|
(406,327 |
) |
|
— |
|
Intercompany accounts and notes |
|
|
|
|
|
|
|
|
637,046 |
|
|
(637,046 |
) |
|
— |
|
Deferred income taxes |
|
|
41,658 |
|
|
|
|
|
22,928 |
|
|
(64,586 |
) |
|
— |
|
Other |
|
|
14,388 |
|
|
2,194 |
|
|
18,860 |
|
|
|
|
|
35,442 |
|
|
|
|
|
|
|
|
|
|
|
|
|
|
|
|
|
|
|
Total other assets |
|
|
332,264 |
|
|
61,425 |
|
|
1,085,161 |
|
|
(1,107,959 |
) |
|
370,891 |
|
|
|
|
|
|
|
|
|
|
|
|
|
|
|
|
|
|
|
Total assets |
|
$ |
715,491 |
|
$ |
86,048 |
|
$ |
1,225,875 |
|
$ |
(1,131,108 |
) |
$ |
896,306 |
|
|
|
|
|
|
|
|
|
|
|
|
|
|
|
|
|
|
|
|
|
|
|
|
|
|
|
|
|
|
|
|
|
|
|
|
|
|
|
|
|
|
|
|
|
|
|
|
|
|
|
|
|
|
|
LIABILITIES AND STOCKHOLDERS' EQUITY |
|
|
|
|
|
|
|
|
|
|
|
|
|
|
|
|
Current liabilities: |
|
|
|
|
|
|
|
|
|
|
|
|
|
|
|
|
Accounts payable |
|
$ |
25,643 |
|
$ |
956 |
|
$ |
427 |
|
$ |
— |
|
$ |
27,026 |
|
Accrued personnel costs |
|
|
13,483 |
|
|
418 |
|
|
35,001 |
|
|
|
|
|
48,902 |
|
Accrued interest |
|
|
|
|
|
|
|
|
18,273 |
|
|
|
|
|
18,273 |
|
Current income taxes |
|
|
23,198 |
|
|
319 |
|
|
|
|
|
(23,149 |
) |
|
368 |
|
Other accrued liabilities |
|
|
36,811 |
|
|
3,006 |
|
|
1,940 |
|
|
|
|
|
41,757 |
|
|
|
|
|
|
|
|
|
|
|
|
|
|
|
|
|
|
|
Total current liabilities |
|
|
99,135 |
|
|
4,699 |
|
|
55,641 |
|
|
(23,149 |
) |
|
136,326 |
|
|
|
|
|
|
|
|
|
|
|
|
|
|
|
|
|
|
|
Long-term liabilities: |
|
|
|
|
|
|
|
|
|
|
|
|
|
|
|
|
Long-term debt, net |
|
|
|
|
|
|
|
|
592,458 |
|
|
|
|
|
592,458 |
|
Income taxes |
|
|
65,133 |
|
|
893 |
|
|
21,802 |
|
|
(64,586 |
) |
|
23,242 |
|
Intercompany accounts and notes |
|
|
191,274 |
|
|
4,061 |
|
|
441,711 |
|
|
(637,046 |
) |
|
— |
|
Other |
|
|
16,167 |
|
|
774 |
|
|
11,645 |
|
|
|
|
|
28,586 |
|
|
|
|
|
|
|
|
|
|
|
|
|
|
|
|
|
|
|
Total long-term liabilities |
|
|
272,574 |
|
|
5,728 |
|
|
1,067,616 |
|
|
(701,632 |
) |
|
644,286 |
|
|
|
|
|
|
|
|
|
|
|
|
|
|
|
|
|
|
|
Total liabilities |
|
|
371,709 |
|
|
10,427 |
|
|
1,123,257 |
|
|
(724,781 |
) |
|
780,612 |
|
|
|
|
|
|
|
|
|
|
|
|
|
|
|
|
|
|
|
Redeemable non-controlling interest in consolidated subsidiary |
|
|
|
|
|
13,252 |
|
|
|
|
|
|
|
|
13,252 |
|
|
|
|
|
|
|
|
|
|
|
|
|
|
|
|
|
|
|
Stockholders' equity: |
|
|
|
|
|
|
|
|
|
|
|
|
|
|
|
|
Common stock |
|
|
|
|
|
|
|
|
74 |
|
|
|
|
|
74 |
|
Capital in excess of par value |
|
|
458,498 |
|
|
60,453 |
|
|
723,824 |
|
|
(519,127 |
) |
|
723,648 |
|
Retained earnings (accumulated deficit) |
|
|
(114,716 |
) |
|
1,916 |
|
|
(620,688 |
) |
|
112,800 |
|
|
(620,688 |
) |
Treasury stock |
|
|
|
|
|
|
|
|
(592 |
) |
|
|
|
|
(592 |
) |
|
|
|
|
|
|
|
|
|
|
|
|
|
|
|
|
|
|
Total stockholders' equity |
|
|
343,782 |
|
|
62,369 |
|
|
102,618 |
|
|
(406,327 |
) |
|
102,442 |
|
|
|
|
|
|
|
|
|
|
|
|
|
|
|
|
|
|
|
Total liabilities and stockholders' equity |
|
$ |
715,491 |
|
$ |
86,048 |
|
$ |
1,225,875 |
|
$ |
(1,131,108 |
) |
$ |
896,306 |
|
|
|
|
|
|
|
|
|
|
|
|
|
|
|
|
|
|
|
|
|
|
|
|
|
|
|
|
|
|
|
|
|
|
|
|
|
|
|
|
|
|
|
|
|
|
|
|
|
|
|
|
|
|
|
F-45
Table of Contents
HEADWATERS INCORPORATED
NOTES TO CONSOLIDATED FINANCIAL STATEMENTS (Continued)
September 30, 2015
15. Condensed Consolidating Financial Information (Continued)
CONDENSED CONSOLIDATING BALANCE SHEET—September 30, 2015
|
|
|
|
|
|
|
|
|
|
|
|
|
|
|
|
|
(in thousands)
|
|
Guarantor
Subsidiaries |
|
Non-
guarantor
Subsidiaries |
|
Parent
Company |
|
Eliminations
and
Reclassifications |
|
Headwaters
Consolidated |
|
ASSETS |
|
|
|
|
|
|
|
|
|
|
|
|
|
|
|
|
Current assets: |
|
|
|
|
|
|
|
|
|
|
|
|
|
|
|
|
Cash and cash equivalents |
|
$ |
25,819 |
|
$ |
3,577 |
|
$ |
113,201 |
|
$ |
— |
|
$ |
142,597 |
|
Trade receivables, net |
|
|
129,095 |
|
|
5,289 |
|
|
|
|
|
|
|
|
134,384 |
|
Inventories |
|
|
52,699 |
|
|
2,375 |
|
|
|
|
|
|
|
|
55,074 |
|
Current and deferred income taxes |
|
|
7,754 |
|
|
3,855 |
|
|
157,832 |
|
|
(145,679 |
) |
|
23,762 |
|
Other |
|
|
10,666 |
|
|
144 |
|
|
1,017 |
|
|
|
|
|
11,827 |
|
|
|
|
|
|
|
|
|
|
|
|
|
|
|
|
|
|
|
Total current assets |
|
|
226,033 |
|
|
15,240 |
|
|
272,050 |
|
|
(145,679 |
) |
|
367,644 |
|
|
|
|
|
|
|
|
|
|
|
|
|
|
|
|
|
|
|
Property, plant and equipment, net |
|
|
164,413 |
|
|
9,978 |
|
|
11,327 |
|
|
— |
|
|
185,718 |
|
|
|
|
|
|
|
|
|
|
|
|
|
|
|
|
|
|
|
Other assets: |
|
|
|
|
|
|
|
|
|
|
|
|
|
|
|
|
Goodwill |
|
|
147,330 |
|
|
30,869 |
|
|
|
|
|
|
|
|
178,199 |
|
Intangible assets, net |
|
|
116,479 |
|
|
27,239 |
|
|
|
|
|
|
|
|
143,718 |
|
Investments in subsidiaries |
|
|
55,844 |
|
|
|
|
|
372,864 |
|
|
(428,708 |
) |
|
— |
|
Intercompany accounts and notes |
|
|
57,793 |
|
|
|
|
|
637,046 |
|
|
(694,839 |
) |
|
— |
|
Deferred income taxes |
|
|
|
|
|
21,349 |
|
|
67,795 |
|
|
(19,725 |
) |
|
69,419 |
|
Other |
|
|
11,243 |
|
|
2,291 |
|
|
20,787 |
|
|
|
|
|
34,321 |
|
|
|
|
|
|
|
|
|
|
|
|
|
|
|
|
|
|
|
Total other assets |
|
|
388,689 |
|
|
81,748 |
|
|
1,098,492 |
|
|
(1,143,272 |
) |
|
425,657 |
|
|
|
|
|
|
|
|
|
|
|
|
|
|
|
|
|
|
|
Total assets |
|
$ |
779,135 |
|
$ |
106,966 |
|
$ |
1,381,869 |
|
$ |
(1,288,951 |
) |
$ |
979,019 |
|
|
|
|
|
|
|
|
|
|
|
|
|
|
|
|
|
|
|
|
|
|
|
|
|
|
|
|
|
|
|
|
|
|
|
|
|
|
|
|
|
|
|
|
|
|
|
|
|
|
|
|
|
|
|
LIABILITIES AND STOCKHOLDERS' EQUITY |
|
|
|
|
|
|
|
|
|
|
|
|
|
|
|
|
Current liabilities: |
|
|
|
|
|
|
|
|
|
|
|
|
|
|
|
|
Accounts payable |
|
$ |
23,619 |
|
$ |
1,114 |
|
$ |
573 |
|
$ |
— |
|
$ |
25,306 |
|
Accrued personnel costs |
|
|
14,542 |
|
|
501 |
|
|
37,501 |
|
|
|
|
|
52,544 |
|
Accrued interest |
|
|
|
|
|
|
|
|
2,295 |
|
|
|
|
|
2,295 |
|
Current and deferred income taxes |
|
|
137,646 |
|
|
5,474 |
|
|
2,559 |
|
|
(145,679 |
) |
|
— |
|
Other accrued liabilities |
|
|
39,604 |
|
|
6,380 |
|
|
3,502 |
|
|
|
|
|
49,486 |
|
Current portion of long-term debt |
|
|
|
|
|
|
|
|
4,250 |
|
|
|
|
|
4,250 |
|
|
|
|
|
|
|
|
|
|
|
|
|
|
|
|
|
|
|
Total current liabilities |
|
|
215,411 |
|
|
13,469 |
|
|
50,680 |
|
|
(145,679 |
) |
|
133,881 |
|
|
|
|
|
|
|
|
|
|
|
|
|
|
|
|
|
|
|
Long-term liabilities: |
|
|
|
|
|
|
|
|
|
|
|
|
|
|
|
|
Long-term debt, net |
|
|
|
|
|
|
|
|
558,080 |
|
|
|
|
|
558,080 |
|
Income taxes |
|
|
22,701 |
|
|
|
|
|
3,614 |
|
|
(19,725 |
) |
|
6,590 |
|
Intercompany accounts and notes |
|
|
|
|
|
178,179 |
|
|
516,660 |
|
|
(694,839 |
) |
|
— |
|
Other |
|
|
1,481 |
|
|
13,897 |
|
|
14,808 |
|
|
|
|
|
30,186 |
|
|
|
|
|
|
|
|
|
|
|
|
|
|
|
|
|
|
|
Total long-term liabilities |
|
|
24,182 |
|
|
192,076 |
|
|
1,093,162 |
|
|
(714,564 |
) |
|
594,856 |
|
|
|
|
|
|
|
|
|
|
|
|
|
|
|
|
|
|
|
Total liabilities |
|
|
239,593 |
|
|
205,545 |
|
|
1,143,842 |
|
|
(860,243 |
) |
|
728,737 |
|
|
|
|
|
|
|
|
|
|
|
|
|
|
|
|
|
|
|
Redeemable non-controlling interest in consolidated subsidiary |
|
|
|
|
|
12,431 |
|
|
|
|
|
|
|
|
12,431 |
|
|
|
|
|
|
|
|
|
|
|
|
|
|
|
|
|
|
|
Stockholders' equity: |
|
|
|
|
|
|
|
|
|
|
|
|
|
|
|
|
Common stock |
|
|
|
|
|
|
|
|
74 |
|
|
|
|
|
74 |
|
Capital in excess of par value |
|
|
486,069 |
|
|
54,470 |
|
|
728,843 |
|
|
(540,715 |
) |
|
728,667 |
|
Retained earnings (accumulated deficit) |
|
|
53,473 |
|
|
(165,480 |
) |
|
(489,889 |
) |
|
112,007 |
|
|
(489,889 |
) |
Treasury stock |
|
|
|
|
|
|
|
|
(1,001 |
) |
|
|
|
|
(1,001 |
) |
|
|
|
|
|
|
|
|
|
|
|
|
|
|
|
|
|
|
Total stockholders' equity |
|
|
539,542 |
|
|
(111,010 |
) |
|
238,027 |
|
|
(428,708 |
) |
|
237,851 |
|
|
|
|
|
|
|
|
|
|
|
|
|
|
|
|
|
|
|
Total liabilities and stockholders' equity |
|
$ |
779,135 |
|
$ |
106,966 |
|
$ |
1,381,869 |
|
$ |
(1,288,951 |
) |
$ |
979,019 |
|
|
|
|
|
|
|
|
|
|
|
|
|
|
|
|
|
|
|
|
|
|
|
|
|
|
|
|
|
|
|
|
|
|
|
|
|
|
|
|
|
|
|
|
|
|
|
|
|
|
|
|
|
|
|
F-46
Table of Contents
HEADWATERS INCORPORATED
NOTES TO CONSOLIDATED FINANCIAL STATEMENTS (Continued)
September 30, 2015
15. Condensed Consolidating Financial Information (Continued)
CONDENSED CONSOLIDATING STATEMENT OF INCOME
Year Ended September 30, 2013
|
|
|
|
|
|
|
|
|
|
|
|
|
|
(in thousands)
|
|
Guarantor
Subsidiaries |
|
Parent
Company |
|
Eliminations |
|
Headwaters
Consolidated |
|
Revenue: |
|
|
|
|
|
|
|
|
|
|
|
|
|
Building products |
|
$ |
394,324 |
|
$ |
— |
|
$ |
— |
|
$ |
394,324 |
|
Construction materials |
|
|
293,000 |
|
|
|
|
|
|
|
|
293,000 |
|
Energy technology |
|
|
15,252 |
|
|
|
|
|
|
|
|
15,252 |
|
|
|
|
|
|
|
|
|
|
|
|
|
|
|
|
Total revenue |
|
|
702,576 |
|
|
— |
|
|
— |
|
|
702,576 |
|
Cost of revenue: |
|
|
|
|
|
|
|
|
|
|
|
|
|
Building products |
|
|
283,128 |
|
|
|
|
|
|
|
|
283,128 |
|
Construction materials |
|
|
219,996 |
|
|
|
|
|
|
|
|
219,996 |
|
Energy technology |
|
|
6,970 |
|
|
|
|
|
|
|
|
6,970 |
|
|
|
|
|
|
|
|
|
|
|
|
|
|
|
|
Total cost of revenue |
|
|
510,094 |
|
|
— |
|
|
— |
|
|
510,094 |
|
|
|
|
|
|
|
|
|
|
|
|
|
|
|
|
Gross profit |
|
|
192,482 |
|
|
— |
|
|
— |
|
|
192,482 |
|
Operating expenses: |
|
|
|
|
|
|
|
|
|
|
|
|
|
Selling, general and administrative |
|
|
96,478 |
|
|
21,363 |
|
|
|
|
|
117,841 |
|
Amortization |
|
|
20,230 |
|
|
|
|
|
|
|
|
20,230 |
|
|
|
|
|
|
|
|
|
|
|
|
|
|
|
|
Total operating expenses |
|
|
116,708 |
|
|
21,363 |
|
|
— |
|
|
138,071 |
|
|
|
|
|
|
|
|
|
|
|
|
|
|
|
|
Operating income (loss) |
|
|
75,774 |
|
|
(21,363 |
) |
|
— |
|
|
54,411 |
|
Other income (expense): |
|
|
|
|
|
|
|
|
|
|
|
|
|
Net interest expense |
|
|
(54 |
) |
|
(42,512 |
) |
|
|
|
|
(42,566 |
) |
Intercompany interest income (expense) |
|
|
(23,434 |
) |
|
23,434 |
|
|
|
|
|
— |
|
Equity in earnings of subsidiaries |
|
|
|
|
|
47,117 |
|
|
(47,117 |
) |
|
— |
|
Other, net |
|
|
329 |
|
|
35 |
|
|
|
|
|
364 |
|
|
|
|
|
|
|
|
|
|
|
|
|
|
|
|
Total other income (expense), net |
|
|
(23,159 |
) |
|
28,074 |
|
|
(47,117 |
) |
|
(42,202 |
) |
|
|
|
|
|
|
|
|
|
|
|
|
|
|
|
Income from continuing operations before income taxes |
|
|
52,615 |
|
|
6,711 |
|
|
(47,117 |
) |
|
12,209 |
|
Income tax benefit (provision) |
|
|
(4,350 |
) |
|
426 |
|
|
|
|
|
(3,924 |
) |
|
|
|
|
|
|
|
|
|
|
|
|
|
|
|
Income from continuing operations |
|
|
48,265 |
|
|
7,137 |
|
|
(47,117 |
) |
|
8,285 |
|
Loss from discontinued operations, net of income taxes |
|
|
(1,148 |
) |
|
|
|
|
|
|
|
(1,148 |
) |
|
|
|
|
|
|
|
|
|
|
|
|
|
|
|
Net income |
|
$ |
47,117 |
|
$ |
7,137 |
|
$ |
(47,117 |
) |
$ |
7,137 |
|
|
|
|
|
|
|
|
|
|
|
|
|
|
|
|
|
|
|
|
|
|
|
|
|
|
|
|
|
|
|
|
|
|
|
|
|
|
|
|
|
|
|
|
|
|
F-47
Table of Contents
HEADWATERS INCORPORATED
NOTES TO CONSOLIDATED FINANCIAL STATEMENTS (Continued)
September 30, 2015
15. Condensed Consolidating Financial Information (Continued)
CONDENSED CONSOLIDATING STATEMENT OF INCOME
Year Ended September 30, 2014
|
|
|
|
|
|
|
|
|
|
|
|
|
|
|
|
|
(in thousands)
|
|
Guarantor
Subsidiaries |
|
Non-
guarantor
Subsidiaries |
|
Parent
Company |
|
Eliminations |
|
Headwaters
Consolidated |
|
Revenue: |
|
|
|
|
|
|
|
|
|
|
|
|
|
|
|
|
Building products |
|
$ |
438,473 |
|
$ |
33,961 |
|
$ |
— |
|
$ |
— |
|
$ |
472,434 |
|
Construction materials |
|
|
309,337 |
|
|
|
|
|
|
|
|
|
|
|
309,337 |
|
Energy technology |
|
|
9,676 |
|
|
|
|
|
|
|
|
|
|
|
9,676 |
|
|
|
|
|
|
|
|
|
|
|
|
|
|
|
|
|
|
|
Total revenue |
|
|
757,486 |
|
|
33,961 |
|
|
— |
|
|
— |
|
|
791,447 |
|
Cost of revenue: |
|
|
|
|
|
|
|
|
|
|
|
|
|
|
|
|
Building products |
|
|
312,220 |
|
|
24,063 |
|
|
|
|
|
|
|
|
336,283 |
|
Construction materials |
|
|
224,888 |
|
|
|
|
|
|
|
|
|
|
|
224,888 |
|
Energy technology |
|
|
4,583 |
|
|
|
|
|
|
|
|
|
|
|
4,583 |
|
|
|
|
|
|
|
|
|
|
|
|
|
|
|
|
|
|
|
Total cost of revenue |
|
|
541,691 |
|
|
24,063 |
|
|
— |
|
|
— |
|
|
565,754 |
|
|
|
|
|
|
|
|
|
|
|
|
|
|
|
|
|
|
|
Gross profit |
|
|
215,795 |
|
|
9,898 |
|
|
— |
|
|
— |
|
|
225,693 |
|
Operating expenses: |
|
|
|
|
|
|
|
|
|
|
|
|
|
|
|
|
Selling, general and
administrative |
|
|
108,602 |
|
|
4,209 |
|
|
24,839 |
|
|
|
|
|
137,650 |
|
Amortization |
|
|
20,231 |
|
|
1,088 |
|
|
|
|
|
|
|
|
21,319 |
|
|
|
|
|
|
|
|
|
|
|
|
|
|
|
|
|
|
|
Total operating expenses |
|
|
128,833 |
|
|
5,297 |
|
|
24,839 |
|
|
— |
|
|
158,969 |
|
|
|
|
|
|
|
|
|
|
|
|
|
|
|
|
|
|
|
Operating income (loss) |
|
|
86,962 |
|
|
4,601 |
|
|
(24,839 |
) |
|
— |
|
|
66,724 |
|
Other income (expense): |
|
|
|
|
|
|
|
|
|
|
|
|
|
|
|
|
Net interest expense |
|
|
(349 |
) |
|
(2 |
) |
|
(45,978 |
) |
|
|
|
|
(46,329 |
) |
Intercompany interest income (expense) |
|
|
(22,737 |
) |
|
|
|
|
22,737 |
|
|
|
|
|
— |
|
Equity in earnings of subsidiaries |
|
|
|
|
|
|
|
|
62,719 |
|
|
(62,719 |
) |
|
— |
|
Other, net |
|
|
(24 |
) |
|
(324 |
) |
|
|
|
|
|
|
|
(348 |
) |
|
|
|
|
|
|
|
|
|
|
|
|
|
|
|
|
|
|
Total other income (expense),
net |
|
|
(23,110 |
) |
|
(326 |
) |
|
39,478 |
|
|
(62,719 |
) |
|
(46,677 |
) |
|
|
|
|
|
|
|
|
|
|
|
|
|
|
|
|
|
|
Income from continuing operations before income taxes |
|
|
63,852 |
|
|
4,275 |
|
|
14,639 |
|
|
(62,719 |
) |
|
20,047 |
|
Income tax benefit (provision) |
|
|
(3,296 |
) |
|
(923 |
) |
|
645 |
|
|
|
|
|
(3,574 |
) |
|
|
|
|
|
|
|
|
|
|
|
|
|
|
|
|
|
|
Income from continuing operations |
|
|
60,556 |
|
|
3,352 |
|
|
15,284 |
|
|
(62,719 |
) |
|
16,473 |
|
Loss from discontinued operations, net of income taxes |
|
|
(415 |
) |
|
|
|
|
|
|
|
|
|
|
(415 |
) |
|
|
|
|
|
|
|
|
|
|
|
|
|
|
|
|
|
|
Net income |
|
|
60,141 |
|
|
3,352 |
|
|
15,284 |
|
|
(62,719 |
) |
|
16,058 |
|
Net income attributable to non-controlling interest |
|
|
|
|
|
(774 |
) |
|
|
|
|
|
|
|
(774 |
) |
|
|
|
|
|
|
|
|
|
|
|
|
|
|
|
|
|
|
Net income attributable to Headwaters Incorporated |
|
$ |
60,141 |
|
$ |
2,578 |
|
$ |
15,284 |
|
$ |
(62,719 |
) |
$ |
15,284 |
|
|
|
|
|
|
|
|
|
|
|
|
|
|
|
|
|
|
|
|
|
|
|
|
|
|
|
|
|
|
|
|
|
|
|
|
|
|
|
|
|
|
|
|
|
|
|
|
|
|
|
|
|
|
|
F-48
Table of Contents
HEADWATERS INCORPORATED
NOTES TO CONSOLIDATED FINANCIAL STATEMENTS (Continued)
September 30, 2015
15. Condensed Consolidating Financial Information (Continued)
CONDENSED CONSOLIDATING STATEMENT OF INCOME
Year Ended September 30, 2015
|
|
|
|
|
|
|
|
|
|
|
|
|
|
|
|
|
(in thousands)
|
|
Guarantor
Subsidiaries |
|
Non-guarantor
Subsidiaries |
|
Parent
Company |
|
Eliminations |
|
Headwaters
Consolidated |
|
Revenue: |
|
|
|
|
|
|
|
|
|
|
|
|
|
|
|
|
Building products |
|
$ |
479,338 |
|
$ |
44,305 |
|
$ |
— |
|
$ |
— |
|
$ |
523,643 |
|
Construction materials |
|
|
352,263 |
|
|
|
|
|
|
|
|
|
|
|
352,263 |
|
Energy technology |
|
|
19,427 |
|
|
|
|
|
|
|
|
|
|
|
19,427 |
|
|
|
|
|
|
|
|
|
|
|
|
|
|
|
|
|
|
|
Total revenue |
|
|
851,028 |
|
|
44,305 |
|
|
— |
|
|
— |
|
|
895,333 |
|
Cost of revenue: |
|
|
|
|
|
|
|
|
|
|
|
|
|
|
|
|
Building products |
|
|
335,516 |
|
|
31,647 |
|
|
|
|
|
|
|
|
367,163 |
|
Construction materials |
|
|
249,077 |
|
|
|
|
|
|
|
|
|
|
|
249,077 |
|
Energy technology |
|
|
9,202 |
|
|
|
|
|
|
|
|
|
|
|
9,202 |
|
|
|
|
|
|
|
|
|
|
|
|
|
|
|
|
|
|
|
Total cost of revenue |
|
|
593,795 |
|
|
31,647 |
|
|
— |
|
|
— |
|
|
625,442 |
|
|
|
|
|
|
|
|
|
|
|
|
|
|
|
|
|
|
|
Gross profit |
|
|
257,233 |
|
|
12,658 |
|
|
— |
|
|
— |
|
|
269,891 |
|
Operating expenses: |
|
|
|
|
|
|
|
|
|
|
|
|
|
|
|
|
Selling, general and administrative |
|
|
115,423 |
|
|
6,174 |
|
|
28,026 |
|
|
|
|
|
149,623 |
|
Amortization |
|
|
16,688 |
|
|
1,473 |
|
|
|
|
|
|
|
|
18,161 |
|
|
|
|
|
|
|
|
|
|
|
|
|
|
|
|
|
|
|
Total operating expenses |
|
|
132,111 |
|
|
7,647 |
|
|
28,026 |
|
|
— |
|
|
167,784 |
|
|
|
|
|
|
|
|
|
|
|
|
|
|
|
|
|
|
|
Operating income (loss) |
|
|
125,122 |
|
|
5,011 |
|
|
(28,026 |
) |
|
— |
|
|
102,107 |
|
Other income (expense): |
|
|
|
|
|
|
|
|
|
|
|
|
|
|
|
|
Net interest expense |
|
|
(205 |
) |
|
|
|
|
(64,014 |
) |
|
|
|
|
(64,219 |
) |
Intercompany interest income (expense) |
|
|
(23,782 |
) |
|
(280 |
) |
|
24,062 |
|
|
|
|
|
— |
|
Equity in earnings of subsidiaries |
|
|
|
|
|
|
|
|
54,350 |
|
|
(54,350 |
) |
|
— |
|
Other, net |
|
|
(56 |
) |
|
(162 |
) |
|
|
|
|
|
|
|
(218 |
) |
|
|
|
|
|
|
|
|
|
|
|
|
|
|
|
|
|
|
Total other income (expense), net |
|
|
(24,043 |
) |
|
(442 |
) |
|
14,398 |
|
|
(54,350 |
) |
|
(64,437 |
) |
|
|
|
|
|
|
|
|
|
|
|
|
|
|
|
|
|
|
Income (loss) from continuing operations before income taxes |
|
|
101,079 |
|
|
4,569 |
|
|
(13,628 |
) |
|
(54,350 |
) |
|
37,670 |
|
Income tax benefit (provision) |
|
|
(48,213 |
) |
|
(1,756 |
) |
|
144,427 |
|
|
|
|
|
94,458 |
|
|
|
|
|
|
|
|
|
|
|
|
|
|
|
|
|
|
|
Income from continuing operations |
|
|
52,866 |
|
|
2,813 |
|
|
130,799 |
|
|
(54,350 |
) |
|
132,128 |
|
Loss from discontinued operations, net of income taxes |
|
|
(67 |
) |
|
(393 |
) |
|
|
|
|
|
|
|
(460 |
) |
|
|
|
|
|
|
|
|
|
|
|
|
|
|
|
|
|
|
Net income |
|
|
52,799 |
|
|
2,420 |
|
|
130,799 |
|
|
(54,350 |
) |
|
131,668 |
|
Net income attributable to non-controlling interest |
|
|
|
|
|
(869 |
) |
|
|
|
|
|
|
|
(869 |
) |
|
|
|
|
|
|
|
|
|
|
|
|
|
|
|
|
|
|
Net income attributable to Headwaters Incorporated |
|
$ |
52,799 |
|
$ |
1,551 |
|
$ |
130,799 |
|
$ |
(54,350 |
) |
$ |
130,799 |
|
|
|
|
|
|
|
|
|
|
|
|
|
|
|
|
|
|
|
|
|
|
|
|
|
|
|
|
|
|
|
|
|
|
|
|
|
|
|
|
|
|
|
|
|
|
|
|
|
|
|
|
|
|
|
F-49
Table of Contents
HEADWATERS INCORPORATED
NOTES TO CONSOLIDATED FINANCIAL STATEMENTS (Continued)
September 30, 2015
15. Condensed Consolidating Financial Information (Continued)
CONDENSED CONSOLIDATING STATEMENT OF CASH FLOWS
Year Ended September 30, 2013
|
|
|
|
|
|
|
|
|
|
|
|
|
|
(in thousands)
|
|
Guarantor
Subsidiaries |
|
Parent
Company |
|
Eliminations |
|
Headwaters
Consolidated |
|
Cash flows from operating activities: |
|
|
|
|
|
|
|
|
|
|
|
|
|
Net income (loss) |
|
$ |
47,117 |
|
$ |
7,137 |
|
$ |
(47,117 |
) |
$ |
7,137 |
|
Adjustments to reconcile net income (loss) to net cash provided by (used in) operating activities: |
|
|
|
|
|
|
|
|
|
|
|
|
|
Depreciation and amortization |
|
|
52,027 |
|
|
290 |
|
|
|
|
|
52,317 |
|
Interest expense related to amortization of debt issue costs and debt discount |
|
|
|
|
|
5,841 |
|
|
|
|
|
5,841 |
|
Stock-based compensation |
|
|
765 |
|
|
938 |
|
|
|
|
|
1,703 |
|
Deferred income taxes |
|
|
698 |
|
|
|
|
|
|
|
|
698 |
|
Net gain on disposition of property, plant and equipment |
|
|
(649 |
) |
|
|
|
|
|
|
|
(649 |
) |
Loss on sale of discontinued operations, net of income taxes |
|
|
55 |
|
|
|
|
|
|
|
|
55 |
|
Equity in earnings of subsidiaries |
|
|
|
|
|
(47,117 |
) |
|
47,117 |
|
|
0 |
|
Increase in trade receivables |
|
|
(5,035 |
) |
|
|
|
|
|
|
|
(5,035 |
) |
Decrease in inventories |
|
|
2,221 |
|
|
|
|
|
|
|
|
2,221 |
|
Increase (decrease) in accounts payable and accrued liabilities |
|
|
(5,637 |
) |
|
1,419 |
|
|
|
|
|
(4,218 |
) |
Other changes in operating assets and liabilities, net |
|
|
31,000 |
|
|
(32,507 |
) |
|
|
|
|
(1,507 |
) |
|
|
|
|
|
|
|
|
|
|
|
|
|
|
|
Net cash provided by (used in) operating activities |
|
|
122,562 |
|
|
(63,999 |
) |
|
— |
|
|
58,563 |
|
|
|
|
|
|
|
|
|
|
|
|
|
|
|
|
Cash flows from investing activities: |
|
|
|
|
|
|
|
|
|
|
|
|
|
Business acquisitions |
|
|
(43,250 |
) |
|
|
|
|
|
|
|
(43,250 |
) |
Purchase of property, plant and equipment |
|
|
(26,940 |
) |
|
(2,179 |
) |
|
|
|
|
(29,119 |
) |
Proceeds from disposition of property, plant and equipment |
|
|
791 |
|
|
|
|
|
|
|
|
791 |
|
Proceeds from sale of discontinued operations |
|
|
4,813 |
|
|
|
|
|
|
|
|
4,813 |
|
Net decrease (increase) in long-term receivables and deposits |
|
|
(1,890 |
) |
|
719 |
|
|
|
|
|
(1,171 |
) |
Net change in other assets |
|
|
(294 |
) |
|
(143 |
) |
|
|
|
|
(437 |
) |
|
|
|
|
|
|
|
|
|
|
|
|
|
|
|
Net cash used in investing activities |
|
|
(66,770 |
) |
|
(1,603 |
) |
|
— |
|
|
(68,373 |
) |
|
|
|
|
|
|
|
|
|
|
|
|
|
|
|
Cash flows from financing activities: |
|
|
|
|
|
|
|
|
|
|
|
|
|
Proceeds from issuance of common stock |
|
|
|
|
|
77,957 |
|
|
|
|
|
77,957 |
|
Payments on long-term debt |
|
|
|
|
|
(47,355 |
) |
|
|
|
|
(47,355 |
) |
Employee stock purchases |
|
|
539 |
|
|
203 |
|
|
|
|
|
742 |
|
Intercompany transfers |
|
|
(29,695 |
) |
|
29,695 |
|
|
|
|
|
0 |
|
|
|
|
|
|
|
|
|
|
|
|
|
|
|
|
Net cash provided by (used in) financing activities |
|
|
(29,156 |
) |
|
60,500 |
|
|
— |
|
|
31,344 |
|
|
|
|
|
|
|
|
|
|
|
|
|
|
|
|
Net increase (decrease) in cash and cash equivalents |
|
|
26,636 |
|
|
(5,102 |
) |
|
— |
|
|
21,534 |
|
Cash and cash equivalents, beginning of year |
|
|
44,111 |
|
|
9,671 |
|
|
|
|
|
53,782 |
|
|
|
|
|
|
|
|
|
|
|
|
|
|
|
|
Cash and cash equivalents, end of year |
|
$ |
70,747 |
|
$ |
4,569 |
|
$ |
— |
|
$ |
75,316 |
|
|
|
|
|
|
|
|
|
|
|
|
|
|
|
|
|
|
|
|
|
|
|
|
|
|
|
|
|
|
|
|
|
|
|
|
|
|
|
|
|
|
|
|
|
|
F-50
Table of Contents
HEADWATERS INCORPORATED
NOTES TO CONSOLIDATED FINANCIAL STATEMENTS (Continued)
September 30, 2015
15. Condensed Consolidating Financial Information (Continued)
CONDENSED CONSOLIDATING STATEMENT OF CASH FLOWS
Year Ended September 30, 2014
|
|
|
|
|
|
|
|
|
|
|
|
|
|
|
|
|
(in thousands)
|
|
Guarantor
Subsidiaries |
|
Non-
guarantor
Subsidiaries |
|
Parent
Company |
|
Eliminations |
|
Headwaters
Consolidated |
|
Cash flows from operating activities: |
|
|
|
|
|
|
|
|
|
|
|
|
|
|
|
|
Net income |
|
$ |
60,141 |
|
$ |
3,352 |
|
$ |
15,284 |
|
$ |
(62,719 |
) |
$ |
16,058 |
|
Adjustments to reconcile net income to net cash provided by (used in) operating activities: |
|
|
|
|
|
|
|
|
|
|
|
|
|
|
|
|
Depreciation and amortization |
|
|
52,716 |
|
|
2,146 |
|
|
272 |
|
|
|
|
|
55,134 |
|
Interest expense related to amortization of debt issue costs and debt discount |
|
|
|
|
|
|
|
|
2,175 |
|
|
|
|
|
2,175 |
|
Stock-based compensation |
|
|
843 |
|
|
|
|
|
1,322 |
|
|
|
|
|
2,165 |
|
Deferred income taxes |
|
|
1,062 |
|
|
604 |
|
|
|
|
|
|
|
|
1,666 |
|
Net loss on disposition of property, plant and equipment |
|
|
44 |
|
|
6 |
|
|
45 |
|
|
|
|
|
95 |
|
Gain on sale of discontinued operations, net of income taxes |
|
|
(2,727 |
) |
|
|
|
|
|
|
|
|
|
|
(2,727 |
) |
Asset impairments |
|
|
1,815 |
|
|
|
|
|
|
|
|
|
|
|
1,815 |
|
Net loss of unconsolidated joint ventures |
|
|
|
|
|
529 |
|
|
|
|
|
|
|
|
529 |
|
Equity in earnings of subsidiaries |
|
|
|
|
|
|
|
|
(62,719 |
) |
|
62,719 |
|
|
0 |
|
Decrease (increase) in trade receivables |
|
|
(90 |
) |
|
607 |
|
|
|
|
|
|
|
|
517 |
|
Decrease (increase) in inventories |
|
|
(3,927 |
) |
|
1,580 |
|
|
|
|
|
|
|
|
(2,347 |
) |
Increase (decrease) in accounts payable and accrued liabilities |
|
|
(17,364 |
) |
|
828 |
|
|
3,311 |
|
|
|
|
|
(13,225 |
) |
Other changes in operating assets and liabilities, net |
|
|
33,349 |
|
|
129 |
|
|
(34,956 |
) |
|
|
|
|
(1,478 |
) |
|
|
|
|
|
|
|
|
|
|
|
|
|
|
|
|
|
|
Net cash provided by (used in) operating activities |
|
|
125,862 |
|
|
9,781 |
|
|
(75,266 |
) |
|
— |
|
|
60,377 |
|
|
|
|
|
|
|
|
|
|
|
|
|
|
|
|
|
|
|
Cash flows from investing activities: |
|
|
|
|
|
|
|
|
|
|
|
|
|
|
|
|
Business acquisitions |
|
|
(10,500 |
) |
|
|
|
|
(85,104 |
) |
|
|
|
|
(95,604 |
) |
Investments in unconsolidated joint ventures |
|
|
|
|
|
(1,875 |
) |
|
|
|
|
|
|
|
(1,875 |
) |
Purchase of property, plant and equipment |
|
|
(30,672 |
) |
|
(829 |
) |
|
(4,298 |
) |
|
|
|
|
(35,799 |
) |
Proceeds from disposition of property, plant and equipment |
|
|
905 |
|
|
|
|
|
|
|
|
|
|
|
905 |
|
Proceeds from sale of discontinued operations |
|
|
4,666 |
|
|
|
|
|
|
|
|
|
|
|
4,666 |
|
Net decrease in long-term receivables and deposits |
|
|
7,145 |
|
|
|
|
|
300 |
|
|
|
|
|
7,445 |
|
Net change in other assets |
|
|
(2,275 |
) |
|
|
|
|
719 |
|
|
|
|
|
(1,556 |
) |
|
|
|
|
|
|
|
|
|
|
|
|
|
|
|
|
|
|
Net cash used in investing activities |
|
|
(30,731 |
) |
|
(2,704 |
) |
|
(88,383 |
) |
|
— |
|
|
(121,818 |
) |
|
|
|
|
|
|
|
|
|
|
|
|
|
|
|
|
|
|
Cash flows from financing activities: |
|
|
|
|
|
|
|
|
|
|
|
|
|
|
|
|
Net proceeds from issuance of long-term debt |
|
|
|
|
|
|
|
|
146,650 |
|
|
|
|
|
146,650 |
|
Payments on long-term debt |
|
|
|
|
|
|
|
|
(7,792 |
) |
|
|
|
|
(7,792 |
) |
Dividends paid to non-controlling interest in consolidated subsidiary |
|
|
|
|
|
(950 |
) |
|
|
|
|
|
|
|
(950 |
) |
Employee stock purchases |
|
|
580 |
|
|
|
|
|
179 |
|
|
|
|
|
759 |
|
Intercompany transfers |
|
|
(132,872 |
) |
|
(397 |
) |
|
133,269 |
|
|
|
|
|
0 |
|
|
|
|
|
|
|
|
|
|
|
|
|
|
|
|
|
|
|
Net cash provided by (used in) financing activities |
|
|
(132,292 |
) |
|
(1,347 |
) |
|
272,306 |
|
|
— |
|
|
138,667 |
|
|
|
|
|
|
|
|
|
|
|
|
|
|
|
|
|
|
|
Net increase (decrease) in cash and cash equivalents |
|
|
(37,161 |
) |
|
5,730 |
|
|
108,657 |
|
|
— |
|
|
77,226 |
|
Cash and cash equivalents, beginning of year |
|
|
70,713 |
|
|
34 |
|
|
4,569 |
|
|
|
|
|
75,316 |
|
|
|
|
|
|
|
|
|
|
|
|
|
|
|
|
|
|
|
Cash and cash equivalents, end of year |
|
$ |
33,552 |
|
$ |
5,764 |
|
$ |
113,226 |
|
$ |
— |
|
$ |
152,542 |
|
|
|
|
|
|
|
|
|
|
|
|
|
|
|
|
|
|
|
|
|
|
|
|
|
|
|
|
|
|
|
|
|
|
|
|
|
|
|
|
|
|
|
|
|
|
|
|
|
|
|
|
|
|
|
F-51
Table of Contents
HEADWATERS INCORPORATED
NOTES TO CONSOLIDATED FINANCIAL STATEMENTS (Continued)
September 30, 2015
15. Condensed Consolidating Financial Information (Continued)
CONDENSED CONSOLIDATING STATEMENT OF CASH FLOWS
Year Ended September 30, 2015
|
|
|
|
|
|
|
|
|
|
|
|
|
|
|
|
|
(in thousands)
|
|
Guarantor
Subsidiaries |
|
Non-guarantor
Subsidiaries |
|
Parent
Company |
|
Eliminations |
|
Headwaters
Consolidated |
|
Cash flows from operating activities: |
|
|
|
|
|
|
|
|
|
|
|
|
|
|
|
|
Net income |
|
$ |
52,799 |
|
$ |
2,420 |
|
$ |
130,799 |
|
$ |
(54,350 |
) |
$ |
131,668 |
|
Adjustments to reconcile net income to net cash provided by (used in) operating activities: |
|
|
|
|
|
|
|
|
|
|
|
|
|
|
|
|
Depreciation and amortization |
|
|
50,538 |
|
|
2,922 |
|
|
513 |
|
|
|
|
|
53,973 |
|
Interest expense related to amortization of debt issue costs and debt discount |
|
|
|
|
|
|
|
|
6,180 |
|
|
|
|
|
6,180 |
|
Stock-based compensation |
|
|
1,014 |
|
|
|
|
|
1,812 |
|
|
|
|
|
2,826 |
|
Deferred income taxes |
|
|
7,850 |
|
|
(25,808 |
) |
|
(78,784 |
) |
|
|
|
|
(96,742 |
) |
Tax benefit from exercise of stock appreciation rights and vesting of restricted stock |
|
|
|
|
|
(965 |
) |
|
(578 |
) |
|
|
|
|
(1,543 |
) |
Net loss (gain) on disposition of property, plant and equipment |
|
|
(70 |
) |
|
119 |
|
|
|
|
|
|
|
|
49 |
|
Loss on sale of discontinued operations, net of income taxes |
|
|
45 |
|
|
184 |
|
|
|
|
|
|
|
|
229 |
|
Net loss of unconsolidated joint ventures |
|
|
|
|
|
262 |
|
|
|
|
|
|
|
|
262 |
|
Equity in earnings of subsidiaries |
|
|
|
|
|
|
|
|
(54,350 |
) |
|
54,350 |
|
|
0 |
|
Decrease (increase) in trade receivables |
|
|
(14,295 |
) |
|
101 |
|
|
|
|
|
|
|
|
(14,194 |
) |
Increase in inventories |
|
|
(783 |
) |
|
(224 |
) |
|
|
|
|
|
|
|
(1,007 |
) |
Increase (decrease) in accounts payable and accrued liabilities |
|
|
(2,147 |
) |
|
3,519 |
|
|
(12,929 |
) |
|
|
|
|
(11,557 |
) |
Other changes in operating assets and liabilities, net |
|
|
41,907 |
|
|
17,832 |
|
|
(66,495 |
) |
|
|
|
|
(6,756 |
) |
|
|
|
|
|
|
|
|
|
|
|
|
|
|
|
|
|
|
Net cash provided by (used in) operating activities |
|
|
136,858 |
|
|
362 |
|
|
(73,832 |
) |
|
— |
|
|
63,388 |
|
|
|
|
|
|
|
|
|
|
|
|
|
|
|
|
|
|
|
Cash flows from investing activities: |
|
|
|
|
|
|
|
|
|
|
|
|
|
|
|
|
Business acquisitions |
|
|
(5,650 |
) |
|
|
|
|
|
|
|
|
|
|
(5,650 |
) |
Investment in unconsolidated joint venture |
|
|
(125 |
) |
|
|
|
|
|
|
|
|
|
|
(125 |
) |
Purchase of property, plant and equipment |
|
|
(30,972 |
) |
|
(662 |
) |
|
(5,225 |
) |
|
|
|
|
(36,859 |
) |
Proceeds from disposition of property, plant and equipment |
|
|
906 |
|
|
9 |
|
|
|
|
|
|
|
|
915 |
|
Net decrease in long-term receivables and deposits |
|
|
2,382 |
|
|
|
|
|
1,068 |
|
|
|
|
|
3,450 |
|
Net change in other assets |
|
|
(718 |
) |
|
|
|
|
121 |
|
|
|
|
|
(597 |
) |
|
|
|
|
|
|
|
|
|
|
|
|
|
|
|
|
|
|
Net cash used in investing activities |
|
|
(34,177 |
) |
|
(653 |
) |
|
(4,036 |
) |
|
— |
|
|
(38,866 |
) |
|
|
|
|
|
|
|
|
|
|
|
|
|
|
|
|
|
|
Cash flows from financing activities: |
|
|
|
|
|
|
|
|
|
|
|
|
|
|
|
|
Net proceeds from issuance of long-term debt |
|
|
|
|
|
|
|
|
414,675 |
|
|
|
|
|
414,675 |
|
Payments on long-term debt |
|
|
|
|
|
|
|
|
(449,799 |
) |
|
|
|
|
(449,799 |
) |
Dividends paid to non-controlling interest in consolidated subsidiary |
|
|
|
|
|
(1,690 |
) |
|
|
|
|
|
|
|
(1,690 |
) |
Employee stock purchases |
|
|
583 |
|
|
45 |
|
|
176 |
|
|
|
|
|
804 |
|
Tax benefit from exercise of stock appreciation rights and vesting of restricted stock |
|
|
|
|
|
965 |
|
|
578 |
|
|
|
|
|
1,543 |
|
Intercompany transfers |
|
|
(110,997 |
) |
|
(1,216 |
) |
|
112,213 |
|
|
|
|
|
0 |
|
|
|
|
|
|
|
|
|
|
|
|
|
|
|
|
|
|
|
Net cash provided by (used in) financing activities |
|
|
(110,414 |
) |
|
(1,896 |
) |
|
77,843 |
|
|
— |
|
|
(34,467 |
) |
|
|
|
|
|
|
|
|
|
|
|
|
|
|
|
|
|
|
Net decrease in cash and cash equivalents |
|
|
(7,733 |
) |
|
(2,187 |
) |
|
(25 |
) |
|
— |
|
|
(9,945 |
) |
Cash and cash equivalents, beginning of year |
|
|
33,552 |
|
|
5,764 |
|
|
113,226 |
|
|
|
|
|
152,542 |
|
|
|
|
|
|
|
|
|
|
|
|
|
|
|
|
|
|
|
Cash and cash equivalents, end of year |
|
$ |
25,819 |
|
$ |
3,577 |
|
$ |
113,201 |
|
$ |
— |
|
$ |
142,597 |
|
|
|
|
|
|
|
|
|
|
|
|
|
|
|
|
|
|
|
|
|
|
|
|
|
|
|
|
|
|
|
|
|
|
|
|
|
|
|
|
|
|
|
|
|
|
|
|
|
|
|
|
|
|
|
F-52
Table of Contents
HEADWATERS INCORPORATED
NOTES TO CONSOLIDATED FINANCIAL STATEMENTS (Continued)
September 30, 2015
16. Quarterly Financial Data (unaudited)
Summarized unaudited quarterly financial data for 2014 and 2015 is as follows.
|
|
|
|
|
|
|
|
|
|
|
|
|
|
|
|
|
|
|
2014(1)(2) |
|
(in thousands, except per-share amounts)
|
|
First
quarter |
|
Second
quarter |
|
Third
quarter |
|
Fourth
quarter |
|
Full year |
|
Net revenue |
|
$ |
165,615 |
|
$ |
156,512 |
|
$ |
223,399 |
|
$ |
245,921 |
|
$ |
791,447 |
|
Gross profit |
|
|
40,893 |
|
|
38,551 |
|
|
67,672 |
|
|
78,577 |
|
|
225,693 |
|
Net income (loss)(3) |
|
|
(1,434 |
) |
|
(10,082 |
) |
|
10,893 |
|
|
16,681 |
|
|
16,058 |
|
Basic and diluted earnings (loss) per share(5) |
|
|
(0.02 |
) |
|
(0.14 |
) |
|
0.14 |
|
|
0.22 |
|
|
0.20 |
|
|
|
|
|
|
|
|
|
|
|
|
|
|
|
|
|
|
|
|
2015(1)(2) |
|
(in thousands, except per-share amounts)
|
|
First
quarter |
|
Second
quarter |
|
Third
quarter |
|
Fourth
quarter |
|
Full year |
|
Net revenue |
|
$ |
199,597 |
|
$ |
179,725 |
|
$ |
243,294 |
|
$ |
272,717 |
|
$ |
895,333 |
|
Gross profit |
|
|
55,687 |
|
|
47,141 |
|
|
76,762 |
|
|
90,301 |
|
|
269,891 |
|
Net income (loss)(3)(4) |
|
|
7,084 |
|
|
(25,198 |
) |
|
23,008 |
|
|
126,774 |
|
|
131,668 |
|
Basic earnings (loss) per share(5) |
|
|
0.09 |
|
|
(0.34 |
) |
|
0.30 |
|
|
1.72 |
|
|
1.78 |
|
Diluted earnings (loss) per share(5) |
|
|
0.09 |
|
|
(0.34 |
) |
|
0.30 |
|
|
1.68 |
|
|
1.73 |
|
- (1)
- Headwaters'
revenue is seasonal, typically with higher revenues in the third and fourth quarters of the fiscal year than in the first and second quarters.
As a result, profitability is also usually higher in the last half of the fiscal year than in the first half of the year.
- (2)
- As
described in Note 4, Headwaters acquired several businesses during 2014 and 2015 and these acquisitions have affected to a certain extent the
comparability of the above information.
- (3)
- As
described in Note 10, during 2014 and through the June 2015 quarter, Headwaters recorded a full valuation allowance on its net amortizable
deferred tax assets and recorded income tax expense due to the combination of recognizing benefit for deferred tax assets only to the extent of projected fiscal year earnings, plus state income taxes
in certain state jurisdictions. In the September 2015 quarter, Headwaters released a majority of the valuation allowance on NOL and tax credit carryforwards and certain other deferred tax assets.
Approximately $96.8 million of the release represents a non-routine income tax benefit, which when combined with the 2015 utilization of $12.5 million, resulted in a total change in the
valuation allowance of $109.3 million recorded in the year.
- (4)
- As
described in Note 8, in the March 2015 quarter Headwaters incurred approximately $24.8 million of non-routine extinguishment loss related
to early repayments of debt.
- (5)
- In
accordance with ASC Topic 260 Earnings Per Share, EPS is computed independently for each of the four quarters in a fiscal year. The basic and diluted EPS
computed for certain years may not equal the sum of the four quarterly computations due to the combination of profitable quarters and loss quarters and / or rounding conventions.
F-53
Table of Contents

[FSC
LOGO HERE]
QuickLinks
-- Click here to rapidly navigate through this document
Exhibit 12
Ratio of Earnings to Combined Fixed Charges and Preferred Stock Dividends
|
|
|
|
|
|
|
|
|
|
|
|
|
|
|
|
|
|
|
Year Ended September 30, |
|
(dollars in thousands)
|
|
2011 |
|
2012** |
|
2013 |
|
2014 |
|
2015 |
|
Fixed Charges Computation |
|
|
|
|
|
|
|
|
|
|
|
|
|
|
|
|
Interest expensed and capitalized(1) |
|
$ |
106,557 |
|
$ |
38,809 |
|
$ |
37,100 |
|
$ |
44,768 |
|
$ |
58,681 |
|
Amortized premiums, discounts, and capitalized expenses related to
indebtedness |
|
|
20,069 |
|
|
14,184 |
|
|
5,841 |
|
|
2,175 |
|
|
6,179 |
|
Reasonable approximation of interest within rental
expense |
|
|
3,323 |
|
|
3,106 |
|
|
3,454 |
|
|
3,342 |
|
|
3,437 |
|
|
|
|
|
|
|
|
|
|
|
|
|
|
|
|
|
|
|
Total Fixed Charges and Preferred Equity Dividends |
|
$ |
129,949 |
|
$ |
56,099 |
|
$ |
46,395 |
|
$ |
50,285 |
|
$ |
68,297 |
|
|
|
|
|
|
|
|
|
|
|
|
|
|
|
|
|
|
|
|
|
|
|
|
|
|
|
|
|
|
|
|
|
|
|
|
|
|
|
|
|
|
|
|
|
|
|
|
|
|
|
|
|
|
|
Earnings Computation |
|
|
|
|
|
|
|
|
|
|
|
|
|
|
|
|
Pre-tax income from continuing operations before adjustment for minority interests in consolidated subsidiaries or income or loss from equity
investees |
|
$ |
(138,093 |
) |
$ |
(16,454 |
) |
$ |
12,209 |
|
$ |
20,576 |
|
$ |
37,932 |
|
Plus |
|
|
|
|
|
|
|
|
|
|
|
|
|
|
|
|
Fixed charges |
|
|
129,949 |
|
|
56,099 |
|
|
46,395 |
|
|
50,285 |
|
|
68,297 |
|
Minus |
|
|
|
|
|
|
|
|
|
|
|
|
|
|
|
|
Interest capitalized |
|
|
91 |
|
|
137 |
|
|
192 |
|
|
427 |
|
|
585 |
|
|
|
|
|
|
|
|
|
|
|
|
|
|
|
|
|
|
|
Total Earnings |
|
$ |
(8,235 |
) |
$ |
39,508 |
|
$ |
58,412 |
|
$ |
70,434 |
|
$ |
105,644 |
|
|
|
|
|
|
|
|
|
|
|
|
|
|
|
|
|
|
|
|
|
|
|
|
|
|
|
|
|
|
|
|
|
|
|
|
|
|
|
|
|
|
|
|
|
|
|
|
|
|
|
|
|
|
|
Ratio of Earnings to Combined Fixed Charges and Preferred Stock Dividends |
|
|
N/A |
* |
|
0.70 |
|
|
1.26 |
|
|
1.40 |
|
|
1.55 |
|
- *
- Total
earnings for this period were less than zero dollars. The deficiency of earnings to fixed charges for the year ended September 30, 2011 was
$138.2 million.
- **
- The
deficiency of earnings to fixed charges for the year ended September 30, 2012 was $16.6 million.
- (1)
- Interest
expense associated with unrecognized tax benefits is included in income tax expense, not with interest expense.
QuickLinks
QuickLinks
-- Click here to rapidly navigate through this document
Exhibit 21
|
| Headwaters Incorporated Subsidiaries |
Allmet Roof Products, Ltd., a British Columbia, Canada corporation |
| Atlantic Shutter Systems, Inc., a South Carolina corporation |
| Chihuahua Stone LLC, a Utah limited liability company |
| Covol Engineered Fuels, LC, a Utah limited liability company |
| Covol Fuels No. 2, LLC, a Utah limited liability company |
| Covol Fuels No. 4, LLC, a Utah limited liability company |
| Covol Fuels No. 5, LLC, a Utah limited liability company |
| Covol Fuels Alabama No. 3, LLC, a Utah limited liability company |
| Covol Fuels Alabama No. 4, LLC, a Utah limited liability company |
| Covol Fuels Alabama No. 5, LLC, a Utah limited liability company |
| Covol Fuels Alabama No. 7, LLC, a Utah limited liability company |
| Covol Fuels Rock Crusher, LLC, a Utah limited liability company |
| Covol Fuels Chinook, LLC, a Utah limited liability company |
| Dutch Quality Stone, Inc., an Ohio corporation |
| Eldorado SC-Acquisition Co., a Utah corporation |
| Eldorado Stone Acquisition Co., LLC, a Utah limited liability company |
| Eldorado Stone Funding Co., LLC, a Utah limited liability company |
| Eldorado Stone LLC, a Delaware limited liability company |
| Eldorado Stone Operations LLC, a Utah limited liability company |
| Eldorado Stone Philippines, Inc., a Philippines corporation (99% ownership) |
| Entegra Holdings, LLC, a Utah limited liability company |
| Entegra Roof Tile, LLC, a Delaware limited liability company (80% ownership) |
| FlexCrete Building Systems, LC, a Utah limited liability company |
| Gerard Roof Products, LLC, a Utah liability company |
| HCM Stone, LLC, a Utah limited liability company |
| HCM Louisiana, LLC, a Utah limited liability company |
| HCM Utah, LLC, a Utah limited liability company |
| Headwaters CM Services, LLC, a Utah limited liability company |
| Headwaters CTL, LLC, a Utah limited liability company |
| Headwaters Construction Materials, LLC, a Texas limited liability company |
| Headwaters Construction Materials, Inc., a Utah corporation |
| Headwaters Energy Services Corp., a Utah corporation |
| Headwaters Heavy Oil, LLC, a Utah limited liability company |
| Headwaters Plant Services, Inc., a Utah corporation |
| Headwaters Resources, Inc., a Utah corporation |
| Headwaters Resources Limited, a New Brunswick, Canada corporation |
| Headwaters Services Corporation, a Utah corporation |
| Headwaters Technology Innovation Group, Inc., a Utah corporation |
| L-B Stone LLC, a Utah limited liability company |
| Piedras Headwaters, S. de RL de CV, a Mexican limited liability variable stock company |
| Quarry Stone, LLC, a Utah limited liability company |
| Stonecraft Manufacturing, LLC, an Ohio limited liability company |
| T&S Newco, LLC, a Delaware limited liability company (40% ownership) |
| Tapco Europe Limited, a United Kingdom corporation |
| Tapco International Corporation, a Michigan corporation |
QuickLinks
QuickLinks
-- Click here to rapidly navigate through this document
Exhibit 23
Consent of Independent Registered Public Accounting Firm
Headwaters
Incorporated
South Jordan, Utah
We
hereby consent to the incorporation by reference in the Registration Statements on Form S-3 (File No. 333-206082), Form S-4 (File No. 333-193756), and
Form S-8 (File Nos. 333-39676, 333-39678, 333-103527, 333-113704, 333-124803, 333-147599, 333-163274, 333-166504, 333-166505, 333-181060 and 333-181061) of Headwaters Incorporated of our
reports dated November 17, 2015, relating to the consolidated financial statements and the effectiveness of Headwaters Incorporated's internal control over financial reporting which appear in
this Annual Report on Form 10-K.
/s/
BDO USA, LLP
Costa Mesa, California
November 17, 2015
QuickLinks
Consent of Independent Registered Public Accounting Firm
QuickLinks
-- Click here to rapidly navigate through this document
Exhibit 31.1
CERTIFICATION OF CHIEF EXECUTIVE OFFICER
I,
Kirk A. Benson, certify that:
- 1.
- I
have reviewed this Annual Report on Form 10-K of the registrant;
- 2.
- Based
on my knowledge, this report does not contain any untrue statement of a material fact or omit to state a material fact necessary to make the statements
made, in light of the circumstances under which such statements were made, not misleading with respect to the period covered by this report;
- 3.
- Based
on my knowledge, the financial statements, and other financial information included in this report, fairly present in all material respects the
financial condition, results of operations and cash flows of the registrant as of, and for, the periods presented in this report;
- 4.
- The
registrant's other certifying officer and I are responsible for establishing and maintaining disclosure controls and procedures (as defined in Exchange
Act Rules 13a-15(e) and 15d-15(e)) and internal control over financial reporting (as defined in Exchange Act Rules 13a-15(f) and 15d-15(f)) for the registrant and
have:
- a)
- Designed
such disclosure controls and procedures, or caused such disclosure controls and procedures to be designed under our supervision, to ensure that
material information relating to the registrant, including its consolidated subsidiaries, is made known to us by others within those entities, particularly during the period in which this report is
being prepared;
- b)
- Designed
such internal control over financial reporting, or caused such internal control over financial reporting to be designed under our supervision, to
provide reasonable assurance regarding the reliability of financial reporting and the preparation of financial statements for external purposes in accordance with generally accepted accounting
principles;
- c)
- Evaluated
the effectiveness of the registrant's disclosure controls and procedures and presented in this report our conclusions about the effectiveness of
the disclosure controls and procedures, as of the end of the period covered by this report based on such evaluation; and
- d)
- Disclosed
in this report any change in the registrant's internal control over financial reporting that occurred during the registrant's fourth fiscal quarter
that has materially affected, or is reasonably likely to materially affect, the registrant's internal control over financial reporting; and
- 5.
- The
registrant's other certifying officer and I have disclosed, based on our most recent evaluation of internal control over financial reporting, to the
registrant's auditors and the audit committee of the registrant's board of directors (or persons performing the equivalent functions):
- a)
- All
significant deficiencies and material weaknesses in the design or operation of internal control over financial reporting which are reasonably likely to
adversely affect the registrant's ability to record, process, summarize and report financial information; and
- b)
- Any
fraud, whether or not material, that involves management or other employees who have a significant role in the registrant's internal control over
financial reporting.
|
|
|
| Date: November 17, 2015 |
|
|
/s/ KIRK A. BENSON
Kirk A. Benson
Chief Executive Officer |
|
|
QuickLinks
CERTIFICATION OF CHIEF EXECUTIVE OFFICER
QuickLinks
-- Click here to rapidly navigate through this document
Exhibit 31.2
CERTIFICATION OF CHIEF FINANCIAL OFFICER
I,
Donald P. Newman, certify that:
- 1.
- I
have reviewed this Annual Report on Form 10-K of the registrant;
- 2.
- Based
on my knowledge, this report does not contain any untrue statement of a material fact or omit to state a material fact necessary to make the statements
made, in light of the circumstances under which such statements were made, not misleading with respect to the period covered by this report;
- 3.
- Based
on my knowledge, the financial statements, and other financial information included in this report, fairly present in all material respects the
financial condition, results of operations and cash flows of the registrant as of, and for, the periods presented in this report;
- 4.
- The
registrant's other certifying officer and I are responsible for establishing and maintaining disclosure controls and procedures (as defined in Exchange
Act Rules 13a-15(e) and 15d-15(e)) and internal control over financial reporting (as defined in Exchange Act Rules 13a-15(f) and 15d-15(f)) for the registrant and
have:
- a)
- Designed
such disclosure controls and procedures, or caused such disclosure controls and procedures to be designed under our supervision, to ensure that
material information relating to the registrant, including its consolidated subsidiaries, is made known to us by others within those entities, particularly during the period in which this report is
being prepared;
- b)
- Designed
such internal control over financial reporting, or caused such internal control over financial reporting to be designed under our supervision, to
provide reasonable assurance regarding the reliability of financial reporting and the preparation of financial statements for external purposes in accordance with generally accepted accounting
principles;
- c)
- Evaluated
the effectiveness of the registrant's disclosure controls and procedures and presented in this report our conclusions about the effectiveness of
the disclosure controls and procedures, as of the end of the period covered by this report based on such evaluation; and
- d)
- Disclosed
in this report any change in the registrant's internal control over financial reporting that occurred during the registrant's fourth fiscal quarter
that has materially affected, or is reasonably likely to materially affect, the registrant's internal control over financial reporting; and
- 5.
- The
registrant's other certifying officer and I have disclosed, based on our most recent evaluation of internal control over financial reporting, to the
registrant's auditors and the audit committee of the registrant's board of directors (or persons performing the equivalent functions):
- a)
- All
significant deficiencies and material weaknesses in the design or operation of internal control over financial reporting which are reasonably likely to
adversely affect the registrant's ability to record, process, summarize and report financial information; and
- b)
- Any
fraud, whether or not material, that involves management or other employees who have a significant role in the registrant's internal control over
financial reporting.
|
|
|
| Date: November 17, 2015 |
|
|
/s/ DONALD P. NEWMAN
Donald P. Newman
Chief Financial Officer |
|
|
QuickLinks
CERTIFICATION OF CHIEF FINANCIAL OFFICER
QuickLinks
-- Click here to rapidly navigate through this document
Exhibit 32
CERTIFICATIONS PURSUANT TO
18 U.S.C. SECTION 1350,
AS ADOPTED PURSUANT TO
SECTION 906 OF THE SARBANES-OXLEY ACT OF 2002
In connection with the filing of the Annual Report of Headwaters Incorporated (the "Company") on Form 10-K for the year ended
September 30, 2015 (the "Report"), we, Kirk A. Benson, Chief Executive Officer of the Company, and Donald P. Newman, Chief Financial Officer of the Company, certify, pursuant to 18 U.S.C.
§ 1350, as adopted pursuant to § 906 of the Sarbanes-Oxley Act of 2002, that:
(i) The
Report fully complies with the requirements of section 13(a) of the Securities Exchange Act of 1934; and
(ii) The
information contained in the Report fairly presents, in all material respects, the financial condition and results of operations of the Company.
|
|
|
/s/ KIRK A. BENSON
Kirk A. Benson
Chief Executive Officer
November 17, 2015 |
|
|
/s/ DONALD P. NEWMAN
Donald P. Newman
Chief Financial Officer
November 17, 2015 |
|
|
QuickLinks
CERTIFICATIONS PURSUANT TO 18 U.S.C. SECTION 1350, AS ADOPTED PURSUANT TO SECTION 906 OF THE SARBANES-OXLEY ACT OF 2002
QuickLinks
-- Click here to rapidly navigate through this document
Exhibit 95
Mine Safety Disclosure
Under the Dodd-Frank Act, each operator of a coal or other mine (and operators of facilities related to mining, as defined in
section 3 of the Mine Act) is required to include certain mine safety results in its periodic reports filed with the SEC. The following information is presented for each coal reclamation site
operated by Headwaters Energy Services Corp. or its subsidiaries, for the 3-month period and the 12-month period ended September 30, 2015 as reflected in the mine data retrieval system
maintained by MSHA:
- •
- Section 104 Violations. The total number of
violations of mandatory health or safety standards that could significantly and substantially contribute to the cause and effect of a coal or other mine safety or health hazard under
section 104 of the Mine Act for which the operator received a citation from MSHA;
- •
- Section 104(b) Orders. The total number of orders
issued under section 104(b) of the Mine Act, which represents a failure to abate a violation under section 104 within the period of time prescribed by MSHA;
- •
- Section 104(d) Citations and Orders. The total
number of citations and orders for unwarrantable failure of the mine operator to comply with mandatory health or safety standards under section 104(d) of the Mine Act;
- •
- Section 110(b)(2) Flagrant Violations. The total
number of flagrant violations under section 110(b)(2) of the Mine Act.
- •
- Section 107(a) Imminent Danger Orders. The total
number of imminent danger orders issued under section 107(a) of the Mine Act;
- •
- Proposed MSHA Assessments. The total dollar value of
proposed assessments from MSHA under the Mine Act; and
- •
- Fatalities. The total number of mining-related
fatalities.
|
|
|
|
|
|
|
|
|
|
|
|
|
|
|
|
|
|
|
|
|
|
|
|
|
For the 3-month period ended September 30, 2015 |
|
Operation
|
|
Section 104
Significant
and
Substantial
Violations |
|
Section 104(b)
Orders |
|
Section 104(d)
Unwarrantable
Failure
Citations/
Orders |
|
Section 110(b)(2)
Flagrant
Violations |
|
Section 107(a)
Imminent
Danger
Orders |
|
Total Dollar
Value of
Proposed
MSHA
Assessments(1) |
|
Fatalities |
|
Minuteman (Greenville, KY) |
|
|
0 |
|
|
0 |
|
|
0 |
|
|
0 |
|
|
0 |
|
|
0 |
|
|
0 |
|
Rock Crusher (Greenville, KY) |
|
|
0 |
|
|
0 |
|
|
0 |
|
|
0 |
|
|
0 |
|
|
0 |
|
|
0 |
|
|
|
|
|
|
|
|
|
|
|
|
|
|
|
|
|
|
|
|
|
|
|
|
|
|
For the 12-month period ended September 30, 2015 |
|
Operation
|
|
Section 104
Significant
and
Substantial
Violations |
|
Section 104(b)
Orders |
|
Section 104(d)
Unwarrantable
Failure
Citations/
Orders |
|
Section 110(b)(2)
Flagrant
Violations |
|
Section 107(a)
Imminent
Danger
Orders |
|
Total Dollar
Value of
Proposed
MSHA
Assessments(1) |
|
Fatalities |
|
Minuteman (Greenville, KY) |
|
|
0 |
|
|
0 |
|
|
0 |
|
|
0 |
|
|
0 |
|
|
0 |
|
|
0 |
|
Rock Crusher (Greenville, KY) |
|
|
0 |
|
|
0 |
|
|
0 |
|
|
0 |
|
|
0 |
|
|
0 |
|
|
0 |
|
- (1)
- Amounts
included are the total dollar value of proposed or outstanding assessments received from MSHA on or before November 10, 2015 regardless of
whether the assessment has been challenged or appealed, for citations and orders occurring during the 3-month period and the 12-month period ended June 30, 2015.
Pattern or Potential Pattern of Violations. For the 3-month period and the 12-month period ended September 30, 2015, none of our
operations
received written notice from MSHA of (i) a pattern of
violations
of mandatory health or safety standards that are of such nature as could have significantly and substantially contributed to the cause and effect of coal or other mine health or safety
hazards under section 104(e) of the Mine Act; or (ii) the potential to have such a pattern.
Pending Legal Actions. As of September 30, 2015, we have no pending legal actions before the Federal Mine Safety and Health Review
Commission.
Citations
and orders can be contested and appealed, and as part of that process, are sometimes reduced in severity and amount, and are sometimes dismissed. The number of citations,
orders, and proposed assessments vary from inspector and inspector and also vary depending on the size and type of the operation.
QuickLinks
Headwaters (NYSE:HW)
Historical Stock Chart
From Mar 2024 to Apr 2024

Headwaters (NYSE:HW)
Historical Stock Chart
From Apr 2023 to Apr 2024
