Angle PLC Final Results -3-
July 23 2015 - 2:00AM
UK Regulatory
 From discontinued operations                   -       (1)

 Total comprehensive income/(loss)
  for the year                            (3,795)   (1,334)
                                         ========  ========

 Earnings/(loss) per share
 From continuing operations
  Basic and Diluted (pence per
   share)                                  (8.12)    (4.87)
 From discontinued operations
  Basic and Diluted (pence per
   share)                                  (0.04)      2.13
 From continuing and discontinued
  operations                          6
  Basic and Diluted (pence per
   share)                                  (8.16)    (2.74)
* Comparative figures have been restated to show continuing
operations separately from discontinued operations - Note 5.
CONSOLIDATED STATEMENT OF FINANCIAL POSITION
AS AT 30 APRIL 2015
                                    Note         2015         2014
                                              GBP'000      GBP'000
 ASSETS
 Non-current assets
   Other receivables                   8            -          601
   Property, plant and equipment                  423          139
   Intangible assets                   7        1,149        1,142
                                          -----------  -----------
 Total non-current assets                       1,572        1,882
                                          -----------  -----------
 Current assets
    Inventories                                   197           52
    Trade and other receivables        8        1,008          328
    Cash and cash equivalents                   8,443        3,898
                                          -----------  -----------
 Total current assets                           9,648        4,278
                                          -----------  -----------
 Total assets                                  11,220        6,160
                                          ===========  ===========

 EQUITY AND LIABILITIES
 Equity
   Issued capital                      9        5,897        4,524
   Share premium                               25,299       18,414
   Share based payments reserve                   432          432
   Other reserve                                2,553        2,553
   Translation reserve                             33        (122)
   Retained earnings                         (23,260)     (19,777)
   ESOT shares                                  (102)        (102)
                                          -----------  -----------
 Equity attributable to owners
  of the parent                                10,852        5,922
                                          -----------  -----------
 Non-controlling interests                      (763)        (407)
 Total equity                                  10,089        5,515
                                          -----------  -----------
 Liabilities
 Current liabilities
    Trade and other payables                    1,131          645
                                          -----------  -----------
 Total current liabilities                      1,131          645
                                          -----------  -----------
 Total liabilities                              1,131          645
                                          -----------  -----------
 Total equity and liabilities                  11,220        6,160
                                          ===========  ===========
CONSOLIDATED STATEMENT OF CASH FLOWS
FOR THE YEAR ENDED 30 APRIL 2015
                                                                                     2014
                                                                             (Restated(*)
                                                                 2015                   )
                                                              GBP'000             GBP'000
 Operating activities
 Profit/(loss) before tax from continuing
  operations                                                  (3,869)             (2,198)
 Adjustments for:
   Depreciation of property, plant and equipment                  111                  57
   (Profit)/loss on disposal of property,
    plant and equipment                                             1                (12)
   Amortisation and impairment of intangible
    assets                                                        204                  99
   Exchange differences                                          (41)                  33
   Net finance (income)/costs                                     (9)                (13)
   Share based payments                                           111                  61
                                                   ------------------      --------------
 Operating cash flows before movements
  in working capital:                                         (3,492)             (1,973)
   (Increase)/decrease in inventories                           (191)                  22
   (Increase)/decrease in trade and other
    receivables                                                 (191)                  44
   Increase/(decrease) in trade and other
    payables                                                      452                 (5)
                                                   ------------------      --------------
 Net cash from/(used in) operating activities                 (3,422)             (1,912)
 Investing activities
   Purchase of property, plant and equipment                    (325)                (83)
   Purchase of intangible assets                                (105)               (270)
   Interest received                                               11                  11
                                                   ------------------      --------------
 Net cash from/(used in) investing activities                   (419)               (342)
 Financing activities
   Net proceeds from issue of share capital                     8,257                   -
                                                   ------------------      --------------
 Net cash from/(used in) financing activities                   8,257                   -
 Net increase/(decrease) in cash and cash
  equivalents from continuing operations                        4,416             (2,254)
 Discontinued operations
 Net cash from/(used in) operating activities                     118                (69)
 Net cash from/(used in) investing activities                       8               4,395
                                                   ------------------      --------------
 Net increase/(decrease) in cash and cash
  equivalents from discontinued operations                        126               4,326
 Net increase/(decrease) in cash and cash
  equivalents                                                   4,542               2,072
 Cash and cash equivalents at start of
  year                                                          3,898               1,828
 Effect of exchange rate fluctuations                               3                 (2)
                                                   ------------------      --------------
 Cash and cash equivalents at end of year                       8,443               3,898
                                                   ==================      ==============
* Comparative figures have been restated to show continuing
operations separately from discontinued operations - Note 5.
CONSOLIDATED STATEMENT OF CHANGES IN EQUITY
FOR THE YEAR ENDED 30 APRIL 2015
                                                       Equity attributable to owners of the
                                                                      parent
                                                                         Share
                                                                         based
                                             Issued         Share     payments        Other   Translation
                                            capital       premium      reserve      reserve       reserve
                                            GBP'000       GBP'000      GBP'000      GBP'000       GBP'000

 At 1 May 2013                                4,524        18,414          370        2,553            12
 For the year to 30 April
  2014
--------------------------------------  -----------  ------------  -----------  -----------  ------------
   Consolidated profit/(loss)
   Other comprehensive income
      Exchange differences on
       translating foreign operations                                                               (134)
--------------------------------------  -----------  ------------  -----------  -----------  ------------
   Total comprehensive income                                                                       (134)
   Share based payments                                                     62
     Disposal of controlling
      interest
                                         ___ ______   ___ _______   ___ ______   ___ ______    ___ ______
 At 30 April 2014                             4,524        18,414          432        2,553         (122)
 For the year to 30 April
  2015
--------------------------------------  -----------  ------------  -----------  -----------  ------------
   Consolidated profit/(loss)
   Other comprehensive income
      Exchange differences on
       translating foreign operations                                                                 155
--------------------------------------  -----------  ------------  -----------  -----------  ------------
   Total comprehensive income                                                                         155
   Issue of shares                            1,373         6,885
   Share based payments                                                    111
   Released on forfeiture                                                  (1)
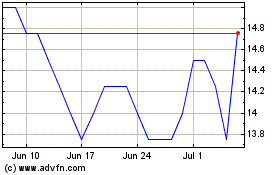
Angle (LSE:AGL)
Historical Stock Chart
From Mar 2024 to Apr 2024

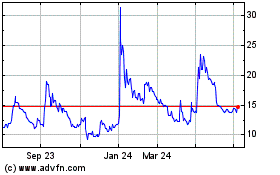
Angle (LSE:AGL)
Historical Stock Chart
From Apr 2023 to Apr 2024
