TIDMAIEA
RNS Number : 9625G
Airea PLC
10 March 2015
AIREA PLC
Interim report for the six months ended 31 December 2014
The principal activity of the group is the manufacturing,
marketing and distribution of floor coverings.
Chairman's statement
It is pleasing to report that the success achieved in the second
half of the last financial year has been maintained and the dip in
sales seen in the first half of last year has been reversed.
The retail market in the UK continues to be challenging, however
there have been some signs of improved consumer confidence.
Statistics for the UK non-residential construction sectors that we
serve showed modest growth in refurbishment and maintenance work, a
flat picture on private new build, and public sector new build
remaining in negative territory. This picture of market conditions
in the UK, combined with strengthening sterling and continuing
difficulties in the Eurozone economies, meant that we continue to
operate in a fiercely competitive and difficult environment.
It is therefore encouraging that our strategy of strengthening
our product portfolio, investing in our sales resource and the
relentless pursuit of service improvements and efficiency gains has
delivered a promising advance in financial performance.
Group results
Revenue for the period was GBP13.5m (2013: GBP11.6m). The
operating profit was GBP700,000 (2013: GBP222,000). After charging
pension related finance costs of GBP215,000 (2013:GBP200,000) and
the appropriate tax charge the net profit for the period was
GBP371,000 (2013: GBP16,000). Basic earnings per share were 0.80p
(2013: 0.03p).
Operating cash flows before movements in working capital were
GBP1.1m (2013: GBP0.6m). Working capital increased by GBP400,000
(2013: GBP373,000) due to timing of payments to suppliers. Payment
of GBP115,000 was made in line with the provision made at the year
end in full and final settlement of a dilapidations dispute
concerning properties vacated in 2011. Contributions to the defined
benefit pension scheme were GBP200,000 (2013 GBP200,000), in line
with the agreement reached with the scheme trustees following the
last triennial valuation as at 1(st) July 2011. Capital expenditure
of GBP136,000 (2013: GBP113,000) was focussed on productivity
improvements and supporting new product launches.
Outlook
The Board does not detect any fundamental changes in the outlook
for the markets that we serve, and competition for business is
likely to remain intense. As a result the board has resolved to
determine the level of dividend at the year end, and there will not
be a dividend payment at the interim stage.
Martin Toogood
Chairman
10 March 2015
Enquiries:
Neil Rylance 01924 266561
Chief Executive Officer
Roger Salt 01924 266561
Group Finance Director
Richard Lindley 0113 388 4789
N+1 Singer
  Consolidated Income
   Statement
  6 months ended 31st
   December 2014
                                  Unaudited   Unaudited       Audited
                                   6 months    6 months          year
                                      ended       ended         ended
                                       31st        31st          30th
                                   December    December          June
                                       2014        2013          2014
                                     GBP000      GBP000        GBP000

  Revenue                            13,514      11,555        23,342
  Operating costs                  (12,814)    (11,333)      (22,736)
  Operating profit                      700         222           606
  Finance income                          1           2             3
  Finance costs                       (215)       (200)         (279)
                                 ----------  ----------  ------------
  Profit before taxation                486          24           330
  Taxation                            (115)         (8)          (29)
                                 ----------
  Profit attributable
   to shareholders of
   the group                            371          16           301
                                 ==========  ==========  ============

  Earnings per share
   (basic and diluted)                0.80p       0.03p         0.65p

  All amounts relate
   to continuing operations

  Consolidated Statement of
   Comprehensive Income
  6 months ended 31st
   December 2014
                                  Unaudited   Unaudited       Audited
                                   6 months    6 months          year
                                      ended       ended         ended
                                       31st        31st          30th
                                   December    December          June
                                       2014        2013          2014
                                     GBP000      GBP000        GBP000
  Profit attributable
   to shareholders of
   the group                            371          16           301
  Actuarial loss recognised
   in the pension scheme                  -           -         (189)
  Related deferred
   taxation                               -           -          (73)
  Total comprehensive
   income attributable
   to shareholders of
   the group                            371          16            39
                                 ==========  ==========  ============


  Consolidated Balance
   Sheet
  as at 31st December             Unaudited   Unaudited       Audited
   2014
                                       31st        31st          30th
                                   December    December          June
                                       2014        2013          2014
                                     GBP000      GBP000        GBP000
  Non-current assets
  Property, plant and
   equipment                          5,427       6,165         5,704
  Deferred tax asset                  1,288       1,476         1,323
                                      6,715       7,641         7,027
                                 ----------  ----------  ------------
  Current assets
  Inventories                        10,358       8,723        10,220
  Trade and other receivables         3,832       3,205         4,313
  Cash and cash equivalents           1,915       2,406         1,930
                                 ----------  ----------  ------------
                                     16,105      14,334        16,463
                                 ----------  ----------  ------------
  Total assets                       22,820      21,975        23,490
                                 ----------  ----------  ------------
  Current liabilities
  Trade and other payables          (4,457)     (3,797)       (5,121)
  Provisions                              -           -         (115)
                                 ----------  ----------  ------------
                                    (4,457)     (3,797)       (5,236)
                                 ----------  ----------  ------------
  Non-current liabilities
  Pension deficit                   (5,776)     (5,668)       (5,761)
  Deferred tax                          (1)        (41)           (1)
                                    (5,777)     (5,709)       (5,762)
                                 ----------  ----------  ------------
  Total liabilities                (10,234)     (9,506)      (10,998)
                                 ----------  ----------  ------------
                                     12,586      12,469        12,492
                                 ==========  ==========  ============
  Equity
  Called up share capital            11,561      11,561        11,561
  Share premium account                 504         504           504
  Capital redemption
   reserve                            2,395       2,395         2,395
  Retained earnings                 (1,874)     (1,991)       (1,968)
                                     12,586      12,469        12,492
                                 ==========  ==========  ============

  Consolidated Cash
   Flow Statement
  6 months ended 31st             Unaudited   Unaudited       Audited
   December 2014
                                   6 months    6 months          year
                                      ended       ended         ended
                                       31st        31st          30th
                                   December    December          June
                                       2014        2013          2014
                                     GBP000      GBP000        GBP000
  Operating activities
  Profit attributable
   to shareholders of
   the group                            371          16           301
         Tax charged                    115           8            29
         Finance costs                  214         198           276
         Depreciation                   413         377           877
                                 ----------  ----------  ------------
  Operating cash flows
   before movements
   in working capital                 1,113         599         1,483
  Increase in working
   capital                            (400)       (373)       (1,633)
  (Decrease) / increase
   in provisions for
   liabilities and charges            (115)                       115
  Contributions to
   defined benefit pension
   scheme                             (200)       (200)         (375)
                                 ----------  ----------  ------------
  Cash generated from
   operations                           398          26         (410)
                                 ----------  ----------  ------------
  Investing activities
  Purchase of property,
   plant and equipment                (136)       (113)         (153)
                                 ----------  ----------  ------------
  Financing activities
  Equity dividends
   paid                               (277)       (254)         (254)
                                 ----------  ----------  ------------
  Net decrease in cash
   and cash equivalents                (15)       (341)         (817)
  Cash and cash equivalents
   at start of period                 1,930       2,747         2,747
  Cash and cash equivalents
   at end of period                   1,915       2,406         1,930
                                 ==========  ==========  ============


  Consolidated Statement of
   Changes in Equity
  6 months ended 31st
   December 2014
                                      Share       Share       Capital    Retained     Total
                                    capital     premium    redemption    Earnings    equity
                                                account       reserve
                                     GBP000      GBP000        GBP000      GBP000    GBP000

  At 1st July 2013                   11,561         504         2,395     (1,753)    12,707
  Profit attributable
   to shareholders of
   the group                              -           -             -          16        16
  Dividend paid                           -           -             -       (254)     (254)
                                 ----------  ----------  ------------  ----------  --------
  At 1st January 2014                11,561         504         2,395     (1,991)    12,469
  Profit attributable
   to shareholders of
   the group                              -           -             -         285       285
  Other comprehensive
   income for the period                  -           -             -       (262)     (262)
  At 1st July 2014                   11,561         504         2,395     (1,968)    12,492
  Profit attributable
   to shareholders of
   the group                              -           -             -         371       371
  Dividend paid                           -           -             -       (277)     (277)
  At 31st December
   2014                              11,561         504         2,395     (1,874)    12,586
                                 ==========  ==========  ============  ==========  ========

  Note

  BASIS OF PREPARATION
   AND ACCOUNTING POLICIES

  The financial information for the six month periods
   ended 31(st) December 2014 and 31(st) December 2013
   has not been audited and does not constitute full financial
   statements within the meaning of Section 434 of the
   Companies Act 2006.

   The financial information relating to the year ended
   30th June 2014 does not constitute full financial statements
   within the meaning of Section 434 of the Companies Act
   2006. This information is based on the group's statutory
   accounts for that period. The statutory accounts were
   prepared in accordance with International Financial
   Reporting Standards as adopted by the European Union
   ("IFRS") and received an unqualified audit report and
   did not contain statements under Section 498(2) or (3)
   of the Companies Act 2006. These financial statements
   have been filed with the Registrar of Companies.

   These interim financial statements have been prepared
   using the recognition and measurement principles of
   International Financial Reporting Standards as adopted
   by the European Union ("IFRS"). The accounting policies
   used are the same as those used in preparing the financial
   statements for the year ended 30th June 2014. These
   policies are set out in the annual report and accounts
   for the year ended 30th June 2014. The interim and annual
   reports are available on the company's website at www.aireaplc.co.uk.
This information is provided by RNS
The company news service from the London Stock Exchange
END
IR MMGGFRLZGKZM
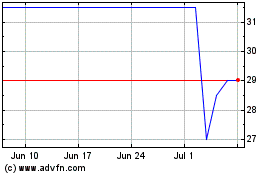
Airea (LSE:AIEA)
Historical Stock Chart
From Mar 2024 to Apr 2024

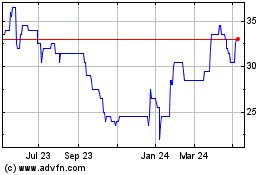
Airea (LSE:AIEA)
Historical Stock Chart
From Apr 2023 to Apr 2024
