ASIA MARKETS: Australian Stocks Log Their Best Week In A Month
November 20 2015 - 4:16AM
Dow Jones News
By Chao Deng
All key markets gain on prospect of U.S. rate hike
Shares in Australia logged their best week in over a month
Friday, while investors elsewhere in the region gradually adjusted
to the prospect of higher U.S. interest rates.
Australia's S&P/ASX 200 gained 4.1% this week, its best
weekly percentage jump since the week ended Oct. 9. The benchmark
was up 0.3% Friday, the best close since Oct. 29, with the
resources sector leading the gains as oil-price declines
stabilized.
Elsewhere, Indonesia's JSX was up 0.7% on Friday and 1.8% for
the week. Japan's Nikkei Stock Average rose 1.4% for the week, and
0.1% on Friday.
Hong Kong's Hang Seng Index and the Shanghai Composite Index
rose 1.6% and 1.4%, respectively, for the week, while South Korea's
Kospi gained 0.8%. On Friday, The Hang Seng added 1.1%, Shanghai
was up 0.4% and the Kospi rose 0.1%.
"The main reason [for the region's gains this week] is a more
relaxed approach about the Fed" by investors, said Shane Oliver,
investment strategist with AMP Capital. "Worries about the Fed
causing an emerging market crisis are dissipating."
Stock-market investors have started to view the Federal
Reserve's tilt toward a near-term interest-rate rise more
positively -- a shift from recent weeks, when worries about higher
borrowing costs and slower growth triggered selling.
Now, many investors, as well as global central banks, are eager
for the Fed to act, if only to settle the uncertainty.
Some said they believe any rate rises would be incremental, and
that a December increase would signal the Fed's vote of confidence
in the global economy.
"We have done everything we can to avoid surprising the markets
and governments when we move, to the extent that several emerging
market and other central bankers have for some time been telling
the Fed to 'just do it,'" said Fed Vice Chairman Stanley Fischer
said in San Francisco Thursday.
In Australia, shares rebounded from heavy selling the previous
week when commodities prices tumbled. Energy shares on the S&P
ASX 200 have gained 6.6% this week, after an 8.4% tumble the
previous week.
Shares of BHP Billiton Ltd. (BHP.AU)(BLT.LN) (BHP.AU)
Australia's largest mining company, are up 1.3% this week, having
shed 11% the previous week, close to a decade low amid worries
about the fallout from a recent dam-burst at its Brazilian iron-ore
operation. Shares were up 0.4% Friday.
"Investors are realizing that the associated selloff in other
resources stocks probably went too far" given that BHP had unique
reasons for its selloff, Oliver said.
Meanwhile, the fallout from slumping commodities' prices and
continuing concerns about China's economic slowdown continue to
weigh on shares in Singapore, where many resources firms,
shipbuilders and property companies trade. The FTSE Strait Times
Index fell 0.2% on Friday, led by declines in traders like Noble
Group Ltd. (N21.SG) and Olam International Ltd. (O32.SG) , down
2.4% and 1.6%, respectively. The index is on track to lose 0.4%
this week.
The benchmark is down 13.4% year to date, surpassing Indonesia's
JSX as the worst performing market in Asia. The JSX is off 12.9%
year to date.
Shares of Noble Group have fallen 6.7% this week in the wake of
recent accusations of irregular accounting. Fitch Ratings said
Friday that Noble's liquidity profile is "just enough" to maintain
its triple B rating. Moody's and Standard & Poor's this week
placed the firm on negative outlook on concerns over its debt and
liquidity.
A weaker yen helped buoy Japanese shares earlier this week, as
the local currency touched its lowest level since late August. But
the yen strengthened Thursday after the Bank of Japan kept its
monetary policy unchanged. The yen last traded at Yen123.01 per
U.S. dollar, up 0.1% from late in Asia Thursday.
Subscribe to WSJ: http://online.wsj.com?mod=djnwires
(END) Dow Jones Newswires
November 20, 2015 04:01 ET (09:01 GMT)
Copyright (c) 2015 Dow Jones & Company, Inc.
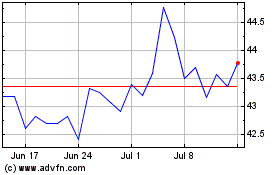
BHP (ASX:BHP)
Historical Stock Chart
From Mar 2024 to Apr 2024

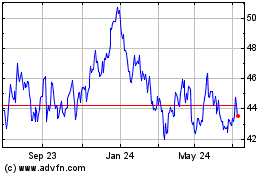
BHP (ASX:BHP)
Historical Stock Chart
From Apr 2023 to Apr 2024
