UNITED STATES
SECURITIES AND EXCHANGE COMMISSION
WASHINGTON, DC 20549
FORM 8-K
CURRENT REPORT
PURSUANT TO SECTION 13 OR 15(d) OF THE
SECURITIES EXCHANGE ACT OF 1934
Date of report (Date of earliest event reported)
January 28, 2016
SEACOAST BANKING CORPORATION
OF FLORIDA
(Exact Name of Registrant as Specified in
Charter)
|
Florida |
|
0-13660 |
|
59-2260678 |
|
(State or Other Jurisdiction
of Incorporation) |
|
(Commission
File Number |
|
(IRS Employer
Identification No.) |
|
815
Colorado Avenue, Stuart, FL |
|
34994 |
| (Address of Principal Executive Offices) |
|
(Zip Code) |
Registrant’s telephone number, including
area code (772) 287-4000
Check the appropriate box below if the
Form 8-K filing is intended to simultaneously satisfy the filing obligation of the registrant under any of the following provisions
(see General Instruction A.2.)
| ¨ | Written communications pursuant to Rule
425 under the Securities Act (17 CFR 230.425) |
| ¨ | Soliciting material pursuant to Rule 14a-12
under the Exchange Act (17 CFR 240.14a-12) |
| ¨ | Pre-commencement communications pursuant
to Rule 14d-2(b) under the Exchange Act (17 CFR 240.14d-2(b)) |
| ¨ | Pre-commencement communications pursuant
to Rule 13e-4(c) under the Exchange Act (17 CFR 240.13e-4(c)) |
SEACOAST BANKING CORPORATION OF FLORIDA
Item 2.02 Results of Operations and
Financial Condition
On January 28, 2016, the Seacoast Banking
Corporation of Florida (“Seacoast” or the “Company”) announced its financial results for the fourth quarter
and year ended December 31, 2015.
A copy of the press release announcing
Seacoast’s results for the fourth quarter and year ended December 31, 2015 is attached hereto as Exhibit 99.1 and incorporated
herein by reference.
Item 7.01 Regulation FD Disclosure
On January 29, 2016, Seacoast held an investor
conference call to discuss its financial results for the fourth quarter and year ended December 31, 2015. A transcript of this
conference call is attached hereto as Exhibit 99.2 and incorporated herein by reference. Also attached as Exhibit 99.3 are charts
(available on the Company’s website at www.seacoastbanking.net) containing information used in the conference call and incorporated
herein by reference. All information included in the transcript and the charts is presented as of December 31, 2015, and the Company
does not assume any obligation to correct or update said information in the future.
The information in Items 2.02 and 7.01,
as well as Exhibits 99.1, 99.2 and 99.3, is being furnished and shall not be deemed “filed” for purposes of Section
18 of the Securities Exchange Act of 1934, nor shall it be deemed incorporated by reference in any filing under the Securities
Act of 1933.
Item 9.01 Financial Statements and
Exhibits
(d) Exhibits
| Exhibit
No. |
|
Description |
| |
|
|
| 99.1 |
|
Press Release dated January 28, 2016 with respect to Seacoast’s
financial results for the fourth quarter and year ended December 31, 2015
|
| |
|
|
| 99.2 |
|
Transcript of Seacoast’s investor conference
call held on January 29, 2016 to discuss the Company’s financial results for the fourth quarter and year ended December
31, 2015 |
| |
|
|
| 99.3 |
|
Data on website containing information used in the
conference call held on January 29, 2016 |
Exhibits 99.1, 99.2 and 99.3 referenced
herein contain “forward-looking statements” within the meaning of Section 28A of the Securities Act of 1933 and Section
21E of the Securities Exchange Act of 1934, including, without limitation, statements about future financial and operating results,
ability to realized deferred tax assets, cost savings, enhanced revenues, economic and seasonal conditions in our markets, and
improvements to reported earnings that may be realized from cost controls and for integration of banks that we have acquired, as
well as statements with respect to Seacoast’s objectives, expectations and intentions and other statements that are not historical
facts. Actual results may differ from those set forth in the forward-looking statements.
Forward-looking statements include statements
with respect to our beliefs, plans, objectives, goals, expectations, anticipations, estimates and intentions, and involve known
and unknown risks, uncertainties and other factors, which may be beyond our control, and which may cause the actual results, performance
or achievements of Seacoast to be materially different from future results, performance or achievements expressed or implied by
such forward-looking statements. You should not expect us to update any forward-looking statements.
You can identify these forward-looking
statements through our use of words such as “may,” “will,” “anticipate,” “assume,”
“should,” “support”, “indicate,” “would,” “believe,” “contemplate,”
“expect,” “estimate,” “continue,” “further”, “point to,” “project,”
“could,” “intend” or other similar words and expressions of the future. These forward-looking statements
may not be realized due to a variety of factors, including, without limitation: the effects of future economic and market conditions,
including seasonality; governmental monetary and fiscal policies, as well as legislative, tax and regulatory changes; changes in
accounting policies, rules and practices; the risks of changes in interest rates on the level and composition of deposits, loan
demand, liquidity and the values of loan collateral, securities, and interest sensitive assets and liabilities; interest rate risks,
sensitivities and the shape of the yield curve; the effects of competition from other commercial banks, thrifts, mortgage banking
firms, consumer finance companies, credit unions, securities brokerage firms, insurance companies, money market and other mutual
funds and other financial institutions operating in our market areas and elsewhere, including institutions operating regionally,
nationally and internationally, together with such competitors offering banking products and services by mail, telephone, computer
and the Internet; and the failure of assumptions underlying the establishment of reserves for possible loan losses. The risks of
mergers and acquisitions, include, without limitation: unexpected transaction costs, including the costs of integrating operations;
the risks that the businesses will not be integrated successfully or that such integration may be more difficult, time-consuming
or costly than expected; the potential failure to fully or timely realize expected revenues and revenue synergies, including as
the result of revenues following the merger being lower than expected; the risk of deposit and customer attrition; any changes
in deposit mix; unexpected operating and other costs, which may differ or change from expectations; the risks of customer and employee
loss and business disruption, including, without limitation, as the result of difficulties in maintaining relationships with employees;
increased competitive pressures and solicitations of customers by competitors; as well as the difficulties and risks inherent with
entering new markets.
All written or oral forward-looking statements
attributable to us are expressly qualified in their entirety by this cautionary notice, including, without limitation, those risks
and uncertainties described in our annual report on Form 10-K for the year ended December 31, 2014 under “Special Cautionary
Notice Regarding Forward-Looking Statements” and “Risk Factors”, and otherwise in our SEC reports and filings.
Such reports are available upon request from the Company, or from the Securities and Exchange Commission, including through the
SEC’s Internet website at http://www.sec.gov.
SIGNATURES
Pursuant to the
requirements of the Securities Exchange Act of 1934, the registrant has duly caused this report to be signed on its behalf by the
undersigned hereunto duly authorized.
| |
SEACOAST BANKING CORPORATION OF FLORIDA |
| |
(Registrant) |
| Date: February 3, 2016 |
|
By: |
/s/ Stephen Fowle |
| |
|
|
Stephen Fowle |
| |
|
|
Executive Vice President and Chief Financial Officer |
EXHIBIT INDEX
| Exhibit No. |
|
Description |
| |
|
|
| 99.1 |
|
Press Release dated January 28, 2016 with respect to Seacoast’s
financial results for the fourth quarter and year ended December 31, 2015
|
| 99.2 |
|
Transcript of Seacoast’s investor conference call held
on January 29, 2016 to discuss the Company’s financial results for the fourth quarter and year ended December 31, 2015
|
| 99.3 |
|
Data on website containing information used in the conference
call held on January 29, 2016
|
EXHIBIT 99.1
To Form 8-K dated January 28, 2016
SEACOAST BANKING CORPORATION OF FLORIDA
NEWS RELEASE
CONTACTS:
Stephen
Fowle, EVP and CFO
(772) 463-8977
steve.fowle@seacoastbank.com
Seacoast
Reports Full Year and Fourth Quarter 2015 Results
Full
Year 2015 EPS Rose 214% to $0.66
Double-Digit
Loan Growth Drove Fourth Quarter Adjusted EPS1 to $0.19, Compared With $0.13 in Q4 2014
Fourth Quarter 2015 Earnings
Highlights
| · | Adjusted revenues increased $5.0 million
or 16% year-over-year to $36.9 million. |
| · | Net interest margin increased eleven basis
points year-over-year to 3.67%. |
| · | Net interest income improved $4.4 million
or 18% largely due to organic loan growth. |
| · | Adjusted
net income1 increased 56% to $6.5 million or $0.19 per diluted share, compared to $4.2 million or $0.13 per diluted
share in the fourth quarter 2014. |
| · | Adjusted return on tangible common equity
improved to 8.4% from 6.2% year-over-year. |
Fourth Quarter 2015 Growth
Highlights
| · | Loans increased $57 million or 3% not
annualized, compared to third quarter 2015 and rose 18% year-over-year. Excluding acquisitions, loans increased $218 million or
12% above year-ago levels. |
| · | Strategic initiatives continue to pay
off. Excluding acquisitions, households grew 5% year-over-year and consumer loans originated outside the branch hit a record 26%
during the fourth quarter. |
| · | Successful integration of Grand Bank and
BankFIRST franchises resulted in net household growth by the third month as opposed to net attrition typical for acquisitions. |
2016 Guidance
| · | Seacoast provided 2016 adjusted diluted
EPS target of $1.00. |
1 Non-GAAP
measure, see “Explanation of Certain Unaudited Non-GAAP Financial Measures”
STUART, Fla., January 28, 2016 /PRNewswire/
— Seacoast Banking Corporation of Florida (NASDAQ: SBCF) today reported results for the fourth quarter and full year 2015.
Fourth quarter 2015 net income increased
to $6.0 million compared to a net loss of $1.5 million reported in the same period of the prior year. Adjusted net income1
increased $2.3 million, or 56%, from year-ago levels. Diluted earnings per common share (EPS) were $0.18 and adjusted diluted
EPS1 were $0.19 in the fourth quarter, compared to adjusted diluted EPS of $0.13 in the fourth quarter of 2014 and
$0.19 in the third quarter of 2015.
Dennis S. Hudson, III, Chairman and CEO
said, “Our sustained execution of Seacoast’s balanced growth strategy produced another quarter of strong results, measured
by increases in loans, deposits and households. The combination of organic and acquired growth in 2015 and our significant operating
leverage led to nearly 60% growth in core EPS, reinforcing our conviction that our continued execution of Seacoast’s long-term
strategy positions us well to produce strong results for shareholders.”
Seacoast’s earnings improvement reflected
continued strong business growth and execution of digital and other strategic initiatives, supplemented by successful acquisitions.
Fourth quarter net income included a $416,000 bargain purchase gain from the acquisition of the Grand Bankshares, arising from
unanticipated recoveries and resulting valuation adjustments to loans and other real estate owned (OREO) realized in the fourth
quarter.
Full-year 2015 net income improved $16.4
million to $22.2 million and fully diluted earnings per share increased 214% to $0.66 compared with $0.21 per diluted common share
in 2014. Adjusted net income1 increased to $25.3 million, or $0.75 per diluted share, in 2015 from $13.0 million, or
$0.47 per diluted share, in 2014.
Hudson added, “We believe that community
banking is undergoing a revolution and we plan to be at the forefront of refining the user experience to the benefit of our customers.
Exiting the Great Recession, we recognized that a fundamental shift in community banking had taken place, and we began to invest
for a new future. We introduced Seacoast’s Accelerate commercial banking model in 2011, and in 2013 began to invest in analytics,
digital servicing capabilities and digital marketing talent and technology. These investments in our future drove our 16% revenue
growth in 2015, with loans increasing at a 12% organic rate and households rising 5% year-over-year.
“Seacoast is building a fully integrated
distribution platform across all channels to provide our customers with the ability to choose their path of convenience to satisfy
their banking needs. In 2015, we rolled out integrated digital marketing, automated cross sell, and deeper customer analytics
which are creating shareholder value as we move forward. Additionally, we are making trade-offs by reinvesting a portion
of the cost savings related to consolidating branch locations and more efficient business processes into new and innovative ways
to serve and grow our customer base. In 2015, we fully absorbed incremental costs needed to support better channel integration
including the expansion of our 24/7 call center, that now originates over 10% of our deposit relationships and almost 30% of our
consumer loan production. Looking forward, we expect our digital and phone based channels to expand dramatically.
“As our upgraded technology platform
enabled us to effectively adapt to changes in consumer banking behavior, we were able to close three branches during 2015 with
minimal customer impact; in fact household growth continued to accelerate during the year. We are currently in the process of consolidating
an additional four legacy locations in the first half of 2016.
“While we remained disciplined in
executing an organic-growth focused strategy, our recent acquisitions have boosted our growth trajectory. Our convenient service
model and enhanced product offerings, especially digital banking, allowed us to grow our acquired banks’ households and further
cross-sell additional products to our newly acquired customers. Specifically, our recently acquired BankFIRST (Orlando) and Grand
Bankshares (Palm Beach County) franchises attained net household growth within three months of acquisition, and Orlando increased
households at a rate above 7% in 2015.”
Hudson concluded, “We look to 2016
with confidence as we continue to execute on our long term strategy, investing in important initiatives, managing expenses and
executing on the right acquisition opportunities. As a result, we have provided an adjusted diluted EPS outlook target of $1.00
for the year. We look forward to discussing this goal with shareholders on our Q4 earnings call.”
FINANCIAL HIGHLIGHTS
(Dollars in thousands except per share data) | |
4Q15 | | |
3Q15 | | |
2Q15 | | |
1Q15 | | |
4Q14 | |
| | |
| | | |
| | | |
| | | |
| | | |
| | |
| Total Assets | |
$ | 3,534,780 | | |
$ | 3,378,108 | | |
$ | 3,233,588 | | |
$ | 3,231,956 | | |
$ | 3,093,335 | |
| | |
| | | |
| | | |
| | | |
| | | |
| | |
| Loans | |
| 2,156,330 | | |
| 2,099,447 | | |
| 1,937,399 | | |
| 1,854,487 | | |
| 1,821,885 | |
| | |
| | | |
| | | |
| | | |
| | | |
| | |
| Deposits | |
| 2,844,387 | | |
| 2,742,296 | | |
| 2,605,177 | | |
| 2,609,825 | | |
| 2,416,534 | |
| | |
| | | |
| | | |
| | | |
| | | |
| | |
| Net Income (Loss) | |
| 6,036 | | |
| 4,441 | | |
| 5,805 | | |
| 5,859 | | |
| (1,517 | ) |
| | |
| | | |
| | | |
| | | |
| | | |
| | |
| Diluted Earnings Per Share | |
| 0.18 | | |
| 0.13 | | |
| 0.18 | | |
| 0.18 | | |
| (0.05 | ) |
| | |
| | | |
| | | |
| | | |
| | | |
| | |
| Return on Average Assets (ROA) | |
| 0.69 | % | |
| 0.52 | % | |
| 0.72 | % | |
| 0.75 | % | |
| (0.20 | )% |
| Return on Average Tangible Common Equity (ROTCE) | |
| 7.8 | | |
| 5.9 | | |
| 8.2 | | |
| 8.5 | | |
| (1.7 | ) |
| | |
| | | |
| | | |
| | | |
| | | |
| | |
| Net Interest Margin | |
| 3.67 | | |
| 3.75 | | |
| 3.50 | | |
| 3.62 | | |
| 3.56 | |
| Efficiency Ratio | |
| 72.6 | | |
| 76.3 | | |
| 68.6 | | |
| 68.3 | | |
| 104.5 | |
| | |
| | | |
| | | |
| | | |
| | | |
| | |
| Pretax, Pre-provision Income (1) | |
$ | 10,130 | | |
$ | 8,126 | | |
$ | 10,224 | | |
$ | 9,832 | | |
$ | (2,029 | ) |
| Average Diluted Shares Outstanding (000) | |
| 34,395 | | |
| 34,194 | | |
| 33,234 | | |
| 33,136 | | |
| 33,124 | |
| Adjusted Net Income (1) | |
$ | 6,520 | | |
$ | 6,433 | | |
$ | 6,172 | | |
$ | 6,177 | | |
$ | 4,179 | |
| Adjusted Diluted Earnings Per Share (1) | |
| 0.19 | | |
| 0.19 | | |
| 0.19 | | |
| 0.19 | | |
| 0.13 | |
| | |
| | | |
| | | |
| | | |
| | | |
| | |
| Adjusted ROA (1) | |
| 0.75 | % | |
| 0.76 | % | |
| 0.77 | % | |
| 0.79 | % | |
| 0.55 | % |
| Adjusted ROTCE (1) | |
| 8.4 | | |
| 8.5 | | |
| 8.7 | | |
| 9.0 | | |
| 6.2 | |
| | |
| | | |
| | | |
| | | |
| | | |
| | |
| Adjusted Efficiency Ratio (1) | |
| 69.1 | | |
| 68.2 | | |
| 67.5 | | |
| 67.5 | | |
| 74.8 | |
| Adjusted Pretax, Pre-provision Income (1) | |
$ | 10,913 | | |
$ | 11,328 | | |
$ | 10,815 | | |
$ | 10,342 | | |
$ | 7,464 | |
| | |
| | | |
| | | |
| | | |
| | | |
| | |
| Annualized Adjusted Operating Expenses as a Percent of Average Assets (1) | |
| 2.93 | % | |
| 3.03 | % | |
| 2.91 | % | |
| 2.88 | % | |
| 3.13 | % |
Acquisitions Update
Hudson noted, “We continue to be
encouraged by results from our recent acquisitions. In Orlando, we achieved growth levels in excess of our already-strong franchise
growth rate as we delivered our service and product offerings to the BankFIRST customer base. Acquisitions in the asset-based lending
space and in demographically-strong Palm Beach County have helped us further propel growth. We are pleased with our ability to
execute against our commitments.
“We look forward to welcoming more
than 5,000 customers of Floridian Bankshares and nearly 9,000 customers from BMO Harris’ Orlando banking operations in the
first part of 2016. We are pleased to announce that we have received regulatory approval for both of these transactions and expect
to close the Floridian acquisition late in the first quarter and the BMO Harris branch purchase late in the second quarter, subject
in both instances to customary closing conditions.”
Florida Economic Update
"The strong Florida economy continues
to amplify our success," said Hudson.
Wells Fargo Securities Group’s December
18, 2015 report titled, “Florida Employment Update: November 2015” stated, “Florida’s economy is firing
on all cylinders…Florida added a nation-leading 35,200 jobs in November, which marks the largest monthly job gain for the
Sunshine State since May 2010. On a year-to-date basis, nonfarm employment has risen 3.0 percent, resulting in a net gain of 239,600
jobs.”
Comerica Bank’s Comerica Economic
Insights report dated January 5, 2016 stated, “Our Florida Economic Activity Index increased again in October, for the 19th
consecutive month. Most components of the index were positive in October. Only state exports and housing starts were negative for
the month. The Florida economy is firmly re-established as a growth leader for the U.S….we see no reason for the positive
trend to change in the near term.”
Fourth Quarter 2015 Income Statement
Highlights
Balance Sheet Mix, Driven by Growth
in Relationship Customers and Improved Yields, Fuel Net Interest Income and Margin Expansion
Net interest income for the quarter totaled
$29.1 million, a $4.4 million or 18% increase from fourth quarter 2014 levels. Net interest margin expanded to 3.67%, an eleven
basis point increase from the prior year. Year-over-year net interest income and margin increases reflect improvement in rate and
balance sheet mix, largely due to growth in customer relationships.
Net interest income increased $0.1 million
and net interest margin decreased eight basis points from 3.75% in the prior quarter. Linked quarter results reflect an accelerated
level of purchase loan accretion in the third quarter of 2015 that contributed approximately 10 basis points of margin during that
quarter. Strong loan growth and improved core yields more than compensated for a decrease in purchased loan accretion. Fourth quarter
results included essentially no excess purchased loan accretion.
Noninterest Income Growth Reflects Increases
in Households
Noninterest income excluding securities
gains and the bargain purchase gain, totaled $7.8 million for the fourth quarter, an increase of $641,000 or 9% from a year ago.
Most categories of service fee income showed year-over-year growth with interchange income up a strong 24%, indicating continued
strength in customer acquisition and cross sell and benefits from acquisition activity.
Noninterest income, excluding securities
gains and the bargain purchase gain related to the Grand Bankshares acquisition, decreased $300,000 from third quarter 2015 levels.
Strength in interchange income and smaller increases in many other categories were offset by decreases in mortgage banking, brokerage
and marine income, which were negatively impacted by low activity during the holiday season.
As mentioned previously, fourth quarter
net income included a $416,000 bargain purchase gain from the acquisition of the Grand Bankshares, arising from unanticipated recoveries
and resulting valuation adjustments to loans and other real estate owned (OREO) realized in the fourth quarter.
Noninterest Expense Continues to Show
Strong Operating Leverage and Investment in Seacoast Strategy
Noninterest expense decreased $6.8 million
from the fourth quarter 2014. Prior year expenses reflected significant non-recurring costs related to the acquisition of The BANKshares
on October 1, 2014 and other one-time costs. Adjusted noninterest expense1 increased $1.6 million from prior-year levels.
The year-over-year increase in adjusted expense reflects ongoing costs related to the acquisitions of FGC and Grand Bankshares,
particularly in added salary and benefits, which increased $666,000 or 5%, and occupancy and furniture and equipment costs, which
increased $265,000 or 9%. Increases also reflect variable costs related to strong organic franchise growth, particularly in data
processing costs, which increased $588,000 or 31%, an investment made to further the company’s strategy.
Noninterest expense decreased $2.0 million
from the third quarter, 2015. Excluding merger related charges and other one-time items, adjusted noninterest expense1
grew $200,000, or less than 1%. Increases in occupancy ($108,000) and data processing costs ($178,000) were partially offset by
decreases in salary and benefits ($110,000). These fluctuations represent normal expense volatility.
Seacoast’s efficiency ratio was 72.6%
in fourth quarter of 2015, down from 104.5% in the fourth quarter of 2014 and below 76.3% in the third quarter of 2015. Adjusted1,
the efficiency ratio decreased to 69.3% in the fourth quarter of 2015 from 74.8% in the fourth quarter of 2014 and up slightly
from 68.2% in the third quarter of 2015. Linked-quarter increase was impacted by the significant amount of accelerated purchased
loan accretion recorded in the third quarter of 2015, whereas fourth quarter results included essentially no excess purchased loan
accretion.
Fourth Quarter 2015 Balance Sheet Highlights
Deposit Growth Reflects Success of Core
Customer Increase and Acquisitions
Total deposits increased 18% to $2.84 billion
at December 31, 2015, from year ago levels. Core customer funding increased to $2.72 billion at December 31, 2015, a $476 million,
or 21% increase from the fourth quarter of 2014. Excluding acquisitions, core customer funding increased by $286 million or 13%
from one year ago and total deposits increased $239 million or 10% from one year ago. Total deposits grew $102 million or 4% (not
annualized) and core customer funding increased $138 million or 5% (not annualized) compared to the prior quarter. Linked-quarter
increases were largely due to normal seasonal growth in public funds.
Noninterest demand deposits grew $129.2
million, or 18% from the fourth quarter of 2014 and remained at a strong 30.0% of total deposits.
| (Dollars in thousands) | |
Fourth
Quarter
2015 | | |
Third
Quarter
2015 | | |
Second
Quarter
2015 | | |
First
Quarter
2015 | | |
Fourth
Quarter
2014 | |
| Customer Relationship Funding | |
| | | |
| | | |
| | | |
| | | |
| | |
| | |
| | | |
| | | |
| | | |
| | | |
| | |
| Noninterest demand | |
$ | 854,447 | | |
$ | 869,877 | | |
$ | 808,429 | | |
$ | 793,336 | | |
$ | 725,238 | |
| | |
| | | |
| | | |
| | | |
| | | |
| | |
| Interest-bearing demand | |
| 734,749 | | |
| 618,344 | | |
| 599,268 | | |
| 634,854 | | |
| 652,353 | |
| | |
| | | |
| | | |
| | | |
| | | |
| | |
| Money market | |
| 665,353 | | |
| 660,632 | | |
| 621,973 | | |
| 596,600 | | |
| 450,172 | |
| | |
| | | |
| | | |
| | | |
| | | |
| | |
| Savings | |
| 295,851 | | |
| 286,810 | | |
| 282,588 | | |
| 272,963 | | |
| 264,738 | |
| | |
| | | |
| | | |
| | | |
| | | |
| | |
| Time certificates of deposit | |
| 293,987 | | |
| 306,633 | | |
| 292,919 | | |
| 312,072 | | |
| 324,033 | |
| | |
| | | |
| | | |
| | | |
| | | |
| | |
| Total deposits | |
$ | 2,844,387 | | |
$ | 2,742,296 | | |
$ | 2,605,177 | | |
$ | 2,609,825 | | |
$ | 2,416,534 | |
| | |
| | | |
| | | |
| | | |
| | | |
| | |
| Customer sweep accounts | |
$ | 172,005 | | |
$ | 148,607 | | |
$ | 157,676 | | |
$ | 170,023 | | |
$ | 153,640 | |
| | |
| | | |
| | | |
| | | |
| | | |
| | |
| Total core customer funding (2) | |
$ | 2,722,405 | | |
$ | 2,584,270 | | |
$ | 2,469,934 | | |
$ | 2,467,776 | | |
$ | 2,246,141 | |
| | |
| | | |
| | | |
| | | |
| | | |
| | |
| Demand deposit mix (noninterest bearing) | |
| 30.0 | % | |
| 31.7 | % | |
| 31.0 | % | |
| 30.4 | % | |
| 30.0 | % |
(2)Total deposits and customer
sweep accounts, excluding time certificates of deposit.
Loans Up Substantially from Acquisition
and Strong Core Growth
Total loans were $2.16 billion at December
31, 2015, an increase of $334 million or 18% from a year ago. Excluding acquired loans, loans increased $218 million or 12% from
the prior year’s fourth quarter. Loans increased a strong $57 million or 3% (not annualized) from third quarter levels.
Loan growth continued across all business
lines. Commercial loan originations for the quarter were $80 million with the commercial pipeline (in underwriting and approval
or approved and not yet closed) totaling a strong $106 million at December 31, 2015 increasing from prior quarter and well in excess
of recent history. Consumer loan and small business originations (inclusive of lines of credit) totaled $54 million in the fourth
quarter of 2015 compared to $28 million one year ago.
Closed residential production for the quarter
totaled $60.2 million compared with $57.9 million a year ago, with a total residential pipeline of $30.3 million at December 31,
2015 up from $21.4 million one year ago.
| (Dollars in thousands) | |
4Q15 | | |
3Q15 | | |
2Q15 | | |
1Q15 | | |
4Q14 | |
| | |
| | |
| | |
| | |
| | |
| |
| Commercial pipeline | |
$ | 105,556 | | |
$ | 104,915 | | |
$ | 108,538 | | |
$ | 82,143 | | |
$ | 60,136 | |
| Commercial loans closed | |
| 80,003 | | |
| 71,823 | | |
| 85,815 | | |
| 61,357 | | |
| 94,719 | |
| Total Commercial loan originations and pipeline | |
$ | 185,559 | | |
$ | 176,738 | | |
$ | 194,353 | | |
$ | 143,500 | | |
$ | 154,855 | |
| | |
| | | |
| | | |
| | | |
| | | |
| | |
| Residential pipeline | |
$ | 30,340 | | |
$ | 37,958 | | |
$ | 53,902 | | |
$ | 48,485 | | |
$ | 21,351 | |
| Residential loans retained | |
| 24,905 | | |
| 36,027 | | |
| 45,596 | | |
| 23,951 | | |
| 31,598 | |
| Residential loans sold | |
| 35,278 | | |
| 37,996 | | |
| 36,182 | | |
| 31,896 | | |
| 26,336 | |
| Total Residential loan originations and pipeline | |
$ | 90,523 | | |
$ | 111,981 | | |
$ | 135,680 | | |
$ | 104,332 | | |
$ | 79,285 | |
Other Highlights
Credit Quality Remains Stable with Growth
Trends
The provision for loan losses was $369,000
for the fourth quarter of 2015, up from $118,000 in the fourth quarter 2014 and below $987,000 recorded in the third quarter 2015.
The fourth quarter provision reflects continued strong credit metrics, offset by continued loan growth. The third quarter provision
was also impacted by $655,000 related to a single purchased credit impaired loan performing below our initial expectations. The
allowance for loan losses for non-acquired loans was 1.03% of total loans, compared to 1.11% in the third quarter 2015.
Additional highlights include:
| · | Nonperforming loans to total loans outstanding
at the end of the fourth quarter remained at a clean 0.8%, down from 1.2% at year-end 2014; |
| · | Nonperforming assets to total assets declined
to 0.7%, compared to 0.9% a year ago. |
Capital Ratios Continue to Improve from
Earnings Momentum
Capital ratios remain healthy and well
above regulatory requirements for well-capitalized institutions. The common equity tier 1 capital ratio (CET1) is estimated at
13.3% and the total capital ratio is estimated at 16.0% at December 31, 2015. The tier 1 leverage ratio is estimated at 10.7% at
December 31, 2015.
Tangible book value per share increased
$0.13 to $9.31 and book value per share increased $0.09 to $10.29 at December 31, 2015, as earnings more than offset decreases
in AFS securities valuation at the end of the 2015 year. Average tangible common equity to assets was a strong 9.3% at December
31, 2015.
Conference Call Information
Seacoast will host a conference call on
Friday, January 29, 2016 at 10:00 a.m. (Eastern Time) to discuss the earnings results. Investors may call in (toll-free) by dialing
(888) 517-2513 (passcode: 7021 952; host: Dennis S. Hudson). Slides will be used during the conference call and may be accessed
at Seacoast's website at SeacoastBanking.com by selecting "Presentations" under the heading "Investor Services."
A replay of the call will be available for one month, beginning late afternoon of January 29, by dialing (888) 843-7419 (domestic),
using the passcode 7021 952.
Alternatively, individuals may listen to
the live webcast of the presentation by visiting Seacoast's website at SeacoastBanking.com. The link is located in the subsection
"Presentations" under the heading "Investor Services." Beginning the afternoon of January 29, an archived version
of the webcast can be accessed from this same subsection of the website. The archived webcast will be available for one year.
About Seacoast Banking Corporation of
Florida (NASDAQ: SBCF)
Seacoast Banking Corporation of Florida
is one of the largest community banks headquartered in Florida with approximately $3.5 billion in assets and $2.8 billion in deposits
as of December 31, 2015. The Company provides integrated financial services including commercial and retail banking, wealth management,
and mortgage services to customers through advanced banking solutions, 43 traditional branches of its locally-branded wholly-owned
subsidiary bank, Seacoast Bank, and five commercial banking centers. Offices stretch from Ft. Lauderdale, Boca Raton and West Palm
Beach north through the Space Coast of Florida, into Orlando and Central Florida, and west to Okeechobee and surrounding counties.
More information about the Company is available at SeacoastBanking.com.
Sources:
https://www08.wellsfargomedia.com/assets/pdf/commercial/insights/economics/regional-reports/fl-employment-20151218.pdf
http://blog.comerica.com/2016/01/05/comerica-banks-florida-index-continues-solid-gains/
Cautionary Notice Regarding Forward-Looking
Statements
This press release contains "forward-looking
statements" within the meaning of Section 27A of the Securities Act of 1933 and Section 21E of the Securities Exchange Act
of 1934, including, without limitation, statements about future financial and operating results, cost savings, enhanced revenues,
economic and seasonal conditions in our markets, and improvements to reported earnings that may be realized from cost controls
and for integration of banks that we have acquired, or expect to acquire, as well as statements with respect to Seacoast's objectives,
expectations and intentions and other statements that are not historical facts. Actual results may differ from those set forth
in the forward-looking statements.
Forward-looking statements include statements
with respect to our beliefs, plans, objectives, goals, expectations, anticipations, estimates and intentions, and involve known
and unknown risks, uncertainties and other factors, which may be beyond our control, and which may cause the actual results, performance
or achievements of Seacoast to be materially different from future results, performance or achievements expressed or implied by
such forward-looking statements. You should not expect us to update any forward-looking statements.
You can identify these forward-looking
statements through our use of words such as "may," "will," "anticipate," "assume," "should,"
"support", "indicate," "would," "believe," "contemplate," "expect,"
"estimate," "continue," "further", "point to," "project," "could,"
"intend" or other similar words and expressions of the future. These forward-looking statements may not be realized due
to a variety of factors, including, without limitation: the effects of future economic and market conditions, including seasonality;
governmental monetary and fiscal policies, as well as legislative, tax and regulatory changes; changes in accounting policies,
rules and practices; the risks of changes in interest rates on the level and composition of deposits, loan demand, liquidity and
the values of loan collateral, securities, and interest sensitive assets and liabilities; interest rate risks, sensitivities and
the shape of the yield curve; the effects of competition from other commercial banks, thrifts, mortgage banking firms, consumer
finance companies, credit unions, securities brokerage firms, insurance companies, money market and other mutual funds and other
financial institutions operating in our market areas and elsewhere, including institutions operating regionally, nationally and
internationally, together with such competitors offering banking products and services by mail, telephone, computer and the Internet;
and the failure of assumptions underlying the establishment of reserves for possible loan losses. The risks of mergers and acquisitions,
include, without limitation: unexpected transaction costs, including the costs of integrating operations; the risks that the businesses
will not be integrated successfully or that such integration may be more difficult, time-consuming or costly than expected; the
potential failure to fully or timely realize expected revenues and revenue synergies, including as the result of revenues following
the merger being lower than expected; the risk of deposit and customer attrition; any changes in deposit mix; unexpected operating
and other costs, which may differ or change from expectations; the risks of customer and employee loss and business disruption,
including, without limitation, as the result of difficulties in maintaining relationships with employees; increased competitive
pressures and solicitations of customers by competitors; as well as the difficulties and risks inherent with entering new markets.
All written or oral forward-looking
statements attributable to us are expressly qualified in their entirety by this cautionary notice, including, without limitation,
those risks and uncertainties described in our annual report on Form 10-K for the year ended December 31, 2014, under "Special
Cautionary Notice Regarding Forward-looking Statements" and "Risk Factors", and otherwise in our SEC reports and
filings. Such reports are available upon request from the Company, or from the Securities and Exchange Commission, including through
the SEC's Internet website at http://www.sec.gov.
Important information for Investors and Shareholders
Seacoast has filed a registration statement
on Form S-4 and amendments thereto containing a definitive Proxy Statement/Prospectus with the SEC regarding the proposed merger
with Floridian into Seacoast. On or about January 22, 2016, this Proxy Statement/Prospectus was mailed to Floridian shareholders.
INVESTORS AND SECURITY HOLDERS ARE URGED TO READ THE PROXY STATEMENT/PROSPECTUS REGARDING THE PROPOSED MERGER AND OTHER DOCUMENTS
FILED BY SEACOAST WITH THE SEC CAREFULLY AND IN THEIR ENTIRETY, AS WELL AS ANY AMENDMENTS OR SUPPLEMENTS TO THOSE DOCUMENTS WHEN
THEY BECOME AVAILABLE, BECAUSE THEY DO OR WILL CONTAIN IMPORTANT INFORMATION.
Investors can obtain a free copy of
the Proxy Statement/Prospectus, as well as other filings containing information about Seacoast and Floridian, at the SEC’s
website (http://www.sec.gov), with respect to information about Seacoast, and Floridian’s website (www.floridianbank.com),
with respect to information about Floridian. Investors can also obtain these documents, free of charge, at http://www.seacoastbanking.com
under the tab “Investor Relations” and then under the tab “Financials/Regulatory Filings.” Copies
of the Proxy Statement/Prospectus and any other filing by Seacoast with the SEC can also be obtained, free of charge, by directing
a request to Investor Relations, 815 Colorado Avenue, P.O. Box 9012, Stuart, FL 34994, (772) 288-6085.
Seacoast, Floridian, their respective
directors and executive officers and other members of management and employees may be considered participants in the solicitation
of proxies in connection with the proposed transaction. Information about the directors and executive officers of Seacoast is set
forth in its proxy statement for its 2015 annual meeting of shareholders, which was filed with the SEC on April 7, 2015 and its
Current Reports on Form 8-K. Other information regarding the participants in the proxy solicitation and a description of their
direct and indirect interests, by security holdings or otherwise, is contained in the Proxy Statement/Prospectus. You may
obtain free copies of these documents as described in the preceding paragraph.
Explanation of Certain Unaudited Non-GAAP Financial Measures
This press release contains financial information
determined by methods other than Generally Accepted Accounting Principles ("GAAP"). The financial highlights provide
reconciliations between GAAP net income and adjusted net income, GAAP income and adjusted pretax, pre-provision income. Management
uses these non-GAAP financial measures in its analysis of the Company's performance and believes these presentations provide useful
supplemental information, and a clearer understanding of the Company's performance. The Company believes the non-GAAP measures
enhance investors' understanding of the Company's business and performance. These measures are also useful in understanding performance
trends and facilitate comparisons with the performance of other financial institutions. The limitations associated with operating
measures are the risk that persons might disagree as to the appropriateness of items comprising these measures and that different
companies might calculate these measures differently. The Company provides reconciliations between GAAP and these non-GAAP measures.
These disclosures should not be considered an alternative to GAAP.
To better evaluate its earnings, the Company
removes certain items to arrive at adjusted net income, adjusted pretax, pre-provision income and adjusted diluted earnings per
share (non-GAAP measures) as detailed in the table below:
| (Dollars in thousands except per share data) | |
Fourth
Quarter
2015 | | |
Third
Quarter
2015 | | |
Second
Quarter
2015 | | |
First
Quarter
2015 | | |
Fourth
Quarter
2014 | |
| | |
| | |
| | |
| | |
| | |
| |
| Net income | |
$ | 6,036 | | |
$ | 4,441 | | |
$ | 5,805 | | |
$ | 5,859 | | |
($ | 1,517 | ) |
| Severance | |
| 187 | | |
| 98 | | |
| 29 | | |
| 12 | | |
| 478 | |
| | |
| | | |
| | | |
| | | |
| | | |
| | |
| Merger related charges | |
| 1,043 | | |
| 2,692 | | |
| 337 | | |
| 275 | | |
| 2,722 | |
| Bargain purchase gain | |
| (416 | ) | |
| 0 | | |
| 0 | | |
| 0 | | |
| 0 | |
| | |
| | | |
| | | |
| | | |
| | | |
| | |
| Branch closure charges and costs related to expense initiatives | |
| 0 | | |
| 121 | | |
| 0 | | |
| 0 | | |
| 4,261 | |
| Marketing and brand refresh expense | |
| 0 | | |
| 0 | | |
| 0 | | |
| 0 | | |
| 697 | |
| | |
| | | |
| | | |
| | | |
| | | |
| | |
| Stock compensation expense and other incentive costs related to improved outlook | |
| 0 | | |
| 0 | | |
| 0 | | |
| 0 | | |
| 1,213 | |
| Securities (gains) | |
| (1 | ) | |
| (160 | ) | |
| 0 | | |
| 0 | | |
| (108 | ) |
| Miscellaneous losses | |
| 48 | | |
| 112 | | |
| 0 | | |
| 0 | | |
| 119 | |
| Net loss on OREO and repossessed assets | |
| (157 | ) | |
| 262 | | |
| 53 | | |
| 81 | | |
| 9 | |
| Asset dispositions expense | |
| 79 | | |
| 77 | | |
| 173 | | |
| 143 | | |
| 103 | |
| Effective tax rate on adjustments | |
| (299 | ) | |
| (1,210 | ) | |
| (225 | ) | |
| (193 | ) | |
| (3,798 | ) |
| | |
| | | |
| | | |
| | | |
| | | |
| | |
| Adjusted Net Income (1) | |
| 6,520 | | |
| 6,433 | | |
| 6,172 | | |
| 6,177 | | |
| 4,179 | |
| Provision for loan losses | |
| 369 | | |
| 987 | | |
| 855 | | |
| 433 | | |
| 118 | |
| Income taxes | |
| 4,024 | | |
| 3,908 | | |
| 3,788 | | |
| 3,732 | | |
| 3,167 | |
| Adjusted pretax, pre-provision income (1) | |
$ | 10,913 | | |
$ | 11,328 | | |
$ | 10,815 | | |
$ | 10,342 | | |
$ | 7,464 | |
| Adjusted earnings per diluted share (1) | |
$ | 0.19 | | |
$ | 0.19 | | |
$ | 0.19 | | |
$ | 0.19 | | |
$ | 0.13 | |
| Average shares outstanding (000) | |
| 34,395 | | |
| 34,194 | | |
| 33,234 | | |
| 33,136 | | |
| 33,124 | |
| FINANCIAL HIGHLIGHTS |
(Unaudited) |
02/02/16 |
| SEACOAST BANKING CORPORATION OF FLORIDA AND SUBSIDIARIES |
| (Dollars in thousands, except share data) | |
Three Months Ended | | |
Twelve Months Ended | |
| | |
December 31, | | |
September 30, | | |
December 31, | | |
December 31, | | |
December 31, | |
| | |
2015 | | |
2015 | | |
2014 | | |
2015 | | |
2014 | |
| Summary of Earnings | |
| | | |
| | | |
| | | |
| | | |
| | |
| Net income (loss) | |
$ | 6,036 | | |
$ | 4,441 | | |
$ | (1,517 | ) | |
$ | 22,141 | | |
$ | 5,696 | |
| Net interest income (1) | |
| 29,216 | | |
| 29,130 | | |
| 24,883 | | |
| 109,968 | | |
| 75,221 | |
| Net interest margin (1), (2) | |
| 3.67 | | |
| 3.75 | | |
| 3.56 | | |
| 3.64 | | |
| 3.25 | |
| | |
| | | |
| | | |
| | | |
| | | |
| . | |
| Performance Ratios | |
| | | |
| | | |
| | | |
| | | |
| | |
| Return on average assets-GAAP basis (2), (3) | |
| 0.69 | % | |
| 0.52 | % | |
| (0.20 | )% | |
| 0.67 | % | |
| 0.23 | % |
| Return on average shareholders' equity-GAAP basis (2), (3) | |
| 6.78 | | |
| 5.05 | | |
| (1.89 | ) | |
| 6.56 | | |
| 2.22 | |
| Return on average tangible shareholders' equity-GAAP basis (2), (3), (4) | |
| 7.83 | | |
| 5.94 | | |
| (1.71 | ) | |
| 7.59 | | |
| 2.57 | |
| Efficiency ratio (5) | |
| 72.57 | | |
| 76.29 | | |
| 104.46 | | |
| 71.58 | | |
| 91.57 | |
| Noninterest income to total revenue | |
| 21.10 | | |
| 21.79 | | |
| 22.40 | | |
| 22.63 | | |
| 24.83 | |
| | |
| | | |
| | | |
| | | |
| | | |
| | |
| Per Share Data | |
| | | |
| | | |
| | | |
| | | |
| | |
| Net income (loss) diluted-GAAP basis | |
$ | 0.18 | | |
$ | 0.13 | | |
$ | (0.05 | ) | |
$ | 0.66 | | |
$ | 0.21 | |
| Net income (loss) basic-GAAP basis | |
| 0.18 | | |
| 0.13 | | |
| (0.05 | ) | |
| 0.66 | | |
| 0.21 | |
| Book value per share common | |
| 10.29 | | |
| 10.20 | | |
| 9.44 | | |
| 10.29 | | |
| 9.44 | |
| Tangible book value per share | |
| 9.31 | | |
| 9.18 | | |
| 8.51 | | |
| 9.31 | | |
| 8.51 | |
| Cash dividends declared | |
| 0.00 | | |
| 0.00 | | |
| 0.00 | | |
| 0.00 | | |
| 0.00 | |
| (1) | Calculated on a fully taxable equivalent basis using
amortized cost. |
| (2) | These ratios are stated on an annualized basis and are
not necessarily indicative of future periods. |
| (3) | The calculation of ROA and ROE do not include the mark-to-market
unrealized gains (losses) because the unrealized gains (losses) are not included in net income. |
| (4) | The Company defines tangible common equity as total
shareholder's equity less intangible assets. |
| (5) | Defined as (noninterest expense less foreclosed property
expense and amortization of intangibles) divided by net operating revenue (net interest income on a fully taxable equivalent basis
plus noninterest income excluding securities gains and bargain purchase gain, net). |
| FINANCIAL HIGHLIGHTS |
| SEACOAST BANKING CORPORATION OF FLORIDA AND SUBSIDIARIES |
| | |
December 31, | | |
September 30, | | |
December 31, | |
| (Dollars in thousands, except share data) | |
2015 | | |
2015 | | |
2014 | |
| | |
| | |
| | |
| |
| Selected Financial Data | |
| | | |
| | | |
| | |
| Total assets | |
$ | 3,534,780 | | |
$ | 3,378,108 | | |
$ | 3,093,335 | |
| Securities available for sale (at fair value) | |
| 790,766 | | |
| 728,161 | | |
| 741,375 | |
| Securities held for investment (at amortized cost) | |
| 203,525 | | |
| 209,047 | | |
| 207,904 | |
| Net loans | |
| 2,137,202 | | |
| 2,080,119 | | |
| 1,804,814 | |
| Deposits | |
| 2,844,387 | | |
| 2,742,296 | | |
| 2,416,534 | |
| Total shareholders' equity | |
| 353,453 | | |
| 350,280 | | |
| 312,651 | |
| | |
| | | |
| | | |
| | |
| Average Balances (Year-to-Date) | |
| | | |
| | | |
| | |
| Total average assets | |
$ | 3,304,397 | | |
$ | 3,250,855 | | |
$ | 2,485,259 | |
| Less: intangible assets | |
| 33,277 | | |
| 32,879 | | |
| 8,840 | |
| Total average tangible assets | |
$ | 3,271,120 | | |
$ | 3,217,976 | | |
$ | 2,476,419 | |
| | |
| | | |
| | | |
| | |
| Total average equity | |
$ | 337,367 | | |
$ | 331,966 | | |
$ | 256,867 | |
| Less: intangible assets | |
| 33,277 | | |
| 32,879 | | |
| 8,840 | |
| Total average tangible equity | |
$ | 304,090 | | |
$ | 299,087 | | |
$ | 248,027 | |
| | |
| | | |
| | | |
| | |
| Credit Analysis | |
| | | |
| | | |
| | |
| Net charge-offs (recoveries) year-to-date - non-acquired loans | |
$ | (609 | ) | |
$ | (854 | ) | |
$ | (489 | ) |
| Net charge-offs year-to-date - acquired loans | |
| 1,196 | | |
| 872 | | |
| - | |
| Total net charge-offs (recoveries) year-to-date | |
$ | 587 | | |
$ | 18 | | |
$ | (489 | ) |
| | |
| | | |
| | | |
| | |
| Net charge-offs (recoveries) to average loans (annualized) - non-acquired loans | |
| (0.03 | )% | |
| (0.06 | )% | |
| (0.03 | )% |
| Net charge-offs to average loans (annualized) - acquired loans | |
| 0.06 | | |
| 0.06 | | |
| - | |
| Total net charge-offs (recoveries) to average loans (annualized) | |
| 0.03 | | |
| 0.00 | | |
| (0.03 | ) |
| | |
| | | |
| | | |
| | |
| Loan loss provision (recapture) year-to-date - non-acquired loans | |
$ | 1,375 | | |
$ | 1,415 | | |
$ | (3,550 | ) |
| Loan loss provision year-to-date - acquired loans | |
| 1,269 | | |
| 860 | | |
| 64 | |
| Total loan loss provision (recapture) year-to-date | |
$ | 2,644 | | |
$ | 2,275 | | |
$ | (3,486 | ) |
| | |
| | | |
| | | |
| | |
| Allowance to loans at end of period - non-acquired loans | |
| 1.03 | % | |
| 1.11 | % | |
| 1.14 | % |
| Discount for credit losses to acquired loans at end of period | |
| 4.24 | | |
| 4.13 | | |
| 3.56 | |
| | |
| | | |
| | | |
| | |
| Nonperforming loans - non-acquired loans | |
$ | 12,758 | | |
$ | 14,474 | | |
$ | 18,563 | |
| Nonperforming loans - acquired loans | |
| 4,628 | | |
| 2,636 | | |
| 2,577 | |
| Other real estate owned - non-acquired | |
| 3,699 | | |
| 4,183 | | |
| 5,567 | |
| Other real estate owned - acquired | |
| 3,340 | | |
| 3,250 | | |
| 1,895 | |
| Total nonperforming assets | |
$ | 24,425 | | |
$ | 24,543 | | |
$ | 28,602 | |
| | |
| | | |
| | | |
| | |
| Restructured loans (accruing) | |
$ | 19,970 | | |
$ | 20,543 | | |
$ | 24,997 | |
| | |
| | | |
| | | |
| | |
| Purchased noncredit impaired loans | |
$ | 308,737 | | |
$ | 347,262 | | |
$ | 332,508 | |
| Purchased credit impaired loans | |
| 12,109 | | |
| 12,673 | | |
| 7,814 | |
| Total acquired loans | |
$ | 320,846 | | |
$ | 359,935 | | |
$ | 340,322 | |
| | |
| | | |
| | | |
| | |
| Nonperforming loans to loans at end of period - non-acquired loans | |
| 0.59 | % | |
| 0.69 | % | |
| 1.02 | % |
| Nonperforming loans to loans at end of period - acquired loans | |
| 0.22 | | |
| 0.12 | | |
| 0.14 | |
| Total nonperforming loans to loans at end of period | |
| 0.81 | | |
| 0.81 | | |
| 1.16 | |
| | |
| | | |
| | | |
| | |
| Nonperforming assets to total assets - non-acquired | |
| 0.47 | % | |
| 0.55 | % | |
| 0.78 | % |
| Nonperforming assets to total assets - acquired | |
| 0.22 | | |
| 0.18 | | |
| 0.14 | |
| Total nonperforming assets to total assets | |
| 0.69 | | |
| 0.73 | | |
| 0.92 | |
| CONDENSED CONSOLIDATED STATEMENTS OF INCOME |
(Unaudited) |
| SEACOAST BANKING CORPORATION OF FLORIDA AND SUBSIDIARIES |
| | |
Three Months Ended | | |
Twelve Months Ended | |
| | |
December 31, | | |
December 31, | |
| (Dollars in thousands, except per share data) | |
2015 | | |
2014 | | |
2015 | | |
2014 | |
| | |
| | |
| | |
| | |
| |
| Interest on securities: | |
| | | |
| | | |
| | | |
| | |
| Taxable | |
$ | 5,312 | | |
$ | 4,728 | | |
$ | 20,341 | | |
$ | 15,448 | |
| Nontaxable | |
| 144 | | |
| 182 | | |
| 585 | | |
| 211 | |
| Interest and fees on loans | |
| 25,184 | | |
| 21,070 | | |
| 94,469 | | |
| 63,586 | |
| Interest on federal funds sold and other investments | |
| 275 | | |
| 292 | | |
| 1,022 | | |
| 1,017 | |
| Total Interest Income | |
| 30,915 | | |
| 26,272 | | |
| 116,417 | | |
| 80,262 | |
| | |
| | | |
| | | |
| | | |
| | |
| Interest on deposits | |
| 598 | | |
| 297 | | |
| 2,085 | | |
| 864 | |
| Interest on time certificates | |
| 265 | | |
| 375 | | |
| 1,228 | | |
| 1,538 | |
| Interest on borrowed money | |
| 952 | | |
| 867 | | |
| 3,617 | | |
| 2,953 | |
| Total Interest Expense | |
| 1,815 | | |
| 1,539 | | |
| 6,930 | | |
| 5,355 | |
| | |
| | | |
| | | |
| | | |
| | |
| Net Interest Income | |
| 29,100 | | |
| 24,733 | | |
| 109,487 | | |
| 74,907 | |
| Provision (recapture) for loan losses | |
| 369 | | |
| 118 | | |
| 2,644 | | |
| (3,486 | ) |
| Net Interest Income After Provision for Loan Losses | |
| 28,731 | | |
| 24,615 | | |
| 106,843 | | |
| 78,393 | |
| | |
| | | |
| | | |
| | | |
| | |
| Noninterest income: | |
| | | |
| | | |
| | | |
| | |
| Service charges on deposit accounts | |
| 2,229 | | |
| 2,208 | | |
| 8,563 | | |
| 6,952 | |
| Trust fees | |
| 791 | | |
| 795 | | |
| 3,132 | | |
| 2,986 | |
| Mortgage banking fees | |
| 955 | | |
| 716 | | |
| 4,252 | | |
| 3,057 | |
| Brokerage commissions and fees | |
| 511 | | |
| 417 | | |
| 2,132 | | |
| 1,614 | |
| Marine finance fees | |
| 205 | | |
| 445 | | |
| 1,152 | | |
| 1,320 | |
| Interchange income | |
| 1,989 | | |
| 1,603 | | |
| 7,684 | | |
| 5,972 | |
| Other deposit based EFT fees | |
| 99 | | |
| 92 | | |
| 397 | | |
| 343 | |
| BOLI income | |
| 396 | | |
| 252 | | |
| 1,426 | | |
| 252 | |
| Gain on participated loan | |
| 0 | | |
| 0 | | |
| 725 | | |
| 0 | |
| Other | |
| 607 | | |
| 613 | | |
| 2,555 | | |
| 2,248 | |
| | |
| 7,782 | | |
| 7,141 | | |
| 32,018 | | |
| 24,744 | |
| Securities gains, net | |
| 1 | | |
| 108 | | |
| 161 | | |
| 469 | |
| Bargain purchase gain, net | |
| 416 | | |
| 0 | | |
| 416 | | |
| 0 | |
| Total Noninterest Income | |
| 8,199 | | |
| 7,249 | | |
| 32,595 | | |
| 25,213 | |
| | |
| | | |
| | | |
| | | |
| | |
| Noninterest expenses: | |
| | | |
| | | |
| | | |
| | |
| Salaries and wages | |
| 11,135 | | |
| 11,676 | | |
| 41,075 | | |
| 35,132 | |
| Employee benefits | |
| 2,178 | | |
| 2,461 | | |
| 9,564 | | |
| 8,773 | |
| Outsourced data processing costs | |
| 2,455 | | |
| 3,506 | | |
| 10,150 | | |
| 8,781 | |
| Telephone / data lines | |
| 412 | | |
| 419 | | |
| 1,797 | | |
| 1,331 | |
| Occupancy | |
| 2,314 | | |
| 2,325 | | |
| 8,744 | | |
| 7,930 | |
| Furniture and equipment | |
| 1,000 | | |
| 732 | | |
| 3,434 | | |
| 2,535 | |
| Marketing | |
| 1,128 | | |
| 1,163 | | |
| 4,428 | | |
| 3,576 | |
| Legal and professional fees | |
| 2,580 | | |
| 2,555 | | |
| 8,022 | | |
| 6,871 | |
| FDIC assessments | |
| 551 | | |
| 476 | | |
| 2,212 | | |
| 1,660 | |
| Amortization of intangibles | |
| 397 | | |
| 446 | | |
| 1,424 | | |
| 1,033 | |
| Asset dispositions expense | |
| 79 | | |
| 103 | | |
| 472 | | |
| 488 | |
| Branch closures and branding | |
| 0 | | |
| 4,958 | | |
| 0 | | |
| 4,958 | |
| Net (gain)/loss on other real estate owned and repossessed assets | |
| (157 | ) | |
| 9 | | |
| 239 | | |
| 310 | |
| Other | |
| 3,097 | | |
| 3,182 | | |
| 12,209 | | |
| 9,988 | |
| Total Noninterest Expenses | |
| 27,169 | | |
| 34,011 | | |
| 103,770 | | |
| 93,366 | |
| | |
| | | |
| | | |
| | | |
| | |
| Income (Loss) Before Income Taxes | |
| 9,761 | | |
| (2,147 | ) | |
| 35,668 | | |
| 10,240 | |
| Income taxes | |
| 3,725 | | |
| (630 | ) | |
| 13,527 | | |
| 4,544 | |
| | |
| | | |
| | | |
| | | |
| | |
| Net Income (Loss) | |
$ | 6,036 | | |
$ | (1,517 | ) | |
$ | 22,141 | | |
$ | 5,696 | |
| | |
| | | |
| | | |
| | | |
| | |
| Per share of common stock: | |
| | | |
| | | |
| | | |
| | |
| | |
| | | |
| | | |
| | | |
| | |
| Net income (loss) diluted | |
$ | 0.18 | | |
$ | (0.05 | ) | |
$ | 0.66 | | |
$ | 0.21 | |
| Net income (loss) basic | |
| 0.18 | | |
| (0.05 | ) | |
| 0.66 | | |
| 0.21 | |
| Cash dividends declared | |
| 0.00 | | |
| 0.00 | | |
| 0.00 | | |
| 0.00 | |
| | |
| | | |
| | | |
| | | |
| | |
| Average diluted shares outstanding | |
| 34,395,373 | | |
| 33,123,525 | | |
| 33,744,171 | | |
| 27,716,895 | |
| Average basic shares outstanding | |
| 34,115,697 | | |
| 32,888,612 | | |
| 33,495,827 | | |
| 27,538,955 | |
| CONDENSED CONSOLIDATED STATEMENTS OF INCOME |
(Unaudited) |
| SEACOAST BANKING CORPORATION OF FLORIDA AND SUBSIDIARIES |
| | |
QUARTER | |
| | |
2015 | | |
2014 | |
| (Dollars in thousands) | |
Fourth | | |
Third | | |
Second | | |
First | | |
Fourth | |
| | |
| | |
| | |
| | |
| | |
| |
| Interest on securities: | |
| | | |
| | | |
| | | |
| | | |
| | |
| Taxable | |
$ | 5,312 | | |
$ | 5,154 | | |
$ | 4,977 | | |
$ | 4,898 | | |
$ | 4,728 | |
| Nontaxable | |
| 144 | | |
| 144 | | |
| 147 | | |
| 150 | | |
| 182 | |
| Interest and fees on loans | |
| 25,184 | | |
| 25,276 | | |
| 21,988 | | |
| 22,021 | | |
| 21,070 | |
| Interest on federal funds sold and other investments | |
| 275 | | |
| 249 | | |
| 249 | | |
| 249 | | |
| 292 | |
| Total Interest Income | |
| 30,915 | | |
| 30,823 | | |
| 27,361 | | |
| 27,318 | | |
| 26,272 | |
| | |
| | | |
| | | |
| | | |
| | | |
| | |
| Interest on deposits | |
| 598 | | |
| 562 | | |
| 524 | | |
| 401 | | |
| 297 | |
| Interest on time certificates | |
| 265 | | |
| 295 | | |
| 321 | | |
| 347 | | |
| 375 | |
| Interest on borrowed money | |
| 952 | | |
| 955 | | |
| 850 | | |
| 860 | | |
| 867 | |
| Total Interest Expense | |
| 1,815 | | |
| 1,812 | | |
| 1,695 | | |
| 1,608 | | |
| 1,539 | |
| | |
| | | |
| | | |
| | | |
| | | |
| | |
| Net Interest Income | |
| 29,100 | | |
| 29,011 | | |
| 25,666 | | |
| 25,710 | | |
| 24,733 | |
| Provision (recapture) for loan losses | |
| 369 | | |
| 987 | | |
| 855 | | |
| 433 | | |
| 118 | |
| Net Interest Income After Provision for Loan Losses | |
| 28,731 | | |
| 28,024 | | |
| 24,811 | | |
| 25,277 | | |
| 24,615 | |
| | |
| | | |
| | | |
| | | |
| | | |
| | |
| Noninterest income: | |
| | | |
| | | |
| | | |
| | | |
| | |
| Service charges on deposit accounts | |
| 2,229 | | |
| 2,217 | | |
| 2,115 | | |
| 2,002 | | |
| 2,208 | |
| Trust fees | |
| 791 | | |
| 781 | | |
| 759 | | |
| 801 | | |
| 795 | |
| Mortgage banking fees | |
| 955 | | |
| 1,177 | | |
| 1,032 | | |
| 1,088 | | |
| 716 | |
| Brokerage commissions and fees | |
| 511 | | |
| 604 | | |
| 576 | | |
| 441 | | |
| 417 | |
| Marine finance fees | |
| 205 | | |
| 258 | | |
| 492 | | |
| 197 | | |
| 445 | |
| Interchange income | |
| 1,989 | | |
| 1,925 | | |
| 2,033 | | |
| 1,737 | | |
| 1,603 | |
| Other deposit based EFT fees | |
| 99 | | |
| 88 | | |
| 96 | | |
| 114 | | |
| 92 | |
| BOLI income | |
| 396 | | |
| 366 | | |
| 334 | | |
| 330 | | |
| 252 | |
| Gain on participated loan | |
| 0 | | |
| 0 | | |
| 725 | | |
| 0 | | |
| 0 | |
| Other | |
| 607 | | |
| 666 | | |
| 684 | | |
| 598 | | |
| 613 | |
| | |
| 7,782 | | |
| 8,082 | | |
| 8,846 | | |
| 7,308 | | |
| 7,141 | |
| Securities gains, net | |
| 1 | | |
| 160 | | |
| 0 | | |
| 0 | | |
| 108 | |
| Bargain purchase gain, net | |
| 416 | | |
| 0 | | |
| 0 | | |
| 0 | | |
| 0 | |
| Total Noninterest Income | |
| 8,199 | | |
| 8,242 | | |
| 8,846 | | |
| 7,308 | | |
| 7,249 | |
| | |
| | | |
| | | |
| | | |
| | | |
| | |
| Noninterest expenses: | |
| | | |
| | | |
| | | |
| | | |
| | |
| Salaries and wages | |
| 11,135 | | |
| 11,850 | | |
| 9,301 | | |
| 8,789 | | |
| 11,676 | |
| Employee benefits | |
| 2,178 | | |
| 2,430 | | |
| 2,541 | | |
| 2,415 | | |
| 2,461 | |
| Outsourced data processing costs | |
| 2,455 | | |
| 3,277 | | |
| 2,234 | | |
| 2,184 | | |
| 3,506 | |
| Telephone / data lines | |
| 412 | | |
| 446 | | |
| 443 | | |
| 496 | | |
| 419 | |
| Occupancy | |
| 2,314 | | |
| 2,396 | | |
| 2,011 | | |
| 2,023 | | |
| 2,325 | |
| Furniture and equipment | |
| 1,000 | | |
| 883 | | |
| 819 | | |
| 732 | | |
| 732 | |
| Marketing | |
| 1,128 | | |
| 1,099 | | |
| 1,226 | | |
| 975 | | |
| 1,163 | |
| Legal and professional fees | |
| 2,580 | | |
| 2,189 | | |
| 1,590 | | |
| 1,663 | | |
| 2,555 | |
| FDIC assessments | |
| 551 | | |
| 552 | | |
| 520 | | |
| 589 | | |
| 476 | |
| Amortization of intangibles | |
| 397 | | |
| 397 | | |
| 315 | | |
| 315 | | |
| 446 | |
| Asset dispositions expense | |
| 79 | | |
| 77 | | |
| 173 | | |
| 143 | | |
| 103 | |
| Branch closures and branding | |
| 0 | | |
| 0 | | |
| 0 | | |
| 0 | | |
| 4,958 | |
| Net (gain)/loss on other real estate owned and repossessed assets | |
| (157 | ) | |
| 262 | | |
| 53 | | |
| 81 | | |
| 9 | |
| Other | |
| 3,097 | | |
| 3,269 | | |
| 3,062 | | |
| 2,781 | | |
| 3,182 | |
| Total Noninterest Expenses | |
| 27,169 | | |
| 29,127 | | |
| 24,288 | | |
| 23,186 | | |
| 34,011 | |
| | |
| | | |
| | | |
| | | |
| | | |
| | |
| Income (Loss) Before Income Taxes | |
| 9,761 | | |
| 7,139 | | |
| 9,369 | | |
| 9,399 | | |
| (2,147 | ) |
| Income taxes | |
| 3,725 | | |
| 2,698 | | |
| 3,564 | | |
| 3,540 | | |
| (630 | ) |
| | |
| | | |
| | | |
| | | |
| | | |
| | |
| Net Income (Loss) | |
$ | 6,036 | | |
$ | 4,441 | | |
$ | 5,805 | | |
$ | 5,859 | | |
$ | (1,517 | ) |
| | |
| | | |
| | | |
| | | |
| | | |
| | |
| Per share of common stock: | |
| | | |
| | | |
| | | |
| | | |
| | |
| | |
| | | |
| | | |
| | | |
| | | |
| | |
| Net income (loss) diluted | |
$ | 0.18 | | |
$ | 0.13 | | |
$ | 0.18 | | |
$ | 0.18 | | |
$ | (0.05 | ) |
| Net income (loss) basic | |
| 0.18 | | |
| 0.13 | | |
| 0.18 | | |
| 0.18 | | |
| (0.05 | ) |
| Cash dividends declared | |
| 0.00 | | |
| 0.00 | | |
| 0.00 | | |
| 0.00 | | |
| 0.00 | |
| | |
| | | |
| | | |
| | | |
| | | |
| | |
| Average diluted shares outstanding | |
| 34,395,373 | | |
| 34,193,540 | | |
| 33,233,508 | | |
| 33,135,618 | | |
| 33,123,525 | |
| Average basic shares outstanding | |
| 34,115,697 | | |
| 33,907,178 | | |
| 32,978,006 | | |
| 32,971,444 | | |
| 32,888,612 | |
| CONDENSED CONSOLIDATED BALANCE SHEETS |
(Unaudited) |
| SEACOAST BANKING CORPORATION OF FLORIDA AND SUBSIDIARIES |
| | |
December 31, | | |
December 31, | |
| (Dollars in thousands, except share data) | |
2015 | | |
2014 | |
| | |
| | |
| |
| Assets | |
| | | |
| | |
| Cash and due from banks | |
$ | 81,216 | | |
$ | 64,411 | |
| Interest bearing deposits with other banks | |
| 54,851 | | |
| 36,128 | |
| Total Cash and Cash Equivalents | |
| 136,067 | | |
| 100,539 | |
| | |
| | | |
| | |
| Securities: | |
| | | |
| | |
| Available for sale (at fair value) | |
| 790,766 | | |
| 741,375 | |
| Held for investment (at amortized cost) | |
| 203,525 | | |
| 207,904 | |
| Total Securities | |
| 994,291 | | |
| 949,279 | |
| | |
| | | |
| | |
| Loans available for sale | |
| 23,998 | | |
| 12,078 | |
| | |
| | | |
| | |
| Loans, net of deferred costs | |
| 2,156,330 | | |
| 1,821,885 | |
| Less: Allowance for loan losses | |
| (19,128 | ) | |
| (17,071 | ) |
| Net Loans | |
| 2,137,202 | | |
| 1,804,814 | |
| | |
| | | |
| | |
| Bank premises and equipment, net | |
| 54,579 | | |
| 45,086 | |
| Other real estate owned | |
| 7,039 | | |
| 7,462 | |
| Other intangible assets | |
| 8,594 | | |
| 7,454 | |
| Goodwill | |
| 25,211 | | |
| 25,309 | |
| Bank owned life insurance | |
| 43,579 | | |
| 35,679 | |
| Other assets | |
| 104,220 | | |
| 105,635 | |
| | |
$ | 3,534,780 | | |
$ | 3,093,335 | |
| | |
| | | |
| | |
| Liabilities and Shareholders' Equity | |
| | | |
| | |
| Liabilities | |
| | | |
| | |
| Deposits | |
| | | |
| | |
| Noninterest demand | |
$ | 854,447 | | |
$ | 725,238 | |
| Interest-bearing demand | |
| 734,749 | | |
| 652,353 | |
| Savings | |
| 295,851 | | |
| 264,738 | |
| Money market | |
| 665,353 | | |
| 450,172 | |
| Other time certificates | |
| 153,318 | | |
| 173,247 | |
| Brokered time certificates | |
| 9,403 | | |
| 7,034 | |
| Time certificates of $100,000 or more | |
| 131,266 | | |
| 143,752 | |
| Total Deposits | |
| 2,844,387 | | |
| 2,416,534 | |
| | |
| | | |
| | |
| Federal funds purchased and securities sold under agreements to repurchase, maturing within 30 days | |
| 172,005 | | |
| 233,640 | |
| Borrowed funds | |
| 50,000 | | |
| 50,000 | |
| Subordinated debt | |
| 69,961 | | |
| 64,583 | |
| Other liabilities | |
| 44,974 | | |
| 15,927 | |
| | |
| 3,181,327 | | |
| 2,780,684 | |
| | |
| | | |
| | |
| Shareholders' Equity | |
| | | |
| | |
| Common stock | |
| 3,435 | | |
| 3,300 | |
| Additional paid in capital | |
| 399,162 | | |
| 379,249 | |
| Accumulated deficit | |
| (42,858 | ) | |
| (65,000 | ) |
| Treasury stock | |
| (73 | ) | |
| (71 | ) |
| | |
| 359,666 | | |
| 317,478 | |
| Accumulated other comprehensive (loss), net | |
| (6,213 | ) | |
| (4,827 | ) |
| Total Shareholders' Equity | |
| 353,453 | | |
| 312,651 | |
| | |
$ | 3,534,780 | | |
$ | 3,093,335 | |
| | |
| | | |
| | |
| Common Shares Outstanding | |
| 34,351,409 | | |
| 33,136,592 | |
Note: The balance sheet at December 31, 2014 has been derived
from the audited financial statements at that date.
| CONSOLIDATED QUARTERLY FINANCIAL DATA |
(Unaudited) |
| SEACOAST BANKING CORPORATION OF FLORIDA AND SUBSIDIARIES |
| | |
QUARTERS | |
| | |
2015 | | |
2014 | |
| (Dollars in thousands, except per share data) | |
Fourth | | |
Third | | |
Second | | |
First | | |
Fourth | |
| Net income (loss) | |
$ | 6,036 | | |
$ | 4,441 | | |
$ | 5,805 | | |
$ | 5,859 | | |
$ | (1,517 | ) |
| | |
| | | |
| | | |
| | | |
| | | |
| | |
| Operating Ratios | |
| | | |
| | | |
| | | |
| | | |
| | |
| Return on average assets-GAAP basis (2),(3) | |
| 0.69 | % | |
| 0.52 | % | |
| 0.72 | % | |
| 0.75 | % | |
| (0.20 | )% |
| Return on average tangible assets (2),(3),(4) | |
| 0.73 | | |
| 0.56 | | |
| 0.75 | | |
| 0.79 | | |
| (0.16 | ) |
| Return on average shareholders' equity-GAAP basis (2),(3) | |
| 6.78 | | |
| 5.05 | | |
| 7.13 | | |
| 7.42 | | |
| (1.89 | ) |
| Efficiency ratio (5) | |
| 72.57 | | |
| 76.29 | | |
| 68.57 | | |
| 68.33 | | |
| 104.46 | |
| Noninterest income to total revenue | |
| 21.10 | | |
| 21.79 | | |
| 25.63 | | |
| 22.13 | | |
| 22.40 | |
| | |
| | | |
| | | |
| | | |
| | | |
| | |
| Net interest margin (1),(2) | |
| 3.67 | | |
| 3.75 | | |
| 3.50 | | |
| 3.62 | | |
| 3.56 | |
| Average equity to average assets | |
| 10.20 | | |
| 10.34 | | |
| 10.12 | | |
| 10.17 | | |
| 10.51 | |
| | |
| | | |
| | | |
| | | |
| | | |
| | |
| Credit Analysis Excluding Acquired Loans | |
| | | |
| | | |
| | | |
| | | |
| | |
| Net charge-offs (recoveries) - non-acquired loans | |
$ | 245 | | |
$ | (233 | ) | |
$ | (358 | ) | |
$ | (263 | ) | |
$ | 618 | |
| Net charge-offs - acquired loans | |
| 324 | | |
| 683 | | |
| 143 | | |
| 46 | | |
| - | |
| Total net charge-offs (recoveries) | |
$ | 569 | | |
$ | 450 | | |
$ | (215 | ) | |
$ | (217 | ) | |
$ | 618 | |
| | |
| | | |
| | | |
| | | |
| | | |
| | |
| Net charge-offs (recoveries) to average loans - non-acquired loans | |
| 0.05 | % | |
| (0.04 | )% | |
| (0.08 | )% | |
| (0.06 | )% | |
| 0.14 | % |
| Net charge-offs (recoveries) to average loans - acquired loans | |
| 0.06 | | |
| 0.12 | | |
| 0.03 | | |
| 0.01 | | |
| - | |
| Total net charge-offs (recoveries) to average loans | |
| 0.11 | | |
| 0.08 | | |
| (0.05 | ) | |
| (0.05 | ) | |
| 0.14 | |
| | |
| | | |
| | | |
| | | |
| | | |
| | |
| Loan loss provision (recapture) - non-acquired loans | |
$ | (40 | ) | |
$ | 852 | | |
$ | 271 | | |
$ | 292 | | |
$ | 54 | |
| Loan loss provision (recapture) - acquired loans | |
| 409 | | |
| 135 | | |
| 584 | | |
| 141 | | |
| 64 | |
| Total loan loss provision (recapture) | |
$ | 369 | | |
$ | 987 | | |
$ | 855 | | |
$ | 433 | | |
$ | 118 | |
| | |
| | | |
| | | |
| | | |
| | | |
| | |
| Allowance to loans at end of period - non-acquired loans | |
| 1.03 | % | |
| 1.11 | % | |
| 1.10 | % | |
| 1.13 | % | |
| 1.14 | % |
| Discount for credit losses to acquired loans at end of period | |
| 4.24 | | |
| 4.13 | | |
| 3.32 | | |
| 3.56 | | |
| 3.56 | |
| | |
| | | |
| | | |
| | | |
| | | |
| | |
| Nonperforming loans - non-acquired loans | |
$ | 12,758 | | |
$ | 14,474 | | |
$ | 15,054 | | |
$ | 16,860 | | |
$ | 18,563 | |
| Nonperforming loans - acquired loans | |
| 4,628 | | |
| 2,636 | | |
| 4,543 | | |
| 4,196 | | |
| 2,577 | |
| Other real estate owned - non-acquired | |
| 3,699 | | |
| 4,183 | | |
| 4,855 | | |
| 4,738 | | |
| 5,567 | |
| Other real estate owned - acquired | |
| 3,340 | | |
| 3,250 | | |
| 1,053 | | |
| 1,431 | | |
| 1,895 | |
| Total nonperforming assets | |
$ | 24,425 | | |
$ | 24,543 | | |
$ | 25,505 | | |
$ | 27,225 | | |
$ | 28,602 | |
| | |
| | | |
| | | |
| | | |
| | | |
| | |
| Restructured loans (accruing) | |
$ | 19,970 | | |
$ | 20,543 | | |
$ | 23,441 | | |
$ | 23,847 | | |
$ | 24,997 | |
| | |
| | | |
| | | |
| | | |
| | | |
| | |
| Purchased noncredit impaired loans | |
$ | 308,737 | | |
$ | 347,262 | | |
$ | 275,964 | | |
$ | 296,839 | | |
$ | 326,066 | |
| Purchased credit impaired loans | |
| 12,109 | | |
| 12,673 | | |
| 6,562 | | |
| 7,119 | | |
| 7,814 | |
| Total acquired loans | |
$ | 320,846 | | |
$ | 359,935 | | |
$ | 282,526 | | |
$ | 303,958 | | |
$ | 333,880 | |
| | |
| | | |
| | | |
| | | |
| | | |
| | |
| Nonperforming loans to loans at end of period - non-acquired loans | |
| 0.59 | % | |
| 0.69 | % | |
| 0.78 | % | |
| 0.91 | % | |
| 1.02 | % |
| Nonperforming loans to loans at end of period - acquired loans | |
| 0.22 | | |
| 0.12 | | |
| 0.23 | | |
| 0.23 | | |
| 0.14 | |
| Total nonperforming loans to loans at end of period | |
| 0.81 | | |
| 0.81 | | |
| 1.01 | | |
| 1.14 | | |
| 1.16 | |
| | |
| | | |
| | | |
| | | |
| | | |
| | |
| Nonperforming assets to total assets - non-acquired | |
| 0.47 | % | |
| 0.55 | % | |
| 0.62 | % | |
| 0.67 | % | |
| 0.78 | % |
| Nonperforming assets to total assets - acquired | |
| 0.22 | | |
| 0.18 | | |
| 0.17 | | |
| 0.17 | | |
| 0.14 | |
| Total nonperforming assets to total assets | |
| 0.69 | | |
| 0.73 | | |
| 0.79 | | |
| 0.84 | | |
| 0.92 | |
| | |
| | | |
| | | |
| | | |
| | | |
| | |
| Per Share Common Stock | |
| | | |
| | | |
| | | |
| | | |
| | |
| Net income (loss) diluted-GAAP basis | |
$ | 0.18 | | |
$ | 0.13 | | |
$ | 0.18 | | |
$ | 0.18 | | |
$ | (0.05 | ) |
| Net income (loss) basic-GAAP basis | |
| 0.18 | | |
| 0.13 | | |
| 0.18 | | |
| 0.18 | | |
| (0.05 | ) |
| | |
| | | |
| | | |
| | | |
| | | |
| | |
| Cash dividends declared | |
| 0.00 | | |
| 0.00 | | |
| 0.00 | | |
| 0.00 | | |
| 0.00 | |
| Book value per share common | |
| 10.29 | | |
| 10.20 | | |
| 9.84 | | |
| 9.71 | | |
| 9.44 | |
| | |
| | | |
| | | |
| | | |
| | | |
| | |
| Average Balances | |
| | | |
| | | |
| | | |
| | | |
| | |
| Total average assets | |
$ | 3,463,277 | | |
$ | 3,373,858 | | |
$ | 3,225,127 | | |
$ | 3,151,132 | | |
$ | 3,037,061 | |
| Less: Intangible assets | |
| 34,457 | | |
| 35,185 | | |
| 32,188 | | |
| 31,221 | | |
| 33,803 | |
| Total average tangible assets | |
$ | 3,428,820 | | |
$ | 3,338,673 | | |
$ | 3,192,939 | | |
$ | 3,119,911 | | |
$ | 3,003,258 | |
| | |
| | | |
| | | |
| | | |
| | | |
| | |
| Total average equity | |
$ | 353,392 | | |
$ | 348,901 | | |
$ | 326,338 | | |
$ | 320,346 | | |
$ | 319,233 | |
| Less: Intangible assets | |
| 34,457 | | |
| 35,185 | | |
| 32,188 | | |
| 31,221 | | |
| 33,803 | |
| Total average tangible equity | |
$ | 318,935 | | |
$ | 313,716 | | |
$ | 294,150 | | |
$ | 289,125 | | |
$ | 285,430 | |
| (1) | Calculated on a fully taxable equivalent basis using
amortized cost. |
| (2) | These ratios are stated on an annualized basis and are
not necessarily indicative of future periods. |
| (3) | The calculation of ROA and ROE do not include the mark-to-market
unrealized gains (losses), because the unrealized gains (losses) are not included in net income (loss). |
| (4) | The Company believes that return on average assets and
equity excluding the impacts of noncash amortization expense on intangible assets is a better measurement of the Company's trend
in earnings growth. |
| (5) | Defined as (noninterest expense less foreclosed property
expense and amortization of intangibles) divided by net operating revenue (net interest income on a fully taxable equivalent basis
plus noninterest income excluding securities gains and bargain purchase gain, net). |
| | |
December 31, | | |
December 31, | |
| SECURITIES | |
2015 | | |
2014 | |
| U.S. Treasury and U.S. Government Agencies | |
$ | 3,911 | | |
$ | 3,899 | |
| Mortgage-backed | |
| 539,688 | | |
| 587,933 | |
| Collateralized loan obligations | |
| 122,583 | | |
| 125,225 | |
| Obligations of states and political subdivisions | |
| 39,891 | | |
| 24,318 | |
| Corporates | |
| 35,532 | | |
| 0 | |
| CMBS | |
| 40,420 | | |
| 0 | |
| Other | |
| 8,741 | | |
| 0 | |
| Securities Available for Sale | |
| 790,766 | | |
| 741,375 | |
| | |
| | | |
| | |
| Mortgage-backed | |
| 162,225 | | |
| 182,076 | |
| Collateralized loan obligations | |
| 41,300 | | |
| 25,828 | |
| Securities Held for Investment | |
| 203,525 | | |
| 207,904 | |
| Total Securities | |
$ | 994,291 | | |
$ | 949,279 | |
| | |
December 31, | | |
December 31, | |
| LOANS | |
2015 | | |
2014 | |
| | |
| | |
| |
| Construction and land development | |
$ | 108,787 | | |
$ | 87,036 | |
| Real estate mortgage | |
| 1,733,163 | | |
| 1,524,044 | |
| Installment loans to individuals | |
| 85,356 | | |
| 52,897 | |
| Commercial and financial | |
| 228,517 | | |
| 157,396 | |
| Other loans | |
| 507 | | |
| 512 | |
| Total Loans | |
$ | 2,156,330 | | |
$ | 1,821,885 | |
| AVERAGE BALANCES, INTEREST INCOME AND EXPENSES, YIELDS AND RATES (1) |
(Unaudited) |
| SEACOAST BANKING CORPORATION OF FLORIDA AND SUBSIDIARIES |
| | |
2015 | | |
2014 | |
| | |
Fourth
Quarter | | |
Third Quarter | | |
Fourth Quarter | |
| | |
Average | | |
| | |
Yield/ | | |
Average | | |
| | |
Yield/ | | |
Average | | |
| | |
Yield/ | |
| (Dollars in thousands) | |
Balance | | |
Interest | | |
Rate | | |
Balance | | |
Interest | | |
Rate | | |
Balance | | |
Interest | | |
Rate | |
| Assets | |
| | | |
| | | |
| | | |
| | | |
| | | |
| | | |
| | | |
| | | |
| | |
| Earning assets: | |
| | | |
| | | |
| | | |
| | | |
| | | |
| | | |
| | | |
| | | |
| | |
| Securities: | |
| | | |
| | | |
| | | |
| | | |
| | | |
| | | |
| | | |
| | | |
| | |
| Taxable | |
$ | 924,730 | | |
$ | 5,312 | | |
| 2.30 | % | |
$ | 966,764 | | |
$ | 5,154 | | |
| 2.13 | % | |
$ | 897,472 | | |
$ | 4,728 | | |
| 2.11 | % |
| Nontaxable | |
| 14,932 | | |
| 220 | | |
| 5.89 | | |
| 14,982 | | |
| 220 | | |
| 5.87 | | |
| 15,871 | | |
| 279 | | |
| 7.03 | |
| Total
Securities | |
| 939,662 | | |
| 5,532 | | |
| 2.35 | | |
| 981,746 | | |
| 5,374 | | |
| 2.19 | | |
| 913,343 | | |
| 5,007 | | |
| 2.19 | |
| | |
| | | |
| | | |
| | | |
| | | |
| | | |
| | | |
| | | |
| | | |
| | |
| Federal funds sold and
other investments | |
| 93,728 | | |
| 275 | | |
| 1.16 | | |
| 42,083 | | |
| 249 | | |
| 2.35 | | |
| 63,690 | | |
| 292 | | |
| 1.82 | |
| | |
| | | |
| | | |
| | | |
| | | |
| | | |
| | | |
| | | |
| | | |
| | |
| Loans, net | |
| 2,121,053 | | |
| 25,224 | | |
| 4.72 | | |
| 2,060,326 | | |
| 25,319 | | |
| 4.88 | | |
| 1,794,423 | | |
| 21,123 | | |
| 4.67 | |
| | |
| | | |
| | | |
| | | |
| | | |
| | | |
| | | |
| | | |
| | | |
| | |
| Total
Earning Assets | |
| 3,154,442 | | |
| 31,031 | | |
| 3.90 | | |
| 3,084,155 | | |
| 30,942 | | |
| 3.98 | | |
| 2,771,456 | | |
| 26,422 | | |
| 3.78 | |
| | |
| | | |
| | | |
| | | |
| | | |
| | | |
| | | |
| | | |
| | | |
| | |
| Allowance for loan
losses | |
| (19,940 | ) | |
| | | |
| | | |
| (19,294 | ) | |
| | | |
| | | |
| (18,723 | ) | |
| | | |
| | |
| Cash and due from
banks | |
| 85,951 | | |
| | | |
| | | |
| 70,292 | | |
| | | |
| | | |
| 88,745 | | |
| | | |
| | |
| Premises and equipment | |
| 55,139 | | |
| | | |
| | | |
| 54,436 | | |
| | | |
| | | |
| 47,379 | | |
| | | |
| | |
| Intangible assets | |
| 34,457 | | |
| | | |
| | | |
| 35,185 | | |
| | | |
| | | |
| 33,803 | | |
| | | |
| | |
| Bank owned life insurance | |
| 43,419 | | |
| | | |
| | | |
| 41,934 | | |
| | | |
| | | |
| 24,417 | | |
| | | |
| | |
| Other assets | |
| 109,809 | | |
| | | |
| | | |
| 107,150 | | |
| | | |
| | | |
| 89,984 | | |
| | | |
| | |
| | |
| | | |
| | | |
| | | |
| | | |
| | | |
| | | |
| | | |
| | | |
| | |
| | |
$ | 3,463,277 | | |
| | | |
| | | |
$ | 3,373,858 | | |
| | | |
| | | |
$ | 3,037,061 | | |
| | | |
| | |
| | |
| | | |
| | | |
| | | |
| | | |
| | | |
| | | |
| | | |
| | | |
| | |
| Liabilities and
Shareholders' Equity | |
| | | |
| | | |
| | | |
| | | |
| | | |
| | | |
| | | |
| | | |
| | |
| Interest-bearing liabilities: | |
| | | |
| | | |
| | | |
| | | |
| | | |
| | | |
| | | |
| | | |
| | |
| Interest-bearing demand | |
$ | 666,640 | | |
$ | 129 | | |
| 0.08 | % | |
$ | 621,365 | | |
$ | 116 | | |
| 0.07 | % | |
$ | 585,895 | | |
$ | 112 | | |
| 0.08 | % |
| Savings | |
| 292,761 | | |
| 39 | | |
| 0.05 | | |
| 285,410 | | |
| 39 | | |
| 0.05 | | |
| 263,066 | | |
| 42 | | |
| 0.06 | |
| Money market | |
| 664,512 | | |
| 430 | | |
| 0.26 | | |
| 637,840 | | |
| 407 | | |
| 0.25 | | |
| 457,364 | | |
| 143 | | |
| 0.12 | |
| Time deposits | |
| 299,189 | | |
| 265 | | |
| 0.35 | | |
| 308,184 | | |
| 295 | | |
| 0.38 | | |
| 327,327 | | |
| 375 | | |
| 0.45 | |
| Federal funds purchased
and | |
| | | |
| | | |
| | | |
| | | |
| | | |
| | | |
| | | |
| | | |
| | |
| other short term borrowings | |
| 168,444 | | |
| 89 | | |
| 0.21 | | |
| 183,494 | | |
| 112 | | |
| 0.24 | | |
| 227,806 | | |
| 97 | | |
| 0.17 | |
| Other borrowings | |
| 119,927 | | |
| 863 | | |
| 2.85 | | |
| 118,961 | | |
| 843 | | |
| 2.81 | | |
| 114,560 | | |
| 770 | | |
| 2.67 | |
| | |
| | | |
| | | |
| | | |
| | | |
| | | |
| | | |
| | | |
| | | |
| | |
| Total
Interest-Bearing Liabilities | |
| 2,211,473 | | |
| 1,815 | | |
| 0.33 | | |
| 2,155,254 | | |
| 1,812 | | |
| 0.33 | | |
| 1,976,018 | | |
| 1,539 | | |
| 0.31 | |
| | |
| | | |
| | | |
| | | |
| | | |
| | | |
| | | |
| | | |
| | | |
| | |
| Noninterest demand | |
| 878,709 | | |
| | | |
| | | |
| 849,468 | | |
| | | |
| | | |
| 728,410 | | |
| | | |
| | |
| Other liabilities | |
| 19,703 | | |
| | | |
| | | |
| 20,235 | | |
| | | |
| | | |
| 13,400 | | |
| | | |
| | |
| Total
Liabilities | |
| 3,109,885 | | |
| | | |
| | | |
| 3,024,957 | | |
| | | |
| | | |
| 2,717,828 | | |
| | | |
| | |
| | |
| | | |
| | | |
| | | |
| | | |
| | | |
| | | |
| | | |
| | | |
| | |
| Shareholders' equity | |
| 353,392 | | |
| | | |
| | | |
| 348,901 | | |
| | | |
| | | |
| 319,233 | | |
| | | |
| | |
| | |
| | | |
| | | |
| | | |
| | | |
| | | |
| | | |
| | | |
| | | |
| | |
| | |
$ | 3,463,277 | | |
| | | |
| | | |
$ | 3,373,858 | | |
| | | |
| | | |
$ | 3,037,061 | | |
| | | |
| | |
| | |
| | | |
| | | |
| | | |
| | | |
| | | |
| | | |
| | | |
| | | |
| | |
| Interest expense as
a % of earning assets | |
| | | |
| | | |
| 0.23 | % | |
| | | |
| | | |
| 0.23 | % | |
| | | |
| | | |
| 0.22 | % |
| Net
interest income as a % of earning assets | |
| | | |
$ | 29,216 | | |
| 3.67 | % | |
| | | |
$ | 29,130 | | |
| 3.75 | % | |
| | | |
$ | 24,883 | | |
| 3.56 | % |
| (1) | On a fully taxable equivalent basis. All yields and
rates have been computed on an annualized basis using amortized cost. Fees on loans have been included in interest on loans. Nonaccrual
loans are included in loan balances. |
| CONSOLIDATED QUARTERLY FINANCIAL DATA |
(Unaudited) |
| SEACOAST BANKING CORPORATION OF FLORIDA AND SUBSIDIARIES |
| | |
2015 | | |
2014 | |
| (Dollars in thousands) | |
Fourth Quarter | | |
Third Quarter | | |
Second Quarter | | |
First Quarter | | |
Fourth Quarter | |
| | |
| | |
| | |
| | |
| | |
| |
| Customer Relationship Funding (Period End) | |
| | | |
| | | |
| | | |
| | | |
| | |
| Noninterest demand | |
| | | |
| | | |
| | | |
| | | |
| | |
| Commercial | |
$ | 592,621 | | |
$ | 619,960 | | |
$ | 561,742 | | |
$ | 546,876 | | |
$ | 481,327 | |
| Retail | |
| 198,077 | | |
| 182,381 | | |
| 180,484 | | |
| 191,262 | | |
| 190,120 | |
| Public funds | |
| 46,300 | | |
| 47,765 | | |
| 47,913 | | |
| 38,529 | | |
| 41,201 | |
| Other | |
| 17,449 | | |
| 19,771 | | |
| 18,290 | | |
| 16,669 | | |
| 12,590 | |
| | |
| 854,447 | | |
| 869,877 | | |
| 808,429 | | |
| 793,336 | | |
| 725,238 | |
| | |
| | | |
| | | |
| | | |
| | | |
| | |
| Interest-bearing demand | |
| | | |
| | | |
| | | |
| | | |
| | |
| Commercial | |
| 77,500 | | |
| 69,037 | | |
| 60,411 | | |
| 66,532 | | |
| 58,173 | |
| Retail | |
| 479,056 | | |
| 443,022 | | |
| 410,601 | | |
| 416,766 | | |
| 407,653 | |
| Public funds | |
| 178,193 | | |
| 106,285 | | |
| 128,256 | | |
| 151,556 | | |
| 186,527 | |
| | |
| 734,749 | | |
| 618,344 | | |
| 599,268 | | |
| 634,854 | | |
| 652,353 | |
| | |
| | | |
| | | |
| | | |
| | | |
| | |
| Total transaction accounts | |
| | | |
| | | |
| | | |
| | | |
| | |
| Commercial | |
| 670,121 | | |
| 688,997 | | |
| 622,153 | | |
| 613,408 | | |
| 539,500 | |
| Retail | |
| 677,133 | | |
| 625,403 | | |
| 591,085 | | |
| 608,028 | | |
| 597,773 | |
| Public funds | |
| 224,493 | | |
| 154,050 | | |
| 176,169 | | |
| 190,085 | | |
| 227,728 | |
| Other | |
| 17,449 | | |
| 19,771 | | |
| 18,290 | | |
| 16,669 | | |
| 12,590 | |
| | |
| 1,589,196 | | |
| 1,488,221 | | |
| 1,407,697 | | |
| 1,428,190 | | |
| 1,377,591 | |
| | |
| | | |
| | | |
| | | |
| | | |
| | |
| Savings | |
| 295,851 | | |
| 286,810 | | |
| 282,588 | | |
| 272,963 | | |
| 264,738 | |
| | |
| | | |
| | | |
| | | |
| | | |
| | |
| Money market | |
| | | |
| | | |
| | | |
| | | |
| | |
| Commercial | |
| 208,520 | | |
| 225,629 | | |
| 191,061 | | |
| 185,668 | | |
| 172,417 | |
| Retail | |
| 312,756 | | |
| 306,138 | | |
| 272,853 | | |
| 274,203 | | |
| 264,725 | |
| Public funds | |
| 144,077 | | |
| 128,865 | | |
| 158,059 | | |
| 136,729 | | |
| 13,030 | |
| | |
| 665,353 | | |
| 660,632 | | |
| 621,973 | | |
| 596,600 | | |
| 450,172 | |
| | |
| | | |
| | | |
| | | |
| | | |
| | |
| Time certificates of deposit | |
| 293,987 | | |
| 306,633 | | |
| 292,919 | | |
| 312,072 | | |
| 324,033 | |
| Total Deposits | |
$ | 2,844,387 | | |
$ | 2,742,296 | | |
$ | 2,605,177 | | |
$ | 2,609,825 | | |
$ | 2,416,534 | |
| | |
| | | |
| | | |
| | | |
| | | |
| | |
| Customer sweep accounts | |
$ | 172,005 | | |
$ | 148,607 | | |
$ | 157,676 | | |
$ | 170,023 | | |
$ | 153,640 | |
| | |
| | | |
| | | |
| | | |
| | | |
| | |
| Total core customer funding (1) | |
$ | 2,722,405 | | |
$ | 2,584,270 | | |
$ | 2,469,934 | | |
$ | 2,467,776 | | |
$ | 2,246,141 | |
(1) Total deposits and customer sweep accounts, excluding
certificates of deposits.
EXHIBIT
99.2
To Form
8-K dated January 28, 2016
Final
Transcript
Customer:
Seacoast Banking Corporation
Call
Title: Fourth Quarter and Year End Earnings Conference
Confirmation
Number: 41643854
Host:
Dennis Hudson
Date:
January 29, 2016
Time/Time
Zone: 10:00 AM Eastern Time
SPEAKERS
Dennis S. Hudson – Chairman/Chief
Executive Officer
Stephen Fowle – Chief
Financial Officer
ANALYSTS
Bob Ramsey – FBR Capital
PRESENTATION
Operator:
Welcome to the Seacoast Fourth Quarter and Year-End Earnings Conference Call. My name is Christine, and I will be your operator
for today's call. At this time, all participants are in a listen-only mode. Later, we will conduct a question-and-answer session.
Please note that this conference is being recorded.
I will now
turn the call over to Denny Hudson, CEO. You may begin.
Dennis
S. Hudson: Thank you very much for joining us today for Seacoast’s fourth quarter earnings conference call. Our press
release released yesterday after the market close and slides with supplementary information are posted on our website at seacoastbanking.com.
Seacoast
Banking Corporation of Florida
Exhibit
99.2
to Form
8-K Dated January 28, 2016
Page 2
Before we
begin, I’ll direct your attention as we always do to the statement contained at the end of the press release regarding forward-looking
statements that we will be making during our call. We’ll be discussing issues that constitute forward-looking statements
within the meaning of the Securities and Exchange Act, and as a result our comments are intended to be covered within the meaning
of that act.
With me today
is Steve Fowle, our Chief Financial Officer, who will be discussing our financial and operating results. Also joining us in the
room are Chuck Cross, who leads our Commercial Banking Team; Chuck Shaffer, who heads Community Banking; David Houdeshell, our
Chief Credit Officer; and Jeff Lee, our Chief Marketing Officer. We’ll all be available to answer questions following the
conclusion of our prepared remarks.
We are very
pleased with Seacoast’s fourth quarter results, which cap a year of strategic development and operational progress in which
we grew core earnings per share on a diluted basis by 46%. Our balanced growth strategy, comprised of digital and other investments
that expand our franchise combined with selective strategic transactions that deepen market presence and enable us to market to
our acquired bank’s customers, continue to produce results for shareholders in the fourth quarter and for the year as a
whole.
Fourth quarter
revenue rose to $36.9 million, an increase of 16% year-on-year. We pulled this growth to the bottom line as well with adjusted
fourth quarter net income rising 56% to $6.5 million compared with the year-ago period. Note that the increase in adjusted income
excludes the $416,000 bargain purchase gain resulting from post-acquisition recoveries related to our acquisition of Grand Bankshares
in Palm Beach earlier this year.
Seacoast
Banking Corporation of Florida
Exhibit
99.2
to Form
8-K Dated January 28, 2016
Page 3
While our
successful integration of recent acquisitions made a meaningful contribution to our fourth quarter performance, our operating
results show the impact of our investments in organic growth. Total loans excluding acquisitions increased 12% or $218 million
compared to the same quarter last year, and the households served increased 5% organically compared with year-ago levels during
the quarter. When we include our acquisitions, our households grew this year by about 8%.
As our customers
rely less on high-cost branch and paper-based transactions and more on lower cost digital operations we provide them, Seacoast
has reaped substantial operating efficiency. We are enormously pleased with some of the other results during the fourth quarter.
More than 10% of deposit accounts were opened outside the branch, up from virtually none in 2014. Nearly 30% of deposits were
made outside of our branch network compared with around 20% in late 2014, and consumer loans originated outside of our branches
averaged 24% of total consumer loans compared to zero in 2014.
Turning to
acquisitions, the integration of recently acquired BankFIRST in Orlando and Grand Bankshares in Palm Beach made meaningful contributions
to the quarter's results. Both acquisitions grew households served by the 90-day mark following the close of those transactions.
Growth in our Orlando franchise in the first year following the integration has exceeded our expectations with households rising
7%. So, not only have these acquisitions scaled up our level of households, they’re also now contributing to higher organic
growth.
The acquisition
of BankFIRST in Orlando, which occurred just over a year ago, has served as a cornerstone for our expansion in Central Florida
and set the stage for the acquisition of BMO Harris’ Orlando banking operations which we announced in October, and Floridian
Bank which we announced in November. These transactions will make us a top ten Orlando bank and a top five Florida-based bank
based on deposits.
Seacoast
Banking Corporation of Florida
Exhibit
99.2
to Form
8-K Dated January 28, 2016
Page 4
We have received
regulatory approval for both of these transactions, and we expect to close the Floridian acquisition late in the first quarter
and the BMO Harris branch purchase late in the second quarter. We look forward to welcoming more than 14,000 new households to
the Seacoast family once these transactions are completed.
The tremendous
flexibility of our technology platform enables us to more quickly optimize locations without diminishing customer service and
product delivery. We consolidated three branches during 2015 with very minimal customer impact and anticipate that we will consolidate
an additional four legacy locations in the first half of 2016. Again, as our customers discover greater convenience, we can adjust
the pace of consolidation.
We closed
out 2015 well-positioned to drive further increases in shareholder value. As we consider our business today and our vision for
continued execution of our balanced growth strategy, we expect to produce earnings per share of $1 in 2016 and a substantial increase
in our earnings run rate as we exit the year. We continue to commit to maintaining a disciplined approach to growing our balance
sheet with a focus on organic growth, and we believe we will continue to drive long-term shareholder value.
With that,
I’d like to turn the call over to Steve Fowle, our Chief Financial Officer, to discuss some results for the quarter, and
afterwards we look forward to your questions. Steve?
Stephen
A. Fowle: Thank you, Denny, and thanks to all of you for taking the time to join us this morning. Our fourth quarter results
improved both year-over-year and sequentially, showing the operating leverage inherent in Seacoast’s commercial loan origination
and out-of-branch consumer transaction convenience.
Seacoast
Banking Corporation of Florida
Exhibit
99.2
to Form
8-K Dated January 28, 2016
Page 5
Fourth quarter diluted EPS rose to $0.18 per share compared with a $0.05 loss
in the year-ago period. Net income was $6 million compared to a fourth quarter loss of $1.5 million last year.
Adjusted
earnings, factoring out merger-related and other non-core items, was $6.5 million or $0.19 per diluted share, up 46% from $0.13
in the fourth quarter last year and nearly flat linked quarter. For the year as a whole, earnings per share more than tripled
to $0.66 per share in 2015 as strong, prudent loan growth combined with successful acquisitions to grow margin and operating leverage.
As with past
quarters, we continue to drive growth by leveraging our investment in digital analytics as well as our commercial banking service
offering. As Denny mentioned, customer acquisition remained strong, and households grew at a 5% annualized quarterly rate matching
organic household growth rate of 5% for all of 2015.
Loans increased
$57 million or 3% sequentially and 18% over the last year, and 12% after adjusting for the Grand acquisition. Much of this quarter's
growth came late in the quarter, and again, this growth was attained while maintaining a diverse, granular, self-originated loan
portfolio with an average Q4 loan size of $139,000.
Deposit growth
accelerated with seasonal public fund inflows. Deposits increased $102 million or 4%, not annualized, from third quarter levels.
Year-over-year deposits grew $428 million or 18%, 10% when adjusted for acquisitions. Of note, non-interest demand deposits represent
a strong 30% of deposits. Including interest checking, demand deposits represent 56% of total deposits, and our overall cost of
deposits stands at just 12 basis points.
Seacoast
Banking Corporation of Florida
Exhibit
99.2
to Form
8-K Dated January 28, 2016
Page 6
Turning to
our income statement, the net income was impacted by two notable items this quarter. First, during the fourth quarter we had recoveries
from loans and REO acquired from Grand Bank. These recoveries exceeded the provisional mark we had made for the assets at the
time of the transaction. When the revised value associated with the assets was recorded, in accordance with GAAP, we eliminated
Grand’s goodwill and recorded approximately $416,000 of bargain purchase gain. This was a $1.6 million swing in valuation
from previous estimates.
Second, we
made progress in our pending acquisition of Floridian and our BMO Harris Orlando branch purchase. Costs related to these acquisitions
and other adjusting entries are noted in our press release. As Denny stated, we recently received regulatory approval for both
acquisitions.
With these
adjustments, we recorded an adjusted EPS of $0.19, as follows.
During the
quarter, we recorded $29.1 million in net interest income or a NIM of 3.67%. Net interest income improved a strong $4.4 million
or 18% from prior year levels and was up slightly linked quarter. The linked quarter improvement is notable as Q3 included about
$700,000 to $800,000 or 10 basis points in excess purchase loan accretion largely due to modifications of current relationships
during that third quarter. We recorded essentially no excess purchase loan accretion in Q4.
Net interest
margin improved 11 basis points from Q4 2014 and was down 8 basis points sequentially. Remember, though, that Q3 had about 10
basis points of NIM from excess loan appreciation. So, directionally, margin continues to see upside. We’ve been successful
in driving fundamental margin and net interest income improvement as we’ve enhanced our balance sheet mix and as we’ve
actively managed asset yields.
Seacoast
Banking Corporation of Florida
Exhibit
99.2
to Form
8-K Dated January 28, 2016
Page 7
For next
quarter, we expect a slight increase in net interest income as growth is offset by a shorter quarter, and relatively flat to slightly
decreased net interest margin as benefit of loan growth is offset by $100 million in security purchases made at the end of 2015,
in December, in anticipation of liquidity from the upcoming BMO Harris branch purchase.
As we progress
through 2016, organic growth and acquisitions will add substantially to net interest income, but margin will be diluted as we
initially deploy liquidity from our branch purchase into securities.
Adjusted
fee income was up a strong 9% from 2014 levels, reflecting household growth. Notably, interchange income, a good measure of customer
growth and engagement, increased 24% from prior year levels. Debit card transaction volume hit a record for Seacoast in the fourth
quarter. Linked quarter, fee income decreased $300,000 to $7.8 million as holiday-driven slowdowns in mortgage banking, brokerage,
and marine fees outweighed activity related fee increases in areas like interchange.
Overall in
2015, our fee growth outpaced customer acquisition rates. We see additional opportunity for outsized growth in 2016 as we further
penetrate our new markets for Seacoast with fee-based businesses like mortgage and wealth.
Fourth quarter
expenses showed decreases from both fourth quarter 2014 and sequential quarter comparisons. Both prior periods contain significant
adjusting entries related to merger and other non-core activity. Adjusted, expenses were up $200,000, less than 1% sequentially,
and rose $1.6 million or 6% from prior year levels. The linked quarter increase included small increases in areas like occupancy
and data processing, somewhat offset by decreases in salary and benefits. Such volatility quarter-to-quarter can be expected.
Compared to the year ago period, increases reflect investments we’ve made in our franchise including acquisitions, talent
acquisition, and other investments in our business strategy, and variable costs associated with growth of the franchise.
Seacoast
Banking Corporation of Florida
Exhibit
99.2
to Form
8-K Dated January 28, 2016
Page 8
I want to
remind you that first quarter typically faces decreased revenues from lower number of days in the quarter and noticeably higher
expenses particularly in payroll tax and benefit costs. This dynamic will run against the positive impact of our continued growth.
For the remainder of the year, we expect organic growth, combined with our in-market acquisitions, to drive efficiency down to
the low 60s.
With that
said, I wanted to turn back to a comment Denny made about goals for this year. We are providing an adjusted EPS target of $1 per
share for 2016. This reinforces our continued progress on earnings performance. More importantly, this kind of performance signposts
the results we believe our strategy can continue to provide.
We’re
positioned to benefit from investments we've made and continue to make in our business strategy and franchise that will produce
margin and operating leverage organically. We also have built a strong core funding franchise. More than half our deposits are
solid core checking accounts, and our cost to deposits as a result is a low 12 basis points.
We anticipate
that a rising rate environment in 2016 will illuminate the value of this customer base through improved net interest income and
margin. Finally, we’re scheduled to close two acquisitions in the first half of the year, the Floridian acquisition scheduled
late this quarter and the BMO Harris branch purchase late in the second quarter. These acquisitions both have strong IRRs and
will be accretive to earnings per share excluding merger costs and short-term transaction-related expense.
Seacoast
Banking Corporation of Florida
Exhibit
99.2
to Form
8-K Dated January 28, 2016
Page 9
To put numbers
to our outlook, we’re heading into 2016 with $0.19 per quarter run rate that translates to $0.76 per share annualized. The
forward rate curve, and we use this rate curve as a best guess to what will happen in 2016, will add about $0.06 or more to our
results. With those factors out of our control, the first rate hike did happen already and represents the sizeable portion of
this success.
2016 M&A
activity, again excluding non-recurring costs, will add $0.04 to $0.06, plus or minus, to our earnings as we successfully integrate
operations. And this benefit will be an annuity as we have had great success in cross selling into and further growing in our
acquired markets at a rate often in excess of our core franchise.
Finally,
organic growth and core operating performance, definitely in our control, will add an additional $0.12 to $0.14 to our bottom
line, and this operating leverage improvement is anticipated despite past and continued significant investment in our business
model. So, as you look at these forward thoughts, you will note us coming into the year with the flattish first quarter, and our
performance will accelerate as we go through the year.
We look forward
to executing on 2016 as the next step in our business plan. With that said, now I’ll turn the call back over to Denny.
Dennis
S. Hudson: Thank you very much, Steve. We’re happy to take a few questions.
Operator:
Thank you. (Operator instructions.) Our first question is from Bob Ramsey of FBR. Please go ahead.
Dennis
S. Hudson: Good morning.
Seacoast
Banking Corporation of Florida
Exhibit
99.2
to Form
8-K Dated January 28, 2016
Page 10
Bob Ramsey:
Sorry about that. I had my mute button on. Good morning. I guess I was hoping maybe you could talk a little bit about the
efficiency assumption that underlies your 2016 guidance. I'm curious not only where you see things overall, but maybe where you
end the year once you have both of these acquisitions folded in?
Dennis
S. Hudson: Steve, you want to take that?
Stephen
A. Fowle: Yes. So, we anticipate with organic growth that we’ll have nice operating leverage, probably about 4% to 5%
operating leverage as we go through the year on some really strong organic loan growth. That operating leverage will start to
drive our efficiency ratio down, but as we pick up the acquisitions and integrate them and realize the efficiencies through those
acquisitions, we think we can get our efficiency ratio down in the low 60s by the end of the year.
Dennis
S. Hudson: And I think the key thought behind the acquisitions, we have a franchise in Orlando going into those transactions,
and adding these two franchises on top of our existing investment there creates tremendous improvement in our operating leverage
in that market. Lots of consolidation work will occur as a result of the combination and putting all three together, and so we
have some pretty nice upside coming out of that, as Steve described earlier, in the path to $1 a share. I think continued good
execution of our strategic plan really gets us there, and I'm pretty confident about it.
Bob Ramsey:
Okay. You may have given this detail, and I might have missed it, but the BMO branch deal, I think the release said late 2Q
is when you anticipate that closing. Is it fair to model it at June 30 or do you have the better sense of what the timing might
look like?
Seacoast
Banking Corporation of Florida
Exhibit
99.2
to Form
8-K Dated January 28, 2016
Page 11
Stephen
A. Fowle: Yes. I think by June 30 we’ll have the transaction closed. Again, we’re expecting a late Q2 probably
June-ish type of an integration.
Bob Ramsey:
Okay. And can you remind me, is there much seasonality in the expense number in the first quarter for, I don’t know,
annual increases or FICA or 401(k) match or anything else?
Stephen
A. Fowle: Yes, there definitely is. So, first quarter, fee income is hurt because there is a shorter number of days. Expenses
are hurt because we now have people in the company that haven’t capped on social security. We have payroll taxes as a result
that are higher. We have bonus payments and 401(k) matches accelerate at that time of the year. So, typically Q1 for us and for
most companies is a tough quarter, but as I was concluding my remarks I gave some insight in the fact that Q1 is probably pretty
flattish to where we are.
Bob Ramsey:
Okay, great. Thank you very much.
Dennis
S. Hudson: And I think, Bob, the other thing to keep in mind is, as Steve said earlier, we see steady improvement as we go
through the year, but we have the added boost of the additional size as we get into the second half of the year. And so again,
we kind of start out flattish, have some nice growth, and then it really begins to accelerate as we hit the backend of the year
and feel the positive impacts of the M&A. So, continued organic growth, the M&A impacts and also the cost opportunity
that we laid out in our remarks really affect fully the back half of the year.
Bob Ramsey:
Great. Thank you very much.
Seacoast
Banking Corporation of Florida
Exhibit
99.2
to Form
8-K Dated January 28, 2016
Page 12
Operator:
Thank you. (Operator instructions.) And I’m showing no further questions, so I’ll turn the call back over to Denny
Hudson.
Dennis
S. Hudson: Okay, well, thank you very much for attending today, and we look forward to updating everybody following the conclusion
of Q1. Thank you.
Operator:
Thank you. And thank you, ladies and gentlemen. This concludes today’s conference. Thank you for participating. You
may now disconnect.
Exhibit 99.3

Fourth Quarter 2015 Fourth Quarter 2015 January 29, 2016 Contact : (email) Steve.Fowle@SeacoastBank.com (phone) 772.463.8977 (web) www.Sea coa stBanking.com

Fourth Quarter 2015 This presentation contains “forward - looking statements” within the meaning of Section 27 A of the Securities Act of 1933 and Section 21 E of the Securities Exchange Act of 1934 , including, without limitation, statements about future financial and operating results, ability to realized deferred tax assets, cost savings, enhanced revenues, economic and seasonal conditions in our markets, and improvements to reported earnings that may be realized from cost controls and for integration of banks that we have acquired, as well as statements with respect to Seacoast’s objectives, expectations and intentions and other statements that are not historical facts . Actual results may differ from those set forth in the forward - looking statements . Forward - looking statements include statements with respect to our beliefs, plans, objectives, goals, expectations, anticipations, estimates and intentions, and involve known and unknown risks, uncertainties and other factors, which may be beyond our control, and which may cause the actual results, performance or achievements of Seacoast to be materially different from future results, performance or achievements expressed or implied by such forward - looking statements . You should not expect us to update any forward - looking statements . You can identify these forward - looking statements through our use of words such as “may,” “will,” “anticipate,” “assume,” “should,” “support”, “indicate,” “would,” “believe,” “contemplate,” “expect,” “estimate,” “continue,” “further”, “point to,” “project,” “could,” “intend” or other similar words and expressions of the future . These forward - looking statements may not be realized due to a variety of factors, including, without limitation : the effects of future economic and market conditions, including seasonality ; governmental monetary and fiscal policies, as well as legislative, tax and regulatory changes ; changes in accounting policies, rules and practices ; the risks of changes in interest rates on the level and composition of deposits, loan demand, liquidity and the values of loan collateral, securities, and interest sensitive assets and liabilities ; interest rate risks, sensitivities and the shape of the yield curve ; the effects of competition from other commercial banks, thrifts, mortgage banking firms, consumer finance companies, credit unions, securities brokerage firms, insurance companies, money market and other mutual funds and other financial institutions operating in our market areas and elsewhere, including institutions operating regionally, nationally and internationally, together with such competitors offering banking products and services by mail, telephone, computer and the Internet ; and the failure of assumptions underlying the establishment of reserves for possible loan losses . The risks of mergers and acquisitions, include, without limitation : unexpected transaction costs, including the costs of integrating operations ; the risks that the businesses will not be integrated successfully or that such integration may be more difficult, time - consuming or costly than expected ; the potential failure to fully or timely realize expected revenues and revenue synergies, including as the result of revenues following the merger being lower than expected ; the risk of deposit and customer attrition ; any changes in deposit mix ; unexpected operating and other costs, which may differ or change from expectations ; the risks of customer and employee loss and business disruption, including, without limitation, as the result of difficulties in maintaining relationships with employees ; increased competitive pressures and solicitations of customers by competitors ; as well as the difficulties and risks inherent with entering new markets . All written or oral forward - looking statements attributable to us are expressly qualified in their entirety by this cautionary notice, including, without limitation, those risks and uncertainties described in our annual report on Form 10 - K for the year ended December 31 , 2014 under “Special Cautionary Notice Regarding Forward - Looking Statements” and “Risk Factors”, and otherwise in our SEC reports and filings . Such reports are available upon request from the Company, or from the Securities and Exchange Commission, including through the SEC’s Internet website at http : //www . sec . gov . 2 Fourth Quarter 2015 Cautionary Notice Regarding Forward - Looking Statements

Fourth Quarter 2015 On January 22 , 2016 , Seacoast filed a definitive Proxy Statement/Prospectus with the SEC regarding the proposed merger with Floridian . This Proxy Statement/Prospectus has been mailed to Floridian shareholders . INVESTORS ARE URGED TO READ THE PROXY STATEMENT/PROSPECTUS REGARDING THE PROPOSED MERGER AND ANY OTHER RELEVANT DOCUMENTS FILED BY SEACOAST WITH THE SEC, AS WELL AS ANY AMENDMENTS OR SUPPLEMENTS TO THOSE DOCUMENTS, BECAUSE THEY DO OR WILL CONTAIN IMPORTANT INFORMATION . Investors can obtain a free copy of the Proxy Statement/Prospectus, as well as other filings containing information about Seacoast and Floridian, at the SEC’s website ( http : //www . sec . gov ), with respect to information about Seacoast, and Floridian’s website ( www . floridianbank . com ), with respect to information about Floridian . Investors can also obtain these documents, free of charge, at http : //www . seacoastbanking . com under the tab “Investor Relations” and then under the tab “Financials/Regulatory Filings . ” Copies of the Proxy Statement/Prospectus and any other filing by Seacoast with the SEC can also be obtained, free of charge, by directing a request to Investor Relations, 815 Colorado Avenue, P . O . Box 9012 , Stuart, FL 34994 , ( 772 ) 288 - 6085 . Seacoast, Floridian, their respective directors and executive officers and other members of management and employees may be considered participants in the solicitation of proxies in connection with the proposed transaction . Information about the directors and executive officers of Seacoast is set forth in its proxy statement for its 2015 annual meeting of shareholders, which was filed with the SEC on April 7 , 2015 and its Current Reports on Form 8 - K . Other information regarding the participants in the proxy solicitation and a description of their direct and indirect interests, by security holdings or otherwise, is contained in the Proxy Statement/Prospectus . You may obtain free copies of these documents as described in the preceding paragraph . 3 Fourth Quarter 2015 Legal Information

Fourth Quarter 2015 4 Financial Highlights Growth Highlights Q4 2015 Financial and Growth Highlights • Loans increased $57 million or 3%, not annualized, compared to third quarter 2015, and rose 18% year - over - year. Excluding acquisitions, loans increased $218 million or 12% above year - ago levels . • Strategic initiatives continue to pay off. Excluding acquisitions, households grew 5% year - over - year and consumer loans originated outside the branch hit a record 26% during the fourth quarter. • Adjusted revenues increased $5.0 million or 16% year - over - year to $36.9 million . • Net interest margin increased 11 basis points year - over - year to 3.67 % • Net interest income improved $4.4 million or 18%, largely due to organic loan growth . • Adjusted net income increased 56% to $6.5 million, or $ 0.19 per diluted share, compared to $4.2 million, or $0.13 per diluted share, in fourth quarter 2014. • Adjusted return on tangible common equity improved to 8.4% from 6.2% over this same period . (1) Non - GAAP measure, excludes merger related charges, branch closure expenses, and other adjustments (See Appendix for reconciliation to GAA P)

Fourth Quarter 2015 5 Agenda • About Seacoast • Earnings Highlights • Balance Sheet Trends • Income Statement Highlights • Earnings Goal – 2016 • Florida Economic Updates • Appendix

Fourth Quarter 2015 Agenda • $3.5B bank in the nation’s third most - populous state • Strong and growing presence in Orlando and Palm Beach County, two of Florida’s most attractive MSAs • Third - generation CEO; strong, engaged and independent board • Investing in innovative commercial banking platform and digital customer acquisition and cross - sell • Growth - oriented culture • Market Cap: $480 million (1/26/16) Seacoast Bank [NASDAQ: SBCF] Attractive Geography; Deep Local Roots; Benefiting from Balanced Strategy of Organic Growth Investments in Commercial Loan Platform and Digital Marketing as well as Accretive Acquisitions 6 Orlando MSA West Palm Beach MSA Retail Location Commercial Banking Location

Fourth Quarter 2015 Agenda Investment Thesis Successfully Executing a New Model for Community Bankin g 7 • Reaping benefits from strategic investments in organic growth • Successful commercial banking platform – Accelerate • Leader in using digital technology to drive customer acquisition, enable cross - sell, eliminate costs • Consistent growth in fee - generating businesses • Track record of completing value - creating acquisitions • Opportunistic deals that expand our footprint and strengthen our franchise • Proven integration capabilities • Opportunity to acquire un - optimized customer sets • Ready supply of potential targets • Robust risk management and controls yielding consistent results • Action - oriented management team, engaged and experienced board that is aligned with shareholders • Well - positioned to benefit from resurgent Florida economy

Fourth Quarter 2015 Seacoast Bank – Evidence of Success 8 (1) Non - GAAP measure, excludes merger related charges, branch closure expenses, and other adjustments (See Appendix for reconciliati on to GAAP) 280% 64% 26% 18% Pre Tax & Provision Revenue Revenue Expenses Total Growth 1 Compound Annual Growth FY ‘12 – FY ‘15 Annualized 56% 8 %

Fourth Quarter 2015 9 Agenda • About Seacoast • Earnings Highlights • Balance Sheet Trends • Income Statement Highlights • Earnings Goal – 2016 • Florida Economic Updates • Appendix

Fourth Quarter 2015 Earnings Improvement Trend 10 (1) Non - GAAP measure, excludes merger related charges, branch closure expenses, and other adjustments (See Appendix for reconciliati on to GAAP) • Net Income increased to $6.0 million, compared to a $1.5 million net loss from Q4 2014 • Adjusted net income (1) of $6.5 million was up $2.3 million or 56% from the prior year (Dollars in thousands) Fourth Quarter 2015 Third Quarter 2015 Second Quarter 2015 First Quarter 2015 Fourth Quarter 2014 GAAP Net Income $6,036 $4,441 $5,805 $5,859 ($1,517) GAAP Earnings per diluted share $0.18 $0.13 $ 0.18 $0.18 ($0.05) Adjusted Net Income (1) $6,520 $6,433 $ 6,172 $6,177 $4,179 Adjusted Pretax, pre - provision income (1) $10,913 $11,328 $ 10,815 $10,342 $7,464 Adjusted Earnings per diluted share (1) $0.19 $0.19 $0.19 $ 0.19 $0.13 Average shares outstanding (000) 34,395 34,194 33,234 33,136 33,124

Fourth Quarter 2015 11 Agenda • About Seacoast • Earnings Highlights • Balance Sheet Trends • Income Statement Highlights • Earnings Goal – 2016 • Florida Economic Updates • Appendix

Fourth Quarter 2015 Loan Growth Momentum Continues 12 $1,822 $1,854 $1,937 $2,099 $2,156 $1,000 $1,200 $1,400 $1,600 $1,800 $2,000 $2,200 Q4-14 Q1-15 Q2-15 Q3-15 Q4-15 Total Loans Outstanding (in millions) Total loans were $ 2.2 billion at December 31, 2015, up $334 million or 18% from the prior year.

Fourth Quarter 2015 Deposit Balances Extend Growth Trends 13 Total deposits increased 18% to $2.84 billion at December 31, 2015 from year - ago levels. Cost of deposits at a low 12 basis points. $728 $754 $796 $849 $879 $1,307 $1,416 $1,499 $1,545 $1,624 $327 $318 $304 $308 $299 $0 $500 $1,000 $1,500 $2,000 $2,500 $3,000 Q4-14 Q1-15 Q2-15 Q3-15 Q4-15 Non Interest Bearing Low Cost Deposits Time Deposits Average Deposit Balances (in millions) $2,362 $2,488 $2,599 $2,702 89% $2,802

Fourth Quarter 2015 14 Agenda • About Seacoast • Earnings Highlights • Balance Sheet Trends • Income Statement Highlights • Earnings Goal – 2016 • Florida Economic Updates • Appendix

Fourth Quarter 2015 Net Interest Income and Margin 15 $24,883 $25,834 $25,788 $29,130 $29,216 3.56% 3.62% 3.50% 3.75% 3.67% 3.00% 3.20% 3.40% 3.60% 3.80% 4.00% 4.20% $0 $5,000 $10,000 $15,000 $20,000 $25,000 $30,000 $35,000 Q4-14 Q1-15 Q2-15 Q3-15 Q4-15 Net Interest Income and Net Interest Margin* ($ in thousands) • Net interest margin for the quarter increased 11 basis points year – over - year to 3.67%, versus 3.56% in Q4 2014. • Net interest income for the quarter totaled $29.2 million, up $4.3 million or 17% increase from a year ago. *Calculated on a fully taxable equivalent basis using amortized cost.

Fourth Quarter 2015 Non Interest Income 16 $2,208 $2,002 $2,115 $2,217 $2,229 $1,603 $1,737 $2,033 $1,925 $1,989 $1,212 $1,242 $1,335 $1,385 $1,302 $716 $1,088 $1,032 $1,177 $955 $1,150 $909 $1,272 $1,012 $911 $330 $334 $366 $396 $0 $1,000 $2,000 $3,000 $4,000 $5,000 $6,000 $7,000 $8,000 $9,000 $10,000 Q4-14 Q1-15 Q2-15 Q3-15 Q4-15 BOLI Other Income Mortgage Banking Fees Wealth Management Fees Interchange Income Service Charges Non Interest Income (in thousands)* $7,308 $8,121 $7,141 *Non interest income before: securities gains and bargain purchase gain, net ** Q2 - 15 excludes $725,000 gain on participation loans and Q4 - 15 excludes $416,000 gain on bargain purchase. • Noninterest income excluding security gains and the bargain purchase gain, totaled $7.8 million for the fourth quarter , an increase of $0.6 million or 9% from a year ago $8,082 $7,782

Fourth Quarter 2015 Non Interest Expense 17 $12,459 $11,192 $11,814 $13,236 $13,124 $1,925 $2,184 $2,235 $2,279 $2,457 $3,426 $3,251 $3,272 $3,604 $3,678 $6,598 $6,048 $6,376 $6,645 $6,706 $0 $5,000 $10,000 $15,000 $20,000 $25,000 $30,000 Q4-14 Q1-15 Q2-15 Q3-15 Q4-15 Other Occupancy / Telephone Data Processing Cost Salaries and Benefits Non Interest Expense (1) (in thousands) $22,675 $23,697 $24,408 • Noninterest expenses decreased $2.0 million from the third quarter, 2015 • Excluding merger related charges and other one - time items , adjusted noninterest expense (1) grew $0.2 million, less than 1%. $25,764 $25,965 (1) Non - GAAP measure, excludes merger related charges, branch closure expenses, and other adjustments (See Appendix for reconciliation to GAA P)

Fourth Quarter 2015 18 Transforming Our Business Still in the early innings of our transformation, but already seeing results which position us as unique to other community banks. x Alternative Sales x Alternative Service x Online Fulfillment x Analytics x Marketing Automation x Cross Sell x Training x Digital Marketing Outside of Branch Dec 2015 Q4 2015 Q3 2015 Q4 2014 % of Checks Deposited 28.5% 27.74% 25.5% 20.9% % of Deposit Accounts Opened 10.40% 10.26% 8.31% 0.60% % of Consumer Loans Opened 24.42% 22.21% 17.07% 6.30%

Fourth Quarter 2015 19 Agenda • About Seacoast • Earnings Highlights • Balance Sheet Trends • Income Statement Highlights • Earnings Goal – 2016 • Florida Economic Updates • Appendix
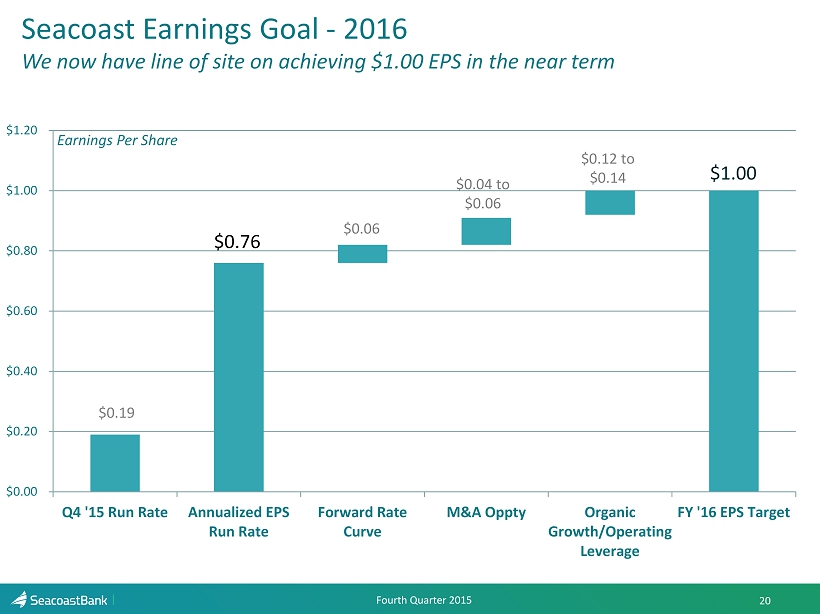
Fourth Quarter 2015 Agenda Seacoast Earnings Goal - 2016 We now have line of site on achieving $1.00 EPS in the near term 20 $0.00 $0.20 $0.40 $0.60 $0.80 $1.00 $1.20 Q4 '15 Run Rate Annualized EPS Run Rate Forward Rate Curve M&A Oppty Organic Growth/Operating Leverage FY '16 EPS Target $0.19 $0.76 $ 0.04 to $ 0.06 $ 0.12 to $ 0.14 $ 0.06 $1.00 Earnings Per Share

Fourth Quarter 2015 21 Agenda • About Seacoast • Earnings Highlights • Balance Sheet Trends • Income Statement Highlights • Earnings Goal – 2016 • Florida Economic Updates • Appendix

Fourth Quarter 2015 22 Florida’s Unemployment Rate

Fourth Quarter 2015 23 Florida’s Economic Improvement • Employment overall grew 2.9% YOY in Florida vs 1.9% for the nation. • Unemployment in December was down to 5.0%, a drop of 0.7% from a year ago. • Strongest sectors were education and health services, leisure & hospitality, education & health, trade, transportation and utilities, construction, financial and manufacturing.

Fourth Quarter 2015 24 Agenda • About Seacoast • Earnings Highlights • Balance Sheet Trends • Income Statement Highlights • Earnings Goal – 2016 • Florida Economic Updates • Appendix

Fourth Quarter 2015 Explanation of Certain Unaudited Non - GAAP Financial M easures This presentation contains financial information determined by methods other than Generally Accepted Accounting Principles (“GAAP”) . The financial highlights provide reconciliations between GAAP net income and adjusted net income, GAAP income and adjusted pretax, preprovision income . Management uses these non - GAAP financial measures in its analysis of the Company’s performance and believes these presentations provide useful supplemental information, and a clearer understanding of the Company’s performance . The Company believes the non - GAAP measures enhance investors’ understanding of the Company’s business and performance . These measures are also useful in understanding performance trends and facilitate comparisons with the performance of other financial institutions . The limitations associated with operating measures are the risk that persons might disagree as to the appropriateness of items comprising these measures and that different companies might calculate these measures differently . The Company provides reconciliations between GAAP and these non - GAAP measures . These disclosures should not be considered an alternative to GAAP . 25

Fourth Quarter 2015 Net Income - GAAP to Non - GAAP Reconciliation (Q4 14 – Q4 15) Presented below is net income excluding adjustments for merger related charges, branch closure charges, and other non core expenses. The Company believes that these results of operations are a more meaningful depiction of the underlying fundamentals of its business and ove rall performance. (1) Non - GAAP measure, excludes merger related charges, branch closure expenses, and other adjustments (See Appendix for reconciliation to GAA P) 26 (Dollars in thousands except per share data) Fourth Quarter 2015 Third Quarter 2015 Second Quarter 2015 First Quarter 2015 Fourth Quarter 2014 Net income $6,036 $4,441 $5,805 $5,859 ($1,517) Severance 187 98 29 12 478 Merger related charges 1,043 2,692 337 275 2,722 Bargain purchase gain (416) 0 0 0 0 Branch closure charges and costs related to expense initiatives 0 121 0 0 4,261 Marketing and brand refresh expense 0 0 0 0 697 Stock compensation expense and other incentive costs related to improved outlook 0 0 0 0 1,213 Securities (gains) (1) (160) 0 0 (108) Miscellaneous losses 48 112 0 0 119 Net loss on OREO and repossessed assets (157) 262 53 81 9 Asset dispositions expense 79 77 173 143 103 Effective tax rate on adjustments (299) (1,210) (225) (193) (3,798) Adjusted Net Income (1) 6,520 6,433 6,172 6,177 4,179 Provision for loan losses 369 987 855 433 118 Income taxes 4,024 3,908 3,788 3,732 3,167 Adjusted pretax, pre-provision income (1) $10,913 $11,328 $10,815 $10,342 $7,464 Adjusted earnings per diluted share (1) $0.19 $0.19 $0.19 $0.19 $0.13 Average shares outstanding (000) 34,395 34,194 33,234 33,136 33,124

Fourth Quarter 2015 Net Income - GAAP to Non - GAAP Reconciliation (Q4 14 – Q4 15) Presented below is net income excluding adjustments for merger related charges, branch closure charges, and other non core expenses. The Company believes that these results of operations are a more meaningful depiction of the underlying fundamentals of its business and ove rall performance. (1) Non - GAAP measure, excludes merger related charges, branch closure expenses, and other adjustments (See Appendix for reconciliation to GAA P) 27 Fourth Third Second First Fourth (Dollars in thousands) Quarter Quarter Quarter Quarter Quarter 2015 2015 2015 2015 2014 Noninterest Expense: Salaries and wages $ 10,948 $ 10,806 $ 9,273 $ 8,777 $ 9,998 Employee benefits 2,178 2,430 2,541 2,415 2,461 Outsourced data processing costs 2,457 2,279 2,235 2,184 1,925 Telephone / data lines 412 446 443 496 419 Occupancy expense 2,314 2,275 2,010 2,023 2,325 Furniture and equipment expense 952 883 819 732 683 Marketing expense 1,128 1,063 1,225 975 1,072 Legal and professional fees 1,568 1,651 1,255 1,388 1,741 FDIC assessments 551 552 520 589 476 Amortization of intangibles 397 397 315 315 446 Other 3,064 2,982 3,061 2,781 2,862 Total Core Operating Expense 25,969 25,763 23,697 22,675 24,408 Severance and organizational changes 187 98 29 12 478 Legal and professional fees for acquisition and expense initiatives 1043 2692 337 275 2722 Branch Closure 0 121 0 0 4261 Brand refresh expenses 0 0 0 0 697 Additional incentives for quarter and year performance 0 0 0 0 1213 Miscellaneous losses 48 112 0 0 119 Recovery of prior legal fees 0 0 0 0 0 Net loss on OREO and repossessed assets (157) 262 53 81 9 Asset disposition expense 79 77 173 143 103 Total $ 27,169 $ 29,126 $ 24,288 $ 23,186 $ 34,011
Seacoast Banking Corpora... (NASDAQ:SBCF)
Historical Stock Chart
From Mar 2024 to Apr 2024

Seacoast Banking Corpora... (NASDAQ:SBCF)
Historical Stock Chart
From Apr 2023 to Apr 2024
