UNITED STATES
SECURITIES AND EXCHANGE COMMISSION
Washington, D.C. 20549
FORM 8-K
CURRENT REPORT
Pursuant to Section 13 OR 15(d) of
the Securities Exchange Act of 1934
Date of Report (Date of earliest event reported):
February 4, 2016
ROYAL GOLD, INC.
(Exact name of registrant as specified in
its charter)
| Delaware |
001-13357 |
84-0835164 |
| (State or other jurisdiction |
(Commission |
(IRS Employer |
| of incorporation) |
File Number) |
Identification No.) |
| 1660 Wynkoop Street, Suite 1000, Denver, CO |
80202-1132 |
| (Address of principal executive offices) |
(Zip Code) |
Registrant’s telephone number, including
area code: 303-573-1660
(Former name or former address, if changed
since last report.)
Check the appropriate box below if the Form 8-K filing
is intended to simultaneously satisfy the filing obligation of the registrant under any of the following provisions (see General
Instruction A.2. below):
| o | Written
communications pursuant to Rule 425 under the Securities Act (17 CFR 230.425) |
| o | Soliciting
material pursuant to Rule 14a-12 under the Exchange Act (17 CFR 240.14a-12) |
| o | Pre-commencement
communications pursuant to Rule 14d-2(b) under the Exchange Act (17 CFR 240.14d-2(b)) |
| o | Pre-commencement
communications pursuant to Rule 13e-4(c) under the Exchange Act (17 CFR 240.13e-4(c)) |
| Item
2.02 | Results
of Operations and Financial Condition. |
On February 3, 2016,
the Company reported its second fiscal quarter 2016 financial results. A copy of the press release was issued on February 4, 2016.
A copy of the earnings presentation is furnished as Exhibit 99.1 to this Current Report on Form 8-K.
The information furnished
under this Item 2.02, including the exhibit, shall not be deemed “filed” for purposes of Section 18 of the Securities
Exchange Act of 1934, nor shall it be deemed incorporated by reference in any filing under the Securities Act of 1933, except as
shall be expressly set forth by reference to such filing.
| Item
9.01 | Financial
Statements and Exhibits. |
(d) Exhibits
Exhibit
No. |
|
Description |
| 99.1 |
|
Royal Gold, Inc. February 4, 2016 Earnings Presentation. |
SIGNATURES
Pursuant to the requirements of the Securities Exchange Act
of 1934, the Registrant has duly caused this report to be signed on its behalf by the undersigned hereunto duly authorized.
| |
Royal Gold, Inc. |
| |
(Registrant) |
| |
|
|
| Dated: February 4, 2016 |
By: |
/s/ Bruce C. Kirchhoff |
| |
|
Name: |
Bruce C. Kirchhoff |
| |
|
Title: |
Vice President, General Counsel and Secretary |
EXHIBIT INDEX
Exhibit
No. |
|
Description |
| 99.1 |
|
Royal Gold, Inc. February 4, 2016 Earnings Presentation. |
February 4, 2016 Second Quarter Fiscal 2016 Results Exhibit 99.1
Cautionary Statement February 4, 2016 2 This presentation contains certain forward-looking statements within the meaning of the Private Securities Litigation Reform Act of 1995 . Such forward - looking statements involve known and unknown risks, uncertainties, and other factors that could cause actual results to differ materially from the projections and estimates contained herein and include, but are not limited to : expected gross gold equivalent ounce production in the March 2016 quarter and beyond ; new additions to the Company’s portfolio projected to produce in the lower half of world - wide production costs ; production and mine life estimates from the operators of the Company’s properties ; the production, reserves, resources, sustaining costs, optimization, potential to expand mine life and net GEOs per year over the next five years at Pueblo Viejo ; net GEOs over the next five years at other key mines ; reserves and net GEOs expected from the Andacollo mine ; anticipated near term growth, as well as the ramp - up of production from the Mount Milligan mine ; construction progress, reserves and resources at the Wassa and Prestea, and Rainy River projects ; anticipated growth in the volume of metals subject to the Company’s royalty and stream interests ; the impact of exchange rates on the Company’s full year effective tax rate ; adequacy of liquidity ; statements concerning the Company’s market valuation ; statements and comparisons regarding the industry’s economics versus the Company’s market capitalization ; analyst valuations with and without value for Mount Milligan ; statements concerning continued operation of Mount Milligan regardless of owner ; and statements or estimates from operators of properties where we have royalty and stream interests regarding the timing of development, construction and commencement of production, or their projections of steady, increasing or decreasing production once in operation . Factors that could cause actual results to differ materially from these forward-looking statements include, among others : the risks inherent in construction, development and operation of mining properties, including those specific to new mines being developed and operated in foreign countries ; changes in gold, silver, copper, nickel and other metals prices ; performance of and production at the Company’s properties ; decisions and activities of the Company’s management ; unexpected operating costs ; decisions and activities of the operators of the Company’s royalty and stream properties ; changes in operators’ mining and processing techniques or royalty calculation methodologies ; resolution of regulatory and legal proceedings (including with Vale regarding Voisey’s Bay) ; unanticipated grade, geological, metallurgical, environmental, processing or other problems at the properties ; inaccuracies in technical reports and reserve estimates ; revisions by operators of reserves, resources, mineralization or production estimates ; changes in project parameters as plans of the operators are refined ; the results of current or planned exploration activities ; discontinuance of exploration activities by operators seeking additional financing, from the Company or third parties ; economic and market conditions ; variations between operators’ production estimates and our estimates of net GEOs ; operations on lands subject to aboriginal rights ; the ability of operators of development properties to finance construction to project completion and bring projects into production and operate them in accordance with feasibility studies ; challenges to the Company’s royalty interests, or title and other defects in the Company’s royalty properties ; errors or disputes in calculating royalty payments or stream deliveries, or payments or deliveries not made in accordance with royalty or stream agreements ; the liquidity and future financial needs of the Company ; the impact of future acquisitions and royalty and stream financing transactions ; adverse changes in applicable laws and regulations ; litigation ; and risks associated with conducting business in foreign countries, including application of foreign laws to contract and other disputes, environmental laws, enforcement and uncertain political and economic environments . These risks and other factors are discussed in more detail in the Company’s public filings with the Securities and Exchange Commission . Statements made herein are as of the date hereof and should not be relied upon as of any subsequent date . The Company’s past performance is not necessarily indicative of its future performance . The Company disclaims any obligation to update any forward-looking statements . Endnotes located on pages 16 and 17 .

Today’s Speakers Tony Jensen President and CEO Bill Heissenbuttel VP Corporate Development & Operations Stefan Wenger CFO and Treasurer 3 February 4, 2016

Q2FY16 Key Takeaways Quality Pueblo Viejo is one of the largest operating gold assets in the industry with all in sustaining costs of less than $700 and significant resource to reserve conversion potential . Mount Milligan is in the first quarter of global cash costs and exceeded design capacity in late December. Opportunity We have recently deployed capital opportunistically in a period of gold price weakness, with a focus on asset quality and current and near - term production. We believe our valuation has never been more compelling, as we trade at levels not seen since the financial crisis. Growth Record results in the December quarter were driven by our streaming business. Higher volume more than offset a lower gold price. Strong operating cash flow and existing liquidity positions us comfortably to fund our few near - term conditional commitments. 4 February 4, 2016

Record revenue of $98.1 million, an increase of 60% Record volume of 88,700 Gold Equivalent Ounces (“GEOs”) 1 , an increase of 74% Record dividends paid of $14.4 million, or 28% of operating cash flow, current yield of 3% Record Results in the Second Quarter 5 February 4, 2016 0 10,000 20,000 30,000 40,000 50,000 60,000 70,000 Sep-14 Dec-14 Mar-15 Jun-15 Sep-15 Dec-15 Record Stream Segment Sales in Q2FY16 Included Initial Contribution from Pueblo Viejo Andacollo Wassa/Prestea Mount Milligan Pueblo Viejo Stream Segment Sold 8,800 ounces from Pueblo Viejo in Dec - 15 and had 11,800 oz in inventory; includes gold only, with silver deliveries effective Jan - 16 Gross Gold Equivalent Ounces from Stream Segment
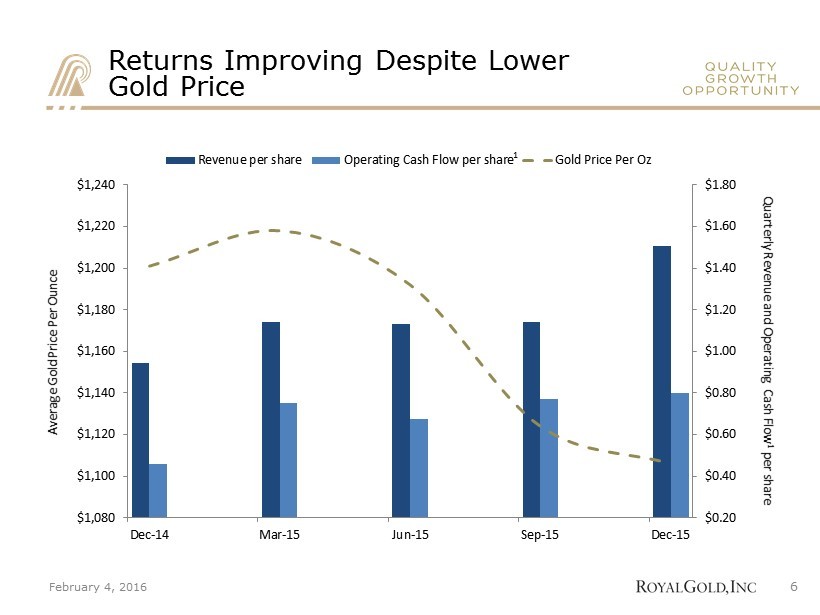
Average Gold Price Per Ounce Quarterly Revenue and Operating Cash Flow 1 per share $0.20 $0.40 $0.60 $0.80 $1.00 $1.20 $1.40 $1.60 $1.80 $1,080 $1,100 $1,120 $1,140 $1,160 $1,180 $1,200 $1,220 $1,240 Dec-14 Mar-15 Jun-15 Sep-15 Dec-15 Revenue per share Operating Cash Flow per share Gold Price Per Oz 1 6 Returns Improving Despite Lower Gold Price February 4, 2016
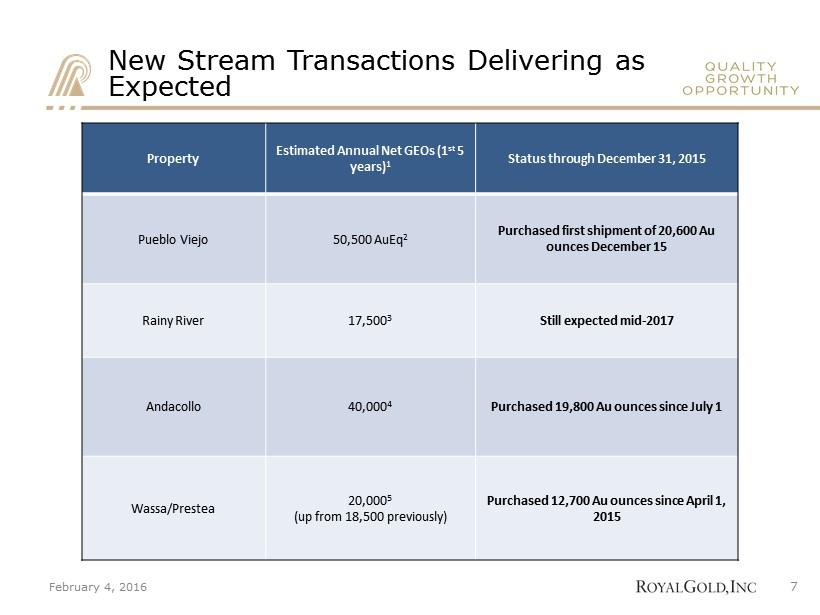
New Stream Transactions Delivering as Expected Property Estimated Annual Net GEOs (1 st 5 years) 1 Status through December 31, 2015 Pueblo Viejo 50,500 AuEq 2 Purchased first shipment of 20,600 Au ounces December 15 Rainy River 17,500 3 Still e xpected mid - 2017 Andacollo 40,000 4 Purchased 19,800 Au ounces since July 1 Wassa/Prestea 20,000 5 (up from 18,500 previously) Purchased 12,700 Au ounces since April 1, 2015 7 February 4, 2016
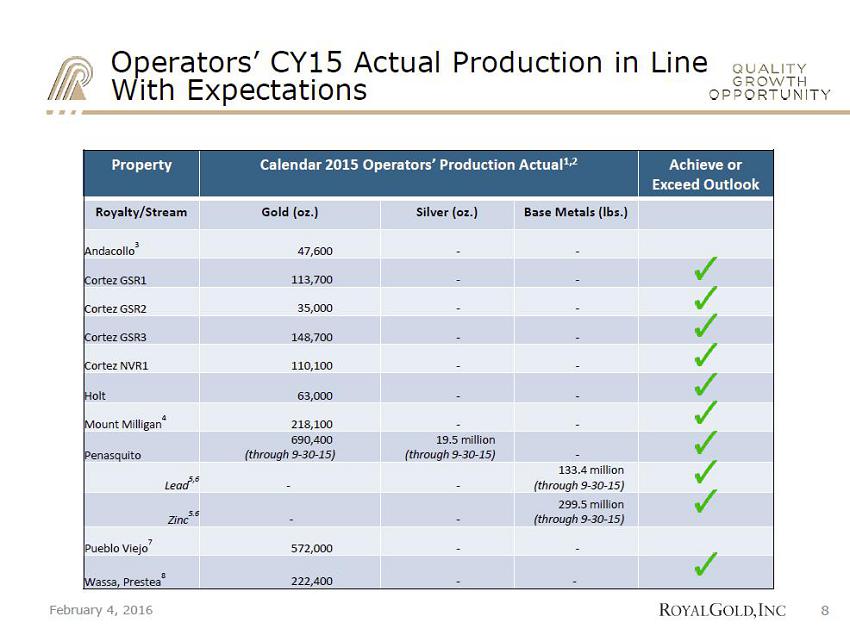
Calendar 2015 Operators
’ Production Estimate 1,2 Calendar 2015 Operators’ Production Actual 3,4 Achieve or Exceed Outlook Royalty/Stream Gold (oz.) Silver (oz.) Base Metals (lbs.) Andacollo 5 47,600 - - Cortez GSR 1 113,700 - - Cortez GSR 2 35,000 - - Cortez GSR 3 148,700 - - Cortez NVR 1 110,100 - - Holt 63,000 - - Mount Milligan 6 218,100 - - Penasquito 7,8 690,400 (through 9 - 30 - 15 ) 19.5 million (through 9 - 30 - 15 ) - Lead 7,8 - - 133.4 million (through 9 - 30 - 15 ) Zinc 7,8 - - 299.5 million (through 9 - 30 - 15 ) Pueblo Viejo 9 572,000 - - Wassa, Prestea 10 222,400 - - 8 Operators’ CY15 Actual Production in Line With Expectations February 4, 2016

Revenue of $98.1 million Net income of $0.23 per share Adjusted EBITDA of $70 million, equating to 71% of revenue Average cost of sales of $370 per stream ounce, down from $435 per stream ounce in prior year quarter Expected DD&A of $ 450 - $ 500 per GEO for FY2016 , down slightly from prior guidance of $475 - $525 Expected effective tax rate of 20 - 25% for the next 2 quarters of fiscal 2016 Slightly lower stream volume in the March quarter expected » Lower Mount Milligan sales volume anticipated due to lower mine production volume relative to average » Catch - up deliveries from Wassa and Prestea were completed in the December quarter » Offset somewhat by higher sales volume associated with Pueblo Viejo Fiscal 2Q 2016 Financial Results 9 February 4, 2016

Strong Balance Sheet and Few Commitments Date Item ($USD millions) December 31, 2015 Undrawn Revolver $300.0m December 31, 2015 Working Capital $142.3m December 31, 2015 Total Available Liquidity $442.3m Strong and Growing Operating Cash flow For example, Fiscal 2Q Operating Cash flow (included in working capital above) $52.1m Near - Term Conditional Commitments Existing conditional commitments at Rainy River and Golden Star expected to be funded primarily through cash flow from operations $145m February 4, 2016 10 1

Opportunity – Valuation Golden Star 0% 10% 20% 30% 40% 50% 60% 70% 80% 90% 100% Net GEOs RGLD Peer Group Total 0% 10% 20% 30% 40% 50% 60% 70% 80% 90% 100% Op. Income 25% of the industry’s economics, trading at just 15% of the market cap 1 Peer group includes Franco Nevada and Silver Wheaton for the trailing 12 months ended September 30, 2015. 0% 10% 20% 30% 40% 50% 60% 70% 80% 90% 100% Market Cap. February 4, 2016 11

Opportunity – Valuation 12 Royal Gold trading at 1x NAV without Mount Milligan 1 $0 $500 $1,000 $1,500 $2,000 $2,500 $3,000 $3,500 Street Consensus 2 1x NAV of Royal Gold’s i nterest in Mount Milligan Street Consensus 2 1x NAV of Royal Gold’s portfolio without Mount Milligan Current market cap February 4, 2016

$0.00 $0.10 $0.20 $0.30 $0.40 $0.50 $0.60 $0.70 $0.80 $0.90 $1.00 2001 2002 2003 2004 2005 2006 2007 2008 2009 2010 2011 2012 2013 2014 2015 2016 13 Growth – Return of Capital February 4, 2016 Annual Dividends Paid Per Share Calendar Years 15 straight years of dividend increases; demonstrates ability to balance growth with return of capital Dividend increasing in calendar 2016 to $0.92 per share 29 % payout ratio of operating cash flow in FY2015 1 21% compound annual growth rate (CAGR) since 2001 Equates to 3% annual yield
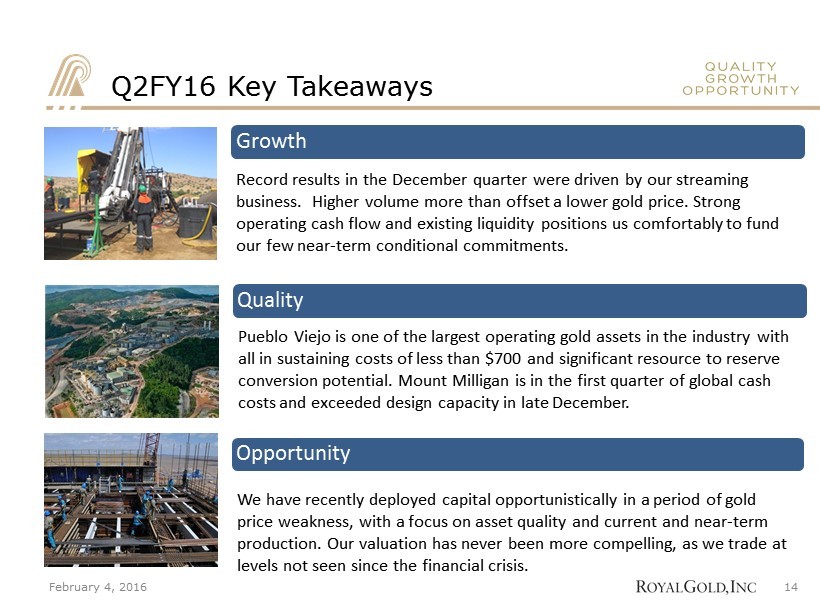
Q2FY16 Key Takeaways Quality Pueblo Viejo is one of the largest operating gold assets in the industry with all in sustaining costs of less than $700 and significant resource to reserve conversion potential. Mount Milligan is in the first quarter of global cash costs and exceeded design capacity in late December . Opportunity We have recently deployed capital opportunistically in a period of gold price weakness, with a focus on asset quality and current and near - term production. Our valuation has never been more compelling, as we trade at levels not seen since the financial crisis. Growth Record results in the December quarter were driven by our streaming business. Higher volume more than offset a lower gold price. Strong operating cash flow and existing liquidity positions us comfortably to fund our few near - term conditional commitments. 14 February 4, 2016
Endnotes
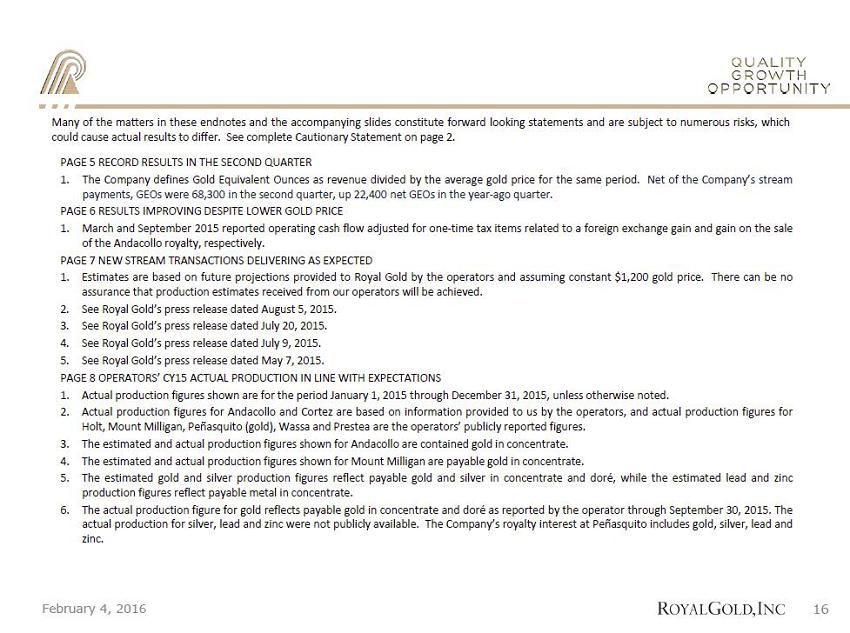
Many of the matters in these endnotes and the accompanying slides constitute forward looking statements and are subject to numerous risks, which could cause actual results to differ . See complete Cautionary Statement on page 2 . 16 February 4, 2016 PAGE 5 RECORD RESULTS IN THE SECOND QUARTER 1. The Company defines Gold Equivalent Ounces as revenue divided by the average gold price for the same period . Net of the Company’s stream payments, GEOs were 68 , 300 in the second quarter , up 22 , 400 net GEOs in the year - ago quarter . PAGE 6 RESULTS IMPROVING DESPITE LOWER GOLD PRICE 1 . March and September 2015 reported operating cash flow adjusted for one - time tax items related to a foreign exchange gain and gain on the sale of the Andacollo royalty, respectively . PAGE 7 NEW STREAM TRANSACTIONS DELIVERING AS EXPECTED 1. Estimates are based on future projections provided to Royal Gold by the operators and assuming constant $ 1 , 200 gold price . There can be no assurance that production estimates received from our operators will be achieved . 2. See Royal Gold’s press release dated August 5 , 2015 . 3. See Royal Gold’s press release dated July 20 , 2015 . 4. See Royal Gold’s press release dated July 9 , 2015 . 5. See Royal Gold’s press release dated May 7 , 2015 . PAGE 8 OPERATORS’ CY 15 ACTUAL PRODUCTION IN LINE WITH EXPECTATIONS 1 . Production estimates received from our operators are for calendar 2015 , except for Peñasquito and Pueblo Viejo . There can be no assurance that production estimates received from our operators will be achieved . Please refer to our cautionary language regarding forward looking statements preceding Table 1 above, as well as the Risk Factors identified in Part I, Item 1 A, of our Fiscal 2015 10 - K for information regarding factors that could affect actual results . 2 . The operator of our Voisey’s Bay interest did not release public production guidance for calendar 2015 ; thus estimated and actual production information is not shown in the table . 3 . Actual production figures shown are for the period January 1 , 2015 through December 31 , 2015 , unless otherwise noted . 4. Actual production figures for Andacollo and Cortez are based on information provided to us by the operators, and actual production figures for Holt, Mount Milligan, Peñasquito (gold), Wassa and Prestea are the operators’ publicly reported figures . 5 . The estimated and actual production figures shown for Andacollo are contained gold in concentrate . 6. The estimated and actual production figures shown for Mount Milligan are payable gold in concentrate . 7 . The estimated gold and silver production figures reflect payable gold and silver in concentrate and doré, while the estimated lead and zinc production figures reflect payable metal in concentrate .
Many of the matters in these endnotes and the accompanying slides constitute forward looking statements and are subject to numerous risks, which could cause actual results to differ . See complete Cautionary Statement on page 2 . 17 February 4, 2016 PAGE 8 OPERATORS’ CY 15 ACTUAL PRODUCTION IN LINE WITH EXPECTATIONS (cont . ) 8 . The actual production figure for gold reflects payable gold in concentrate and doré as reported by the operator through September 30 , 2015 . The actual production for silver, lead and zinc were not publicly available . The Company’s royalty interest at Peñasquito includes gold, silver, lead and zinc . 9 . The gold and silver stream at Pueblo Viejo was acquired during the quarter ended September 30 , 2015 and the first gold delivery was received in December 2015 for the period July 1 – November 30 , 2015 . The estimated production figure shown is payable gold in doré and represents Barrick’s 60 % interest in Pueblo Viejo as of September 30 , 2015 . 10. The gold streams at Wassa, Bogoso and Prestea were acquired during the quarter ended September 30 , 2015 . The estimated production figure shown is payable gold in doré . PAGE 10 STRONG BALANCE SHEET AND FEW COMMITMENTS 1 . This number could increase from $ 145 million to $ 150 million if Golden Star secures a third party investment of at least $ 5 m . PAGE 11 OPPORTUNITY – VALUATION 1. Source is S&P CapitaliQ . PAGE 12 OPPORTUNITY – VALUATION 1. Valuation reflects average valuation for the Mount Milligan asset at 1 x NAV from Royal Gold’s sixteen sell side analysts, based on their latest public research as available on January 8 , 2016 . The street consensus is for informational purposes only . Royal Gold had no involvement in the preparation of the street consensus or in any analyst’s estimate that may have formed part of the street consensus . Royal Gold does not endorse or approve, and is not adopting the street consensus or any underlying analyst’s estimate, and Royal Gold can provide no assurance with regard to the accuracy or correctness of the street consensus or underlying estimates . Royal Gold accepts no liability in respect of the street consensus and undertakes no obligation to provide updates or revisions to the street consensus . Investors are warned that reliance on the street consensus as part of their investment decision could result in loss . It should be noted that estimates are, by definition, forward looking and are therefore subject to risks and uncertainties which are subject to change at any time and which may materially affect eventual results . See the Cautionary Statement on page 2 . 2. The street consensus is for informational purposes only . Royal Gold does not endorse or approve the street consensus or any underlying analyst’s estimate that may have formed as part of the street consensus . See footnote 1 above and the Cautionary Statement on page 2 . PAGE 13 GROWTH – RETURN OF CAPITAL 1. Payout ratio of operating cash flow calculated as dividends paid divided by cash from operations for the fiscal year ended June 30 , 2015 .
1660 Wynkoop Street, #1000 Denver, CO 80202 - 1132 303.573.1660 info @royalgold.com www.royalgold.com 1660 Wynkoop Street, #1000 Denver, CO 80202 - 1132 303.573.1660 info @royalgold.com www.royalgold.com
Royal Gold (NASDAQ:RGLD)
Historical Stock Chart
From Mar 2024 to Apr 2024

Royal Gold (NASDAQ:RGLD)
Historical Stock Chart
From Apr 2023 to Apr 2024
