CME Group's Top and Bottom Lines Jump on Trading Surge
February 02 2017 - 8:39AM
Dow Jones News
By Ezequiel Minaya
CME Group Inc. reported Thursday that surging energy and metal
markets helped propel revenue and income higher during the latest
quarter.
The Chicago-based futures market -- the world's biggest --
generates most of its revenue from transaction fees, which rise and
fall with trading volume.
For the latest quarter, CME said average daily volume rose 24%
to 16.3 million contracts compared with last year. Clearing and
transaction fees rose to $768.5 million from $678 million.
Energy and metals trading jumped, with volumes rising 27% and
49%, respectively. Meanwhile, equity edged up 4.8% and agricultural
commodities slumped slightly, retreating 0.6%.
Exchanges including CME have worked to diversify their
businesses, with some focusing on data provision as a source of
steady revenue to lean on when turbulent markets result in lower
trading fees. For CME, data revenue growth has been slowing in
recent quarters, registering 1% growth in the latest quarter.
Quarterly results beat Wall Street expectations.
In all, CME reported a profit of $373.4 million, or $1.10 a
share, up from $291.7 million, or 86 cents, a year earlier.
Excluding certain items, profit rose to $1.14 from 97 cents.
Revenue improved 12% to $912.9 million.
Analysts had projected $1.11 in earnings per share and $903.7
million in revenue, according to Thomson Reuters.
Shares in the company were inactive premarket.
The Chicago-based exchange operator late last year launched an
ad campaign aimed at attracting retail customers, which regulators
discourage because of the risk involved in the futures market.
Futures markets are dominated by professional traders,
commodities firms and financial institutions. Though a small
portion of the market, retail trading is growing. Between 5% and
10% of CME's trading volume comes from retail customers, a
percentage that has roughly doubled since 2012.
--Alexander Osipovich contributed to this article.
Write to Ezequiel Minaya at ezequiel.minaya@wsj.com
(END) Dow Jones Newswires
February 02, 2017 08:24 ET (13:24 GMT)
Copyright (c) 2017 Dow Jones & Company, Inc.
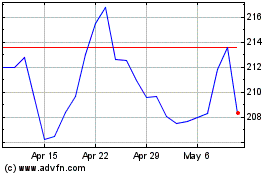
CME (NASDAQ:CME)
Historical Stock Chart
From Mar 2024 to Apr 2024

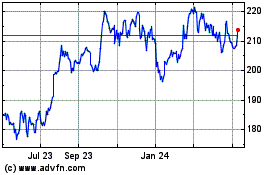
CME (NASDAQ:CME)
Historical Stock Chart
From Apr 2023 to Apr 2024
