CME Posts Flat Quarterly Trading Volume
October 27 2016 - 8:40AM
Dow Jones News
CME Group Inc. reported Thursday that busier energy and metal
markets were offset by sagging volumes in equity and agricultural
commodities as the futures market logged nearly flat quarterly
revenue.
The Chicago-based futures market—the world's biggest—generates
most of its revenue from transaction fees, which rise and fall with
trading volume.
Like other exchange operators, including CBOE Holdings Inc. and
Intercontinental Exchange Inc., CME saw record trading volume in
2015.
After stumbling at the end of last year, marked by worries over
China, economic uncertainty in the U.S. and choppy financial
markets, trading volumes have rebounded.
For the latest quarter, CME said average daily volume in the
quarter was 14.3 million contracts, flat when compared with a year
earlier. Clearing and transaction fees fell to $704.2 million from
$715 million.
"We are pleased with the overall results this quarter
considering there was a significant reduction in market volatility,
primarily in financial products, from the same period last year,"
said Terry Duffy, president and executive chairman of CME
Group.
Energy and metals trading surged with volumes rising 16% and
22%, respectively. Meanwhile, equity slipped 12.5% and agricultural
commodities fell 8.8%.
Exchanges including CME have worked to diversify their
businesses, with some focusing on data provision as a source of
steady revenue to lean on when turbulent markets result in lower
trading fees.
For CME, data revenue growth has been slowing in recent
quarters, registering 1.6% growth in the latest quarter.
Quarterly results beat Wall Street expectations for adjusted
earnings by a penny, but missed revenue projections.
In all, CME reported a profit of $472.8 million, or $1.39 a
share, up from $359.9 million, or $1.06 a share, a year earlier.
Excluding certain items, profit slipped to $1.05 from $1.06.
Revenue declined 1% to $841.7 million.
Analysts had projected $1.04 in earnings per share and $848.1
million in revenue, according to Thomson Reuters.
Shares in the company, up 9.4% this year, were inactive
premarket.
Write to Ezequiel Minaya at ezequiel.minaya@wsj.com
(END) Dow Jones Newswires
October 27, 2016 08:25 ET (12:25 GMT)
Copyright (c) 2016 Dow Jones & Company, Inc.
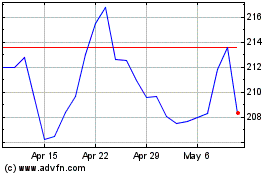
CME (NASDAQ:CME)
Historical Stock Chart
From Mar 2024 to Apr 2024

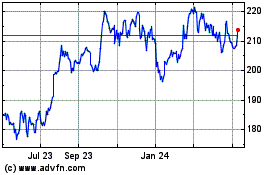
CME (NASDAQ:CME)
Historical Stock Chart
From Apr 2023 to Apr 2024
