UNITED
STATES
SECURITIES
AND EXCHANGE COMMISSION
Washington,
DC 20549
FORM 8-K
CURRENT
REPORT
Pursuant to
Section 13 or 15(d) of the
Securities
Exchange Act of 1934
Date
of report (Date of earliest event reported): November 12, 2015
Hooper Holmes, Inc.
(Exact
name of registrant as specified in charter)
|
New York
|
1-9972
|
22-1659359
|
|
(State or other jurisdiction
of incorporation)
|
(Commission File Number)
|
(IRS Employer Identification No.)
|
560 N. Rogers Road, Olathe, KS 66062
(Address of principal
executive offices) (Zip Code)
Registrant’s telephone number, including area code (913)
764-1045
Not Applicable
(Former names or former address, if changed
since last report)
Check the appropriate box below if the Form 8-K filing is
intended to simultaneously satisfy the filing obligation of the
registrant under any of the following provisions (see General
Instruction A.2. below):
⃞
Written
communications pursuant to Rule 425 under the Securities Act (17 CFR
230.425)
⃞
Soliciting
material pursuant to Rule 14a-12 under the Exchange Act (17 CFR
240.14a-12)
⃞
Pre-commencement
communications pursuant to Rule 14d-2(b) under the Exchange Act (17 CFR
240.14d-2(b))
⃞
Pre-commencement
communications pursuant to Rule 13e-4(c) under the Exchange Act (17 CFR
240.13e-4(c))
Item 2.02 Results
of Operations and Financial Condition
On November 12, 2015, Hooper Holmes, Inc. (the “Company”) issued a press
release announcing its preliminary operating results and financial
condition for the quarter ended September 30, 2015. A copy of the press
release is attached hereto as Exhibit 99.1, which is incorporated herein
by reference. The presentation discussed during the third quarter
investor call on November 12, 2015 is attached as Exhibit 99.2, which is
also incorporated herein by reference.
The information furnished in this section of the Current Report on Form
8-K and Exhibits attached hereto shall not be deemed “filed” for the
purposes of Section 18 of the Securities Exchange Act of 1934, as
amended (the “Exchange Act”), or otherwise subject to the liabilities of
that section, nor shall it be deemed incorporated by reference in any
filing under the Securities Act of 1933, as amended, or the Exchange
Act, except as shall be expressly set forth by specific reference in
such filing.
Item 9.01 Financial
Statements and Exhibits
(d)
Exhibits
99.1
Press Release, dated November 12, 2015.
99.2
Presentation used during the third quarter investor conference call on
November 12, 2015.
SIGNATURES
Pursuant to the requirements of the Securities Exchange Act of
1934, the Registrant has duly caused this report to be signed on its
behalf by the undersigned hereunto duly authorized.
|
|
|
Hooper Holmes, Inc.
|
|
|
|
|
|
Date:
|
November 12, 2015
|
|
|
|
|
By: /s/ Steven R. Balthazor
|
|
|
|
Steven R. Balthazor
|
|
|
|
Chief Financial Officer
|
Exhibit 99.1
Hooper
Holmes Announces Third Quarter 2015 Financial Results
OLATHE, Kan.--(BUSINESS WIRE)--November 12, 2015--Hooper Holmes (NYSE
MKT:HH) today announced financial results for the quarter ended
September 30, 2015, reporting an 18% increase in revenues, a 15%
improvement in gross profit and a significantly reduced net loss
compared to the quarter ended September 30, 2014. The Company also filed
an initial S-1 registration statement with the Securities and Exchange
Commission to raise $4.0 million in capital through a rights offering to
existing shareholders.
Consolidated revenues totaled $9.3 million for the third quarter of
2015, representing an increase of 18% from $7.9 million in the third
quarter of 2014, due to additional revenue from the acquisition of
Accountable Health Solutions, Inc. (AHS) and increased biometric
screenings. The Company completed 139,000 biometric screenings during
the third quarter of 2015, representing an increase of 17% from 119,000
biometric screenings completed in the third quarter of 2014. Gross
profit totaled $2.1 million for the third quarter of 2015, representing
an increase of 15% from $1.9 million in the third quarter of 2014, due
to increased revenue and our expanded suite of health and wellness
products and services. Margins were impacted by operational investments
of $700 thousand during the third quarter 2015 for process improvements,
oversight and staff training, which are expected to be leveraged as
revenues increase.
Selling, general and administrative expense totaled $3.7 million for the
third quarter of 2015 compared to $3.5 million in the third quarter of
2014. Excluding the impact of one-time events, the Company recorded a
net loss of $1.6 million, or $0.02 per share, for the third quarter of
2015, compared to a net loss of $4.5 million, or $0.06 per share, in the
third quarter of 2014. As of September 30, 2015, cash and cash
equivalents totaled $1.5 million, an increase of $0.3 million from the
three month period ending June 30, 2015, with $3.4 million in borrowings
outstanding under the Company's credit facility.
Henry Dubois, President and CEO of Hooper Holmes commented, "Our
business momentum continues to build. Year to date, we have won new
sales providing approximately $5.0 million of revenue in 2015 and an
estimated $11.0 million in revenue in 2016. To support our operations,
sales growth, and service our debt obligations associated with the AHS
acquisition we plan to raise $4.0 million by offering existing
shareholders the opportunity to purchase additional shares through a
rights offering. Directors, executive officers, related parties and a
key shareholder, as disclosed in our S-1, are fully engaged in this
capital raise. I am pleased to report that we have more than $1 million
in non-binding commitments from this group. We hope to launch this
program in early December and close the transaction in the first quarter
of 2016. The registration statement is available on our website, and
with the SEC."
Conference Call
The Company will host a conference call today, Thursday, November 12,
2015, at 7:30 a.m. CT (8:30 a.m. ET) to discuss third quarter 2015
financial results. A slide presentation will accompany the conference
call and is available on the Company’s website located at www.hooperholmes.com.
To participate in the conference call, please dial 888-438-5519, or
internationally 719-785-1765, conference ID: 3408680, five to ten
minutes before the call is scheduled to begin. A live webcast will be
hosted on the Company's website located at www.hooperholmes.com.
A replay of the conference call will be available from 10:30 a.m. CT
(11:30 a.m. ET) on November 12, 2015 until 11:00 p.m. CT (midnight ET)
on November 19, 2015, by dialing 877-870-5176, or internationally
858-384-5517. The access code for the replay is 3408680.
About Hooper Holmes
Hooper Holmes mobilizes a national network of health professionals to
provide on-site health screenings, laboratory testing, risk assessment
and sample collection services to wellness and disease management
companies, employers and brokers, government organizations and academic
institutions nationwide. Under the Accountable Health Solutions brand,
the Company combines smart technology, healthcare and behavior change
expertise to offer comprehensive health and wellness programs that
improve health, increase efficiencies and reduce healthcare delivery
costs.
This press release contains “forward-looking” statements, as such
term is defined in the Private Securities Litigation Reform Act of 1995.
These forward-looking statements are based on the Company’s current
expectations and beliefs and are subject to a number of risks,
uncertainties and assumptions. Among the important factors that could
cause actual results to differ materially from those expressed in, or
implied by, these forward-looking statements are our ability to realize
the expected benefits from this acquisition and our strategic alliance
with Clinical Reference Laboratory; our ability to successfully
implement our business strategy and integrate Accountable Health
Solutions’ business with ours; our ability to retain and grow our
customer base; our ability to recognize operational efficiencies and
reduce costs; uncertainty as to our working capital requirements over
the next 12 to 24 months; our ability to maintain compliance with the
financial covenant in our credit facility and the financing for this
acquisition; and the rate of growth in the Health and Wellness market.
Additional information about these and other factors that could affect
the Company’s business is set forth in the Company’s annual report on
Form 10-K for the year ended December 31, 2014, filed with the
Securities and Exchange Commission on March 31, 2015. The Company
undertakes no obligation to update or release any revisions to these
forward-looking statements to reflect events or circumstances after the
date of this press release to reflect the occurrence of unanticipated
events, except as required by law.
|
|
|
|
|
|
|
|
|
|
|
HOOPER HOLMES INC.
|
|
CONSOLIDATED STATEMENTS OF OPERATIONS
|
|
(unaudited; in thousands, except share and per share data)
|
|
|
|
|
|
|
|
|
|
|
|
|
|
|
|
|
|
|
|
|
|
|
|
|
|
|
|
|
|
|
|
|
|
Three months ended September 30,
|
|
Nine months ended September 30,
|
|
|
|
2015
|
|
2014
|
|
2015
|
|
2014
|
|
|
|
|
|
|
|
|
|
|
|
Revenues
|
|
$
|
9,272
|
|
|
$
|
7,875
|
|
|
$
|
22,615
|
|
|
$
|
21,852
|
|
|
Cost of operations
|
|
|
7,143
|
|
|
|
6,021
|
|
|
|
18,060
|
|
|
|
16,193
|
|
|
Gross profit
|
|
|
2,129
|
|
|
|
1,854
|
|
|
|
4,555
|
|
|
|
5,659
|
|
|
Selling, general and administrative expenses
|
|
|
3,740
|
|
|
|
3,541
|
|
|
|
10,212
|
|
|
|
12,007
|
|
|
Transaction costs
|
|
|
57
|
|
|
|
-
|
|
|
|
737
|
|
|
|
-
|
|
|
Gain on sale of real estate
|
|
|
|
|
(1,830
|
)
|
|
|
|
|
(1,830
|
)
|
|
Operating income (loss) from continuing operations
|
|
|
(1,668
|
)
|
|
|
143
|
|
|
|
(6,394
|
)
|
|
|
(4,518
|
)
|
|
Interest expense, net
|
|
|
(388
|
)
|
|
|
(61
|
)
|
|
|
(1,097
|
)
|
|
|
(156
|
)
|
|
Income (loss) from continuing operations before taxes
|
|
|
(2,056
|
)
|
|
|
82
|
|
|
|
(7,491
|
)
|
|
|
(4,674
|
)
|
|
Income tax expense
|
|
|
5
|
|
|
|
5
|
|
|
|
15
|
|
|
|
15
|
|
|
Income (loss) from continuing operations
|
|
|
(2,061
|
)
|
|
|
77
|
|
|
|
(7,506
|
)
|
|
|
(4,689
|
)
|
|
|
|
|
|
|
|
|
|
|
|
Discontinued operations:
|
|
|
|
|
|
|
|
|
|
Gain on sale of subsidiaries, net of adjustments
|
|
|
-
|
|
|
|
1,354
|
|
|
|
-
|
|
|
|
1,204
|
|
|
Loss from discontinued operations, net of tax
|
|
|
(57
|
)
|
|
|
(2,739
|
)
|
|
|
(82
|
)
|
|
|
(3,321
|
)
|
|
Loss from discontinued operations
|
|
|
(57
|
)
|
|
|
(1,385
|
)
|
|
|
(82
|
)
|
|
|
(2,117
|
)
|
|
Net loss
|
|
$
|
(2,118
|
)
|
|
$
|
(1,308
|
)
|
|
$
|
(7,588
|
)
|
|
$
|
(6,806
|
)
|
|
|
|
|
|
|
|
|
|
|
|
Reconciliation of GAAP results to Non-GAAP results
|
|
|
|
|
|
|
|
|
|
Gain on sale of real estate/restructuring
|
|
|
-
|
|
|
|
(1,830
|
)
|
|
|
-
|
|
|
|
(1,738
|
)
|
|
Gain on sale of lab services
|
|
|
-
|
|
|
|
(1,354
|
)
|
|
|
-
|
|
|
|
(1,204
|
)
|
|
AHS transaction & integration costs
|
|
|
304
|
|
|
|
-
|
|
|
|
1,242
|
|
|
|
-
|
|
|
Close-out cost of 2013 Portamedic sale
|
|
|
168
|
|
|
|
-
|
|
|
|
168
|
|
|
|
-
|
|
|
Adjusted (Non-GAAP) net loss
|
|
$
|
(1,646
|
)
|
|
$
|
(4,492
|
)
|
|
$
|
(6,178
|
)
|
|
$
|
(9,748
|
)
|
|
|
|
|
|
|
|
|
|
|
|
Adjusted net loss for third quarter 2015 was $1.6 million,
compared to $4.5 million of adjusted net loss in the third quarter
of 2014. The above schedule is a description of adjustments made to
net loss.
|
|
|
|
|
|
|
|
|
|
|
|
|
|
|
|
|
|
|
|
|
|
Income (loss) per share
|
|
|
|
|
|
|
|
|
|
Continuing operations:
|
|
|
|
|
|
|
|
|
|
Basic
|
|
$
|
(0.03
|
)
|
|
$
|
0.00
|
|
|
$
|
(0.10
|
)
|
|
$
|
(0.07
|
)
|
|
Diluted
|
|
|
(0.03
|
)
|
|
|
0.00
|
|
|
|
(0.10
|
)
|
|
|
(0.07
|
)
|
|
Discontinued operations:
|
|
|
|
|
|
|
|
|
|
Basic
|
|
|
(0.00
|
)
|
|
|
(0.02
|
)
|
|
|
(0.00
|
)
|
|
|
(0.03
|
)
|
|
Diluted
|
|
|
(0.00
|
)
|
|
|
(0.02
|
)
|
|
|
(0.00
|
)
|
|
|
(0.03
|
)
|
|
Net loss:
|
|
|
|
|
|
|
|
|
|
Basic
|
|
|
(0.03
|
)
|
|
|
(0.02
|
)
|
|
|
(0.10
|
)
|
|
|
(0.10
|
)
|
|
Diluted
|
|
|
(0.03
|
)
|
|
|
(0.02
|
)
|
|
|
(0.10
|
)
|
|
|
(0.10
|
)
|
|
|
|
|
|
|
|
|
|
|
|
Weighted average number of shares:
|
|
|
|
|
|
|
|
|
|
Basic and diluted
|
|
|
77,789,792
|
|
|
|
70,866,603
|
|
|
|
75,391,420
|
|
|
|
70,623,068
|
|
|
|
|
|
|
|
|
|
|
|
|
|
|
|
|
|
|
|
Adjusted net loss is not a recognized term under GAAP. These non-GAAP
financial measures should not be substituted for GAAP net earnings or
GAAP diluted earnings per share, respectively, as measures of Hooper
Holmes’ performance, but instead should be utilized as supplemental
measures of financial performance in evaluating our business.
|
|
|
Hooper Holmes, Inc.
|
|
Consolidated Balance Sheets
|
|
(unaudited; in thousands)
|
|
|
|
|
|
|
|
|
|
|
|
|
|
September 30, 2015
|
|
December 31, 2014
|
|
ASSETS
|
|
|
|
|
|
|
|
Current assets:
|
|
|
|
|
|
Cash and cash equivalents
|
|
$
|
1,528
|
|
|
$
|
5,201
|
|
|
Accounts receivable, net of allowance for doubtful accounts
|
|
|
7,546
|
|
|
|
3,178
|
|
|
Inventories
|
|
|
822
|
|
|
|
897
|
|
|
Other current assets
|
|
|
452
|
|
|
|
202
|
|
|
Total current assets
|
|
|
10,348
|
|
|
|
9,478
|
|
|
|
|
|
|
|
|
|
|
Property, plant and equipment, net
|
|
|
3,183
|
|
|
|
3,054
|
|
|
Intangible assets
|
|
|
5,498
|
|
|
|
-
|
|
|
Goodwill
|
|
|
657
|
|
|
|
-
|
|
|
Other assets
|
|
|
662
|
|
|
|
607
|
|
|
Total assets
|
|
|
20,348
|
|
|
|
13,139
|
|
|
|
|
|
|
|
|
|
|
LIABILITIES AND STOCKHOLDERS' EQUITY
|
|
|
|
|
|
Current liabilities:
|
|
|
|
|
|
Accounts payable
|
|
|
4,688
|
|
|
|
2,508
|
|
|
Accrued expenses
|
|
|
5,276
|
|
|
|
4,083
|
|
|
Short-term debt
|
|
|
5,195
|
|
|
|
-
|
|
|
Total current liabilities
|
|
|
15,159
|
|
|
|
6,591
|
|
|
|
|
|
|
|
|
|
|
Long-term debt, net of discount
|
|
|
65
|
|
|
|
-
|
|
|
Other long term liabilities
|
|
|
1,702
|
|
|
|
1,191
|
|
|
|
|
|
|
|
|
|
|
Commitments and contingencies
|
|
|
|
|
|
|
|
|
|
|
|
|
|
Stockholders' equity:
|
|
|
|
|
|
Common stock
|
|
|
3,119
|
|
|
|
2,835
|
|
|
Additional paid-in capital
|
|
|
156,116
|
|
|
|
150,747
|
|
|
Accumulated deficit
|
|
|
(155,742
|
)
|
|
|
(148,154
|
)
|
|
|
|
|
|
|
3,493
|
|
|
|
5,428
|
|
|
Less: Treasury stock at cost
|
|
|
(71
|
)
|
|
|
(71
|
)
|
|
Total stockholders' equity
|
|
|
3,422
|
|
|
|
5,357
|
|
|
Total liabilities and stockholders' equity
|
|
$
|
20,348
|
|
|
$
|
13,139
|
|
|
|
|
|
|
|
|
|
|
|
|
CONTACT:
Hooper Holmes
Henry E. Dubois, 913-764-1045
President
and CEO
or
Investors:
S.M. Berger & Company
Andrew
Berger, 216-464-6400
Exhibit 99.2
1 Hooper Holmes, Inc.
November 12, 2015 Earnings Presentation Speakers: Henry Dubois, Chief
Executive Officer Steven Balthazor, Chief Financial Officer
2 Safe Harbor Statement 2
This presentation contains forward‐looking statements, as such term is
defined in the Private Securities Litigation Reform Act of 1995,
concerning the Company’s plans, objectives, goals, strategies, future
events or performances, which are not statements of historical fact and
can be identified by words such as: “expect,” “continue,” “should,”
“may,” “will,” “project,” “anticipate,” “believe,” “plan,” “goal,” and
similar references to future periods. The forward‐looking statements
contained in this presentation reflect our current beliefs and
expectations. Actual results or performance may differ materially from
what is expressed in the forward looking statements. Among the important
factors that could cause actual results to differ materially from those
expressed in, or implied by, the forward‐looking statements contained in
this presentation are our ability to realize the expected benefits from
the acquisition of Accountable Health Solutions and our strategic
alliance with Clinical Reference Laboratory; our ability to successfully
implement our business strategy and integrate Accountable Health
Solutions’ business with ours; our ability to retain and grow our
customer base; our ability to recognize operational efficiencies and
reduce costs; uncertainty as to our working capital requirements over
the next 12 to 24 months; our ability to maintain compliance with the
financial covenants contained in our credit facilities; the rate of
growth in the Health and Wellness market and such other factors as
discussed in Part I, Item 1A, Risk Factors, and Part II, Item 7,
Management’s Discussion and Analysis of Financial Conditions and Results
of Operations of our Annual Report on Form 10‐K for the year ended
December 31, 2014. The Company undertakes no obligation to update or
release any revisions to these forward‐looking statements to reflect
events or circumstances, or to reflect the occurrence of unanticipated
events, after the date of this presentation, except as required by law.
This presentation contains information from third‐party sources,
including data from studies conducted by others and market data and
industry forecasts obtained from industry publications. Although the
Company believes that such information is reliable, the Company has not
independently verified any of this information and the Company does not
guarantee the accuracy or completeness of this information. Any
references to documents not included in the presentation itself are
qualified by the full text and content of those documents. During our
prepared comments or responses to your questions, we may offer
incremental metrics to provide greater insight into the dynamics of our
business or our quarterly results, such as references to EBITDA and
other measures of financial performance. Please be advised that this
additional detail may be one‐time in nature and we may or may not
provide an update in the future. These and other financial measures may
also have been prepared on a non‐GAAP basis. For some of these measures,
a reconciliation schedule showing GAAP versus non‐GAAP results has been
provided in our press release that was issued after the market closed
today.
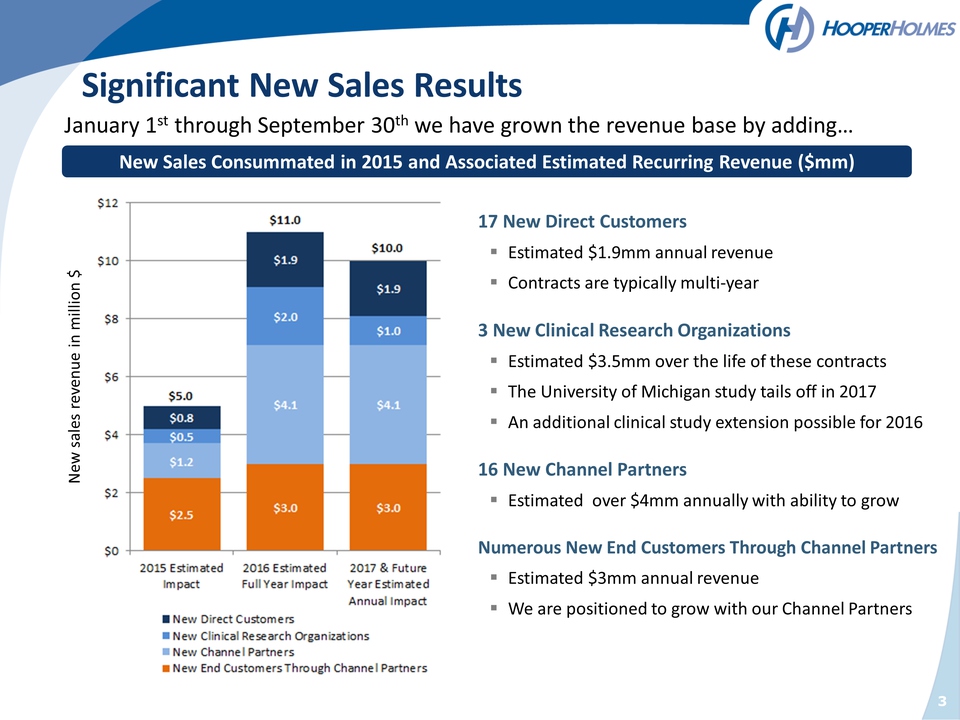
3 Significant New Sales
Results January 1st through September 30th we have grown the revenue
base by adding… New Sales Consummated in 2015 and Associated Estimated
Recurring Revenue ($mm) New sales revenue in million $ 17 New Direct
Customers Estimated $1.9mm annual revenue Contracts are typically
multi‐year 3 New Clinical Research Organizations Estimated $3.5mm over
the life of these contracts The University of Michigan study tails off
in 2017 An additional clinical study extension possible for 2016 16
New Channel Partners Estimated over $4mm annually with ability to grow
Numerous New End Customers Through Channel Partners Estimated $3mm
annual revenue We are positioned to grow with our Channel Partners
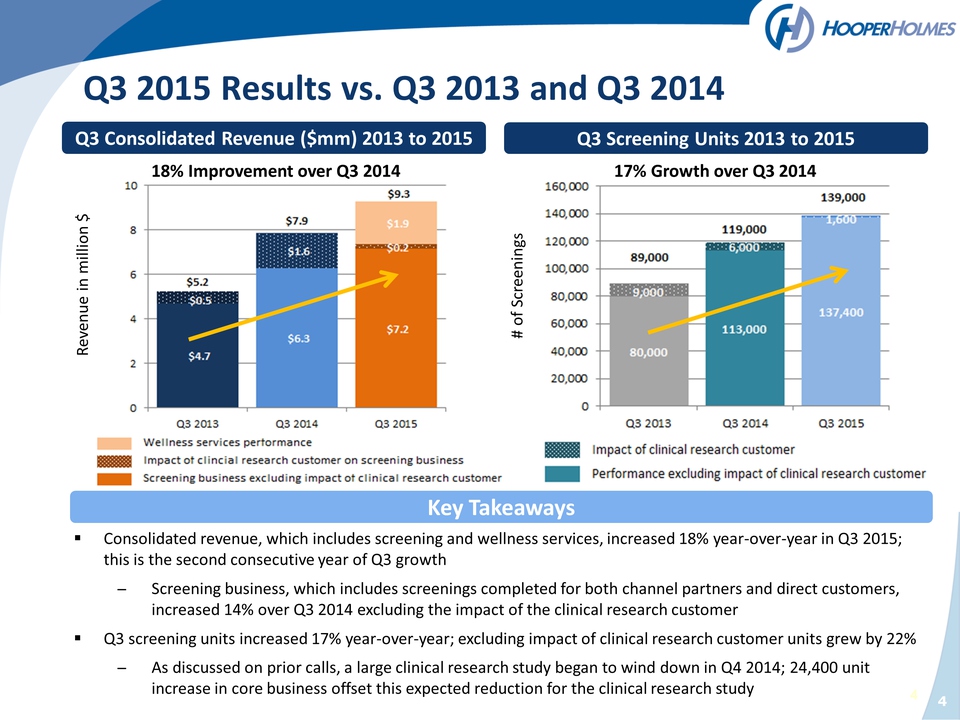
4 Q3 Consolidated Revenue
($mm) 2013 to 2015 Q3 Screening Units 2013 to 2015 Consolidated
revenue, which includes screening and wellness services, increased 18%
year‐over‐year in Q3 2015; this is the second consecutive year of Q3
growth ̶ Screening business, which includes screenings completed for
both channel partners and direct customers, increased 14% over Q3 2014
excluding the impact of the clinical research customer Q3 screening
units increased 17% year‐over‐year; excluding impact of clinical
research customer units grew by 22% ̶ As discussed on prior calls, a
large clinical research study began to wind down in Q4 2014; 24,400 unit
increase in core business offset this expected reduction for the
clinical research study Key Takeaways # of Screenings Q3 2015 Results
vs. Q3 2013 and Q3 2014 18% Improvement over Q3 2014 17% Growth over Q3
2014 Revenue in million $
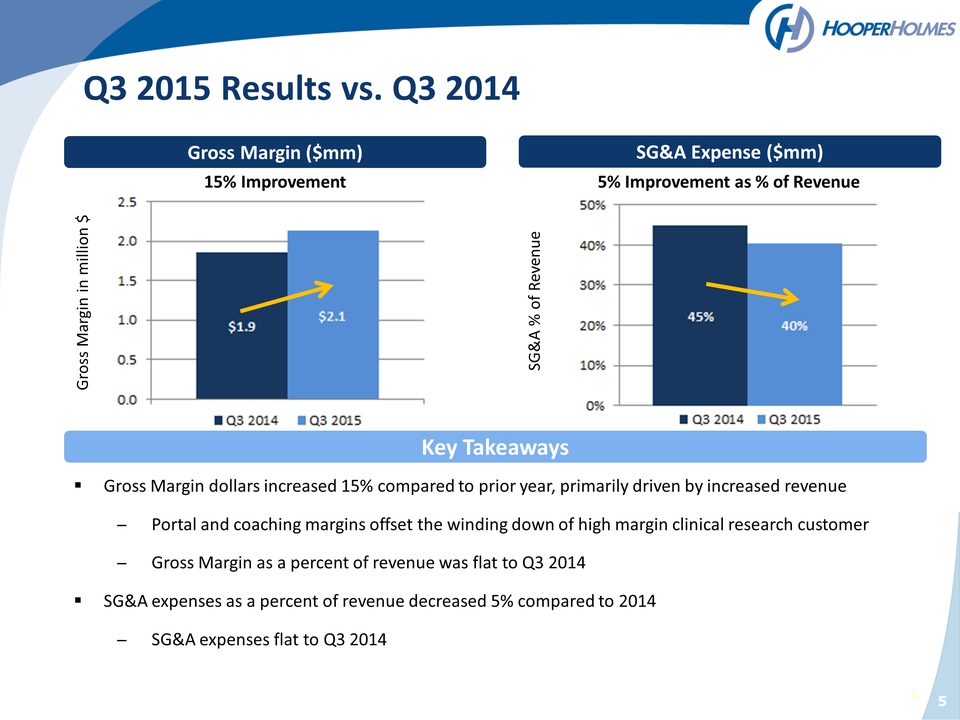
5 Gross Margin ($mm) SG&A
Expense ($mm) Gross Margin dollars increased 15% compared to prior
year, primarily driven by increased revenue ̶ Portal and coaching
margins offset the winding down of high margin clinical research
customer ̶ Gross Margin as a percent of revenue was flat to Q3 2014
SG&A expenses as a percent of revenue decreased 5% compared to 2014 ̶
SG&A expenses flat to Q3 2014 Key Takeaways Q3 2015 Results vs. Q3 2014
15% Improvement 5% Improvement as % of Revenue Gross Margin in million $
SG&A % of Revenue
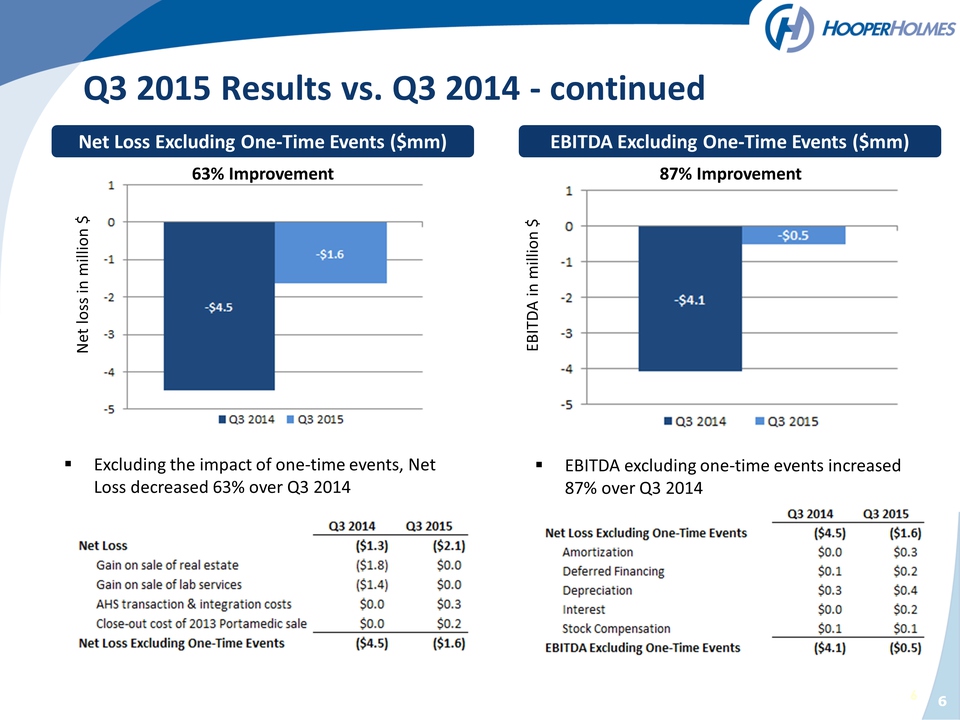
6 Net Loss Excluding
One‐Time Events ($mm) Excluding the impact of one‐time events, Net
Loss decreased 63% over Q3 2014 Q3 2015 Results vs. Q3 2014 ‐ continued
63% Improvement EBITDA Excluding One‐Time Events ($mm) 87% Improvement
EBITDA excluding one‐time events increased 87% over Q3 2014 Net loss in
million $ EBITDA in million $
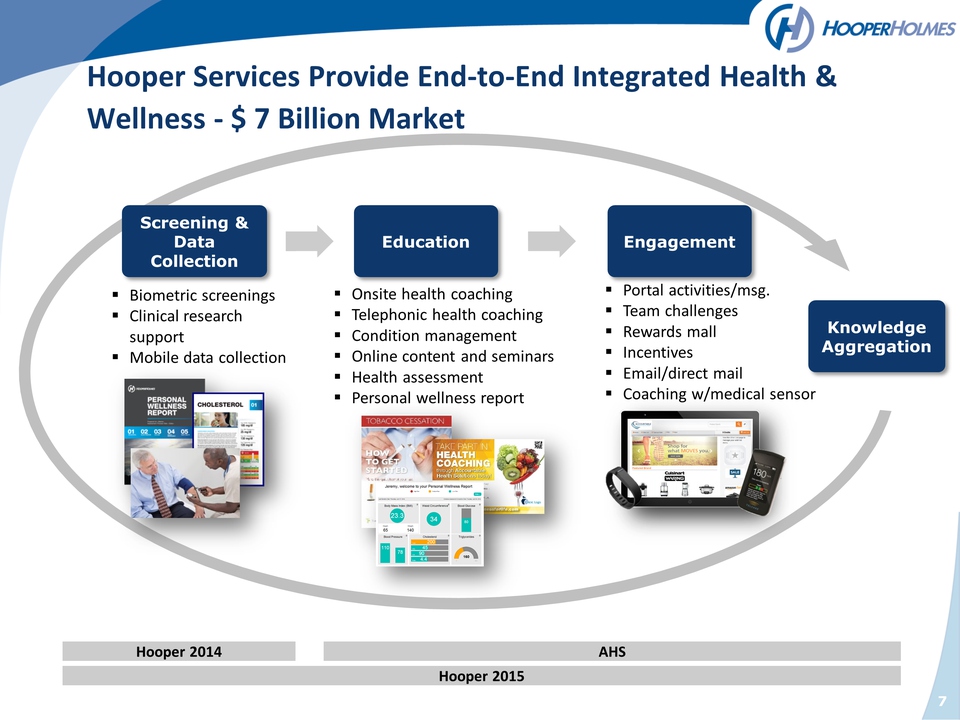
Biometric screenings
Clinical research support Mobile data collection Portal
activities/msg. Team challenges Rewards mall Incentives
Email/direct mail Coaching w/medical sensor plans ‐ future Onsite
health coaching Telephonic health coaching Condition management
Online content and seminars Health assessment Personal wellness
report plans ‐ future 7 Hooper Services Provide End‐to‐End Integrated
Health & Wellness ‐ $ 7 Billion Market Data Collection Screening &
Education Engagement Knowledge Aggregation Hooper 2015 Hooper 2014 AHS
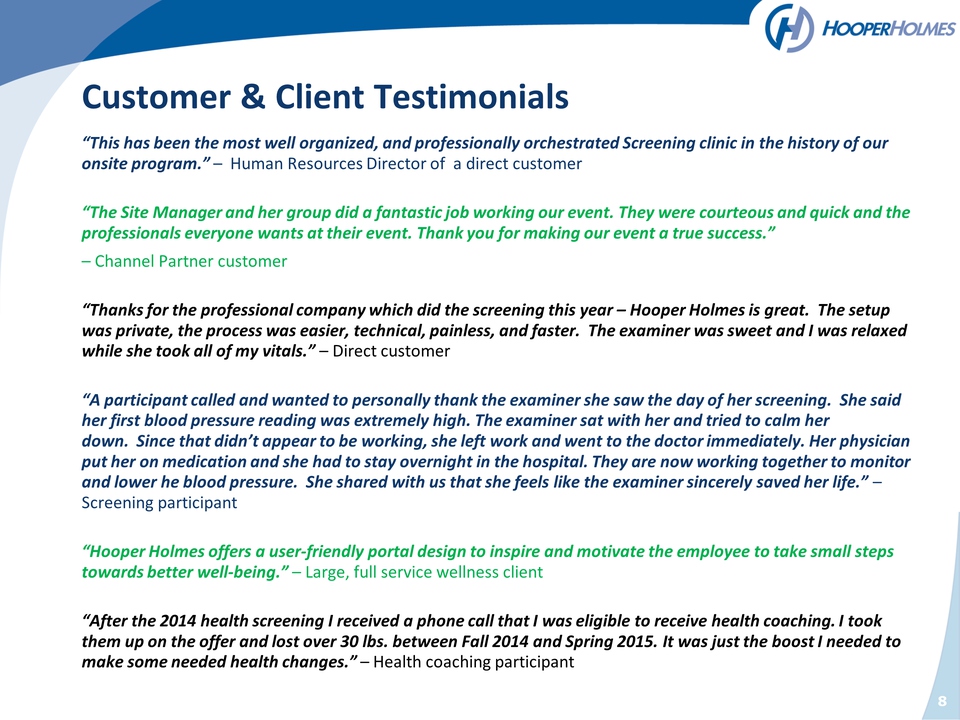
Customer & Client
Testimonials “This has been the most well organized, and professionally
orchestrated Screening clinic in the history of our onsite program.” –
Human Resources Director of a direct customer “The Site Manager and her
group did a fantastic job working our event. They were courteous and
quick and the professionals everyone wants at their event. Thank you for
making our event a true success.” – Channel Partner customer “Thanks for
the professional company which did the screening this year – Hooper
Holmes is great. The setup was private, the process was easier,
technical, painless, and faster. The examiner was sweet and I was
relaxed while she took all of my vitals.” – Direct customer “A
participant called and wanted to personally thank the examiner she saw
the day of her screening. She said her first blood pressure reading was
extremely high. The examiner sat with her and tried to calm her down.
Since that didn’t appear to be working, she left work and went to the
doctor immediately. Her physician put her on medication and she had to
stay overnight in the hospital. They are now working together to monitor
and lower he blood pressure. She shared with us that she feels like the
examiner sincerely saved her life.” – Screening participant “Hooper
Holmes offers a user‐friendly portal design to inspire and motivate the
employee to take small steps towards better well‐being.” – Large, full
service wellness client “After the 2014 health screening I received a
phone call that I was eligible to receive health coaching. I took them
up on the offer and lost over 30 lbs. between Fall 2014 and Spring 2015.
It was just the boost I needed to make some needed health changes.” –
Health coaching participant 8
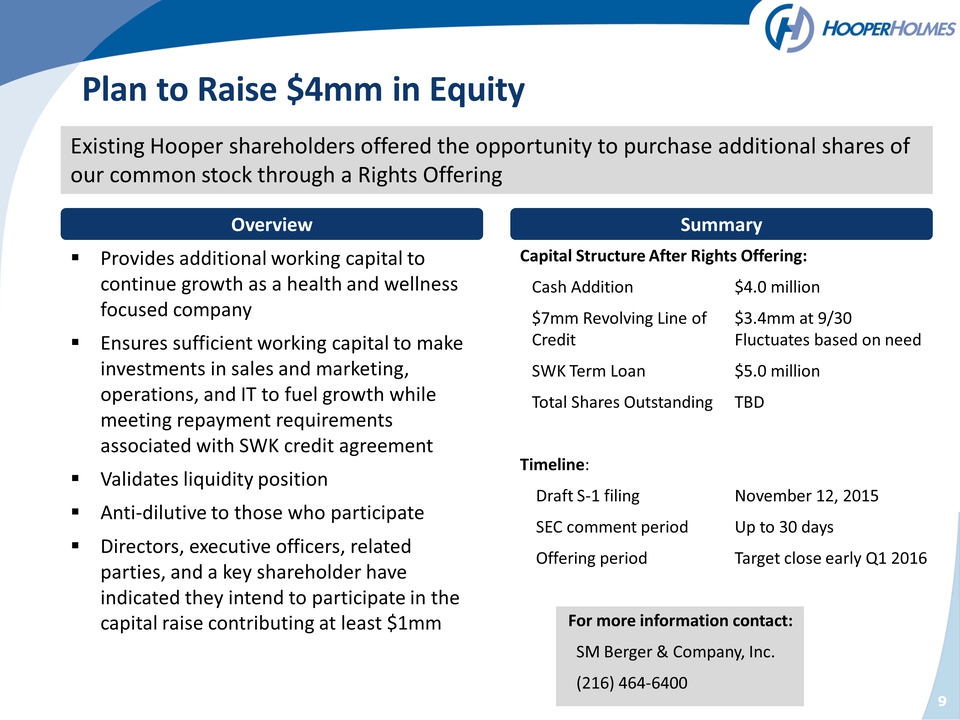
9 Plan to Raise $4mm in
Equity Existing Hooper shareholders offered the opportunity to purchase
additional shares of our common stock through a Rights Offering
Provides additional working capital to continue growth as a health and
wellness focused company Ensures sufficient working capital to make
investments in sales and marketing, operations, and IT to fuel growth
while meeting repayment requirements associated with SWK credit
agreement Validates liquidity position Anti‐dilutive to those who
participate Directors, executive officers, related parties, and a key
shareholder have indicated they intend to participate in the capital
raise contributing at least $1mm Summary Capital Structure After Rights
Offering: Cash Addition $4.0 million $7mm Revolving Line of Credit
$3.4mm at 9/30 Fluctuates based on need SWK Term Loan $5.0 million Total
Shares Outstanding TBD Timeline: Draft S‐1 filing November 12, 2015 SEC
comment period Up to 30 days Offering period Target close early Q1 2016
For more information contact: SM Berger & Company, Inc. (216) 464‐6400
Overview
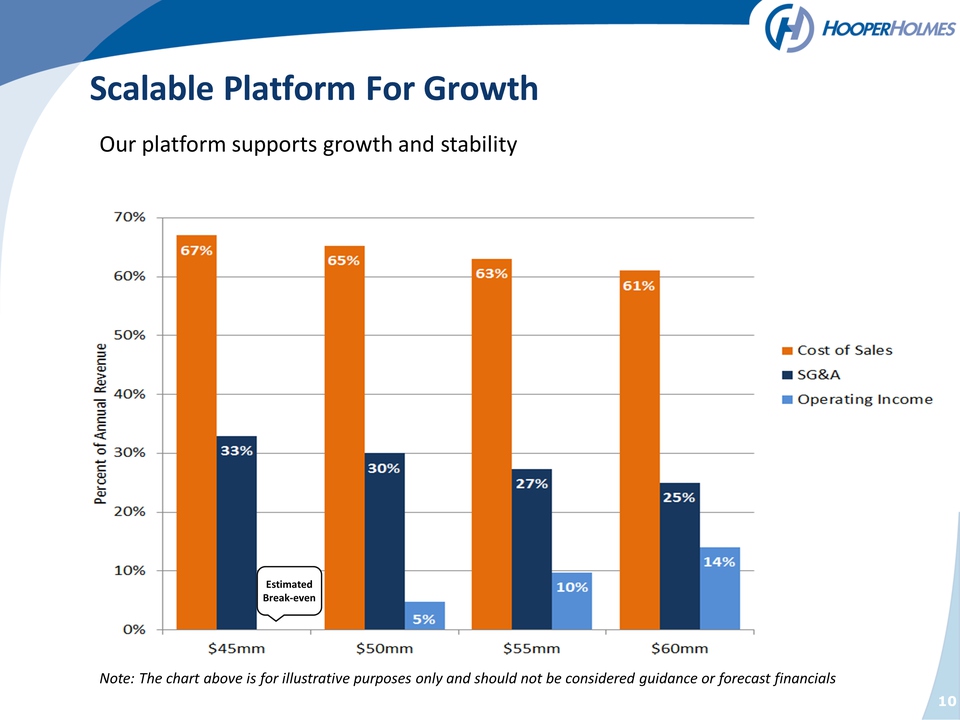
10 Scalable Platform For
Growth Our platform supports growth and stability Note: The chart above
is for illustrative purposes only and should not be considered guidance
or forecast financials Estimated Break‐even