UNITED STATES
SECURITIES
AND EXCHANGE COMMISSION
Washington, D.C. 20549
FORM 6-K
Report of Foreign Private Issuer
Pursuant to Rule 13a-16 or 15d-16
of the Securities Exchange Act of 1934
Date: March 10, 2016
Commission File Number: 001-33414
Denison Mines Corp.
(Translation of registrant’s name into English)
1100-40 University Avenue,
Toronto Ontario, M5J 1T1 Canada
(Address of principal executive offices)
Indicate by check mark whether the registrant files or will file annual reports under cover Form 20-F or Form 40-F.
Form
20-F ¨ Form 40-F x
Indicate by check mark if the registrant is submitting the Form 6-K in paper as permitted by Regulation S-T Rule 101(b)(1): ¨
Indicate by check mark if the registrant is submitting the Form 6-K in paper as permitted by Regulation S-T
Rule 101(b)(7): ¨
Signatures
Pursuant to the requirements of the Securities Exchange Act of 1934, the registrant has duly caused this report to be signed on its behalf by the undersigned,
thereunto duly authorized.
|
|
|
|
|
|
|
|
|
Denison Mines Corp. |
|
|
|
|
|
|
|
/s/ Amanda Willett |
| Date: March 10, 2016 |
|
|
|
Amanda Willett |
|
|
|
|
Corporate Counsel and Corporate Secretary |
EXHIBIT INDEX
|
|
|
| Exhibit Number |
|
Description |
|
|
| 99.1 |
|
Press Release dated March 9, 2016 |
| 99.2 |
|
Audited Financial Statements for the financial year ended December 31, 2015 |
| 99.3 |
|
Management’s Discussion and Analysis for the financial year ended December 31, 2015 |
Exhibit 99.1
|
|
|

|
|
Denison Mines Corp. 1100
– 40 University Ave Toronto, ON M5J 1T1
www.denisonmines.com |
PRESS RELEASE
DENISON MINES CORP. REPORTS HIGHLIGHTS OF 2015 RESULTS
Toronto, ON – March 9, 2016. Denison Mines Corp. (“Denison” or the “Company”) (DML: TSX, DNN: NYSE MKT) today filed
its Consolidated Financial Statements and Management’s Discussion & Analysis (“MD&A”) for the financial year ended December 31, 2015. Both documents can be found on the Company’s website at www.denisonmines.com or on SEDAR (at www.sedar.com) and
EDGAR (at www.sec.gov/edgar.shtml). The highlights provided below are derived from these documents and should be read in conjunction with them.
All amounts in this release are in U.S. dollars unless otherwise stated.
David Cates, President and CEO of Denison commented “In 2015,
Denison achieved a key milestone with the completion of a maiden resource estimate for our Gryphon deposit on the Wheeler River property – which was already host to the exceptionally high-grade Phoenix deposit. The addition of the Gryphon
deposit represents a significant increase in the estimated mineral resources at Denison’s 60% owned Wheeler River property, and establishes the project as one of the largest and highest grade undeveloped uranium projects in the Athabasca Basin
region.”
2015 HIGHLIGHTS
| ¡ |
|
Reported a significant increase in estimated mineral resources at the Wheeler River property |
The Company completed an initial mineral resource estimate for the basement hosted Gryphon uranium deposit, which is located three
kilometres to the northwest of the high-grade unconformity hosted Phoenix deposit. The Gryphon deposit is estimated to contain an inferred mineral resource of 43.0 million pounds U3O8 at an average grade of 2.3% U3O8. Together with the high-grade Phoenix deposit,
Wheeler River is now estimated to contain indicated mineral resources of 70.2 million pounds U3O8 at an average grade of 19.1% U3O8 and inferred mineral resources totaling 44.1 million pounds U3O8 at a combined grade of 2.34% U3O8 (see Denison news release dated November 3, 2015).
| ¡ |
|
Moving ahead at the Wheeler River Property |
A Preliminary Economic Analysis (“PEA”) was initiated in 2015 to evaluate the economic merit of the co-development of the
Gryphon and Phoenix deposits and is expected to be completed in the first half of 2016. Subject to a positive outcome from the PEA, the Company plans to initiate work on a Prefeasibility Study and environmental assessment work as part of a 2016
evaluation budget of CAD$2,600,000 (CAD$1,600,000 Denison’s share).
| ¡ |
|
Experienced continued exploration success at the Wheeler River property |
Exploration drilling results for the area in the vicinity of the Gryphon deposit continued to highlight the mineralization potential of
this area. During 2015, a total of 16 drill holes were completed up plunge and along the sub-Athabasca unconformity to the southwest of the Gryphon deposit along the K-North trend. The drilling successfully identified approximately 2.3 kilometres of
mineralized strike. The mineralization occurs both at the unconformity and immediately below within the basement, indicating further potential along the unconformity to the southwest and within the basement below. The best result to date occurs
at the unconformity, 800 metres to the south of Gryphon, with drill hole WR-597 intersecting 4.5% U3O8 over 4.5 metres (see Denison news
release dated June 4, 2015). In February 2016 Denison reported a new intersection of high-grade uranium within the basement roughly 100 metres to the north of the Gryphon deposit, (see Denison news release dated February 9, 2016).
| ¡ |
|
Generated positive 2015 exploration results at other exploration pipeline properties in the infrastructure rich eastern Athabasca Basin
|
At the 68.85% owned Murphy Lake property, Denison intersected a new zone of uranium mineralization, highlighted
by drill hole MP-15-03, which returned a mineralized interval of 0.25% U3O8 over 6.0 metres at the sub-Athabasca unconformity (see
Denison news release dated July 29, 2015). At the 61.55% owned Waterbury Lake property, the Company intersected weak uranium mineralization and strong alteration and/or structure at the Oban target area. At the 100% owned Crawford
Lake property, the Company extended a large zone of significant sandstone alteration along the CR-2 and CR-5 conductors, which is now confirmed over a strike length of 2.9 kilometres.
| ¡ |
|
Exceeded initial 2015 guidance for toll milling revenue at McClean Lake |
The McClean Lake mill, in which Denison owns a 22.5% interest, packaged approximately 11.3 million pounds U3O8 during the year (initially targeted at six to eight million packaged pounds) for the Cigar Lake Joint Venture (“CLJV”),
generating toll milling revenues for Denison of $3.2 million.
| ¡ |
|
Completed the sale of the Company’s Mongolian interests for consideration of up to $13.25 million |
Denison received $1.25 million in initial payments on the closing of the sale of its Mongolian interests. Denison has the rights to
receive additional proceeds of up to $12 million, conditional on achieving certain milestones associated with the Mongolian projects.
ABOUT DENISON
Denison is a uranium exploration and development company with interests focused in the Athabasca Basin region of northern Saskatchewan, Canada.
In addition to its 60% owned Wheeler River project, which hosts the high grade Phoenix and Gryphon uranium deposits, Denison’s exploration portfolio consists of numerous projects covering over 390,000 hectares in the eastern Athabasca Basin.
Denison’s interests in Saskatchewan also include a 22.5% ownership interest in the McClean Lake joint venture (“MLJV”), which includes several uranium deposits and the McClean Lake uranium mill, plus a 25.17% interest in the Midwest
deposit and a 61.55% interest in the J Zone deposit on the Waterbury Lake property. Both the Midwest and J Zone deposits are located within 20 kilometres of the McClean Lake mill. Internationally, Denison owns 100% of the Mutanga uranium
project in Zambia, 100% of the uranium-silver-copper Falea project in Mali and a 90% interest in the Dome uranium project in Namibia.
Denison is
engaged in mine decommissioning and environmental services through its Denison Environmental Services (“DES”).
Denison is also the manager
of Uranium Participation Corporation (“UPC”), a publicly traded company listed on the TSX under the symbol “U”, which invests in uranium oxide in concentrates (“U3O8”) and uranium hexafluoride
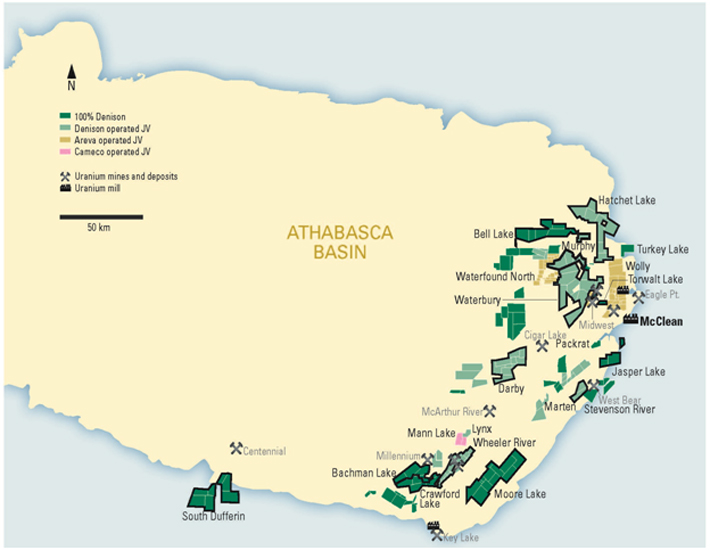
EASTERN ATHABASCA LAND POSITION
The Company’s land position in the infrastructure rich eastern Athabasca Basin, as of December 31, 2015, is illustrated below. Denison’s
active exploration properties are outlined in bold.
2
|
|
|
|
|
|
|
|
|
|
|
|
|
| SELECTED ANNUAL FINANCIAL INFORMATION |
|
|
|
|
|
|
|
|
|
|
| (in thousands, except for per share amounts) |
|
|
|
Year Ended
December 31, 2015 |
|
|
|
|
Year Ended
December 31,
2014 |
|
|
|
|
|
|
| Results of Continuing Operations: |
|
|
|
|
|
|
|
|
|
|
|
|
| Total revenues |
|
$ |
|
|
12,670 |
|
|
$ |
|
|
9,619 |
|
| Mineral property exploration |
|
$ |
|
|
(14,257) |
|
|
$ |
|
|
(14,401) |
|
| Impairment of mineral properties |
|
$ |
|
|
(27,767) |
|
|
$ |
|
|
(1,745) |
|
| Net loss |
|
$ |
|
|
(61,737) |
|
|
$ |
|
|
(28,266) |
|
| Basic and diluted loss per share |
|
$ |
|
|
(0.12) |
|
|
$ |
|
|
(0.06) |
|
|
|
|
|
|
| Results from Mongolian Discontinued Operations: |
|
|
|
|
|
|
|
|
|
|
|
|
| Net income (loss) |
|
$ |
|
|
10,177 |
|
|
$ |
|
|
(3,437) |
|
| Basic and diluted income per share |
|
$ |
|
|
0.02 |
|
|
$ |
|
|
(0.01) |
|
| |
|
|
|
|
|
|
|
|
|
|
|
|
| (in thousands) |
|
|
|
As at
December 31,
2015 |
|
|
|
|
As at
December 31,
2014 |
|
|
|
|
|
|
| Financial Position: |
|
|
|
|
|
|
|
|
|
|
|
|
| Cash and cash equivalents |
|
$ |
|
|
5,367 |
|
|
$ |
|
|
18,640 |
|
| Short term investments |
|
|
|
|
7,282 |
|
|
|
|
|
4,381 |
|
| Long term investments |
|
|
|
|
496 |
|
|
|
|
|
954 |
|
| Cash, cash equivalents and investments |
|
$ |
|
|
13,145 |
|
|
$ |
|
|
23,975 |
|
|
|
|
|
|
| Working capital |
|
$ |
|
|
12,772 |
|
|
$ |
|
|
22,542 |
|
| Property, plant and equipment |
|
$ |
|
|
188,250 |
|
|
$ |
|
|
270,388 |
|
| Total assets |
|
$ |
|
|
212,758 |
|
|
$ |
|
|
311,330 |
|
| Total long-term liabilities |
|
$ |
|
|
38,125 |
|
|
$ |
|
|
42,291 |
|
RESULTS OF OPERATIONS
Revenues
The McClean Lake mill continued to process ore received from the Cigar Lake mine. The mill packaged approximately 11.3 million pounds U3O8 for the CLJV. The Company’s share of toll milling revenue during 2015 totaled $3,155,000. Revenue from Denison Environmental Services
(“DES”) during 2015 was $7,607,000, improving on 2014 due to increased activity at certain care and maintenance sites.
Revenue from the
Company’s management contract with UPC was $1,822,000 during 2015.
Operating expenses
Canadian mining segment operating expenses include depreciation, development and standby costs, as well as certain adjustments to the estimates of future
reclamation liabilities at McClean Lake, Midwest and Elliot Lake. Operating expenses in 2015 were $4,554,000, including depreciation of the McClean Lake mill of $1,627,000.
DES operating expenses during 2015 totaled $6,875,000, related primarily to the construction and consulting services provided to clients and includes
labour and other costs.
General and administrative expenses
Total general and administrative expenses were $6,463,000 during 2015. These costs are mainly comprised of head office salaries and benefits, office costs
in multiple regions, audit and regulatory costs, legal fees, investor relations expenses, project costs and all other costs related to operating a public company with listings in Canada and the United States. Also included was $1,461,000 related to
the failed transaction with Fission Uranium Corp.
Impairment – Mineral Properties
During 2015, the Company recognized a non-cash impairment of $25,164,000 against the value of its African mining segment, which included significant
carrying values for the Falea, Mutanga and Dome projects, and also recognized non-cash impairment charges of $2,603,000, to fully impair the carrying value of three of its non-core Canadian exploration properties.
3
Foreign exchange income and expense
During 2015, a foreign exchange loss of $16.0 million was recognized due to unfavourable fluctuations in foreign exchange rates impacting the revaluation
of intercompany debt for the Company’s African related operations.
Mongolian Discontinued Operations
Income from discontinued operations was $10,177,000, which mainly comprised of the gain on disposal of $8,374,000 and transactional foreign exchange
income of $2,873,000, partly offset by exploration, operating and administrative expenses of $1,091,000. The gain on the disposal consisted of $1,250,000 in cash consideration, less transaction costs of $337,000, a favourable cumulative translation
adjustment of $13,680,000, offset by the carrying value of the net assets of $6,219,000. Denison is entitled to up to $12,000,000 in additional proceeds that are contingent on the approval of certain mining licenses and other milestones.
LIQUIDITY AND CAPITAL RESOURCES
Cash, cash equivalents, GICs
and other investments were $13,145,000 at December 31, 2015. The Company holds a large majority of its cash, cash equivalents, and investments in Canadian dollars. As at December 31, 2015, the Company’s cash, cash equivalents and
current investments amount to CAD$17.5 million. The Company’s CAD$24 million credit facility available for non-financial letters of credit was extended in January 2016 to January 2017. The facility contains a covenant that
requires the Company to maintain a minimum cash balance of CAD$5 million on deposit with the Bank of Nova Scotia.
OUTLOOK FOR 2016
In 2016, the Company will focus on increasing its mineral resource base in the Athabasca Basin and advancing the Wheeler River project. The 2016 winter
exploration program commenced in January with a focus on the Company’s Wheeler River project and other high priority properties located in the infrastructure rich eastern Athabasca Basin.
|
|
|
|
|
| |
|
| (in thousands) |
|
2016 BUDGET (1) |
|
| |
|
| Canada |
|
|
|
|
| Toll Milling Revenue & Mineral Sales
|
|
$ |
5,450 |
|
| Development & Operations |
|
|
(2,450) |
|
| Mineral Property Exploration & Evaluation |
|
|
(13,000) |
|
| |
|
|
|
|
(10,000) |
|
| Africa |
|
|
|
|
| Zambia, Mali and Namibia |
|
|
(1,290) |
|
| |
|
|
|
|
(1,290) |
|
| Other |
|
|
|
|
| UPC Management Services |
|
|
1,520 |
|
| DES Environmental Services |
|
|
920 |
|
| Corporate Administration & Other |
|
|
(4,200) |
|
| |
|
|
|
|
(1,760) |
|
| |
|
| Total |
|
$ |
(13,050) |
|
| |
|
| (1) Budget figures have been converted using a US$ to CAD$
exchange rate of 1.30. |
|
CANADA
Toll Milling Revenue & Mineral
Sales
Provided regulatory approvals are secured to increase the annual license limit, the McClean Lake mill is expected to produce 16 million
pounds U3O8 during 2016. Denison’s share of revenue from toll milling of the Cigar Lake ore and the sale of approximately 25,000
pounds U3O8, currently held by Denison in inventory, is budgeted to be $5.4 million (CAD$7.1 million).
4
Development & Operations
In 2016, Denison’s share of operating and capital expenditures at McClean Lake and Midwest are budgeted to be $1.6 million (CAD$2.1 million).
Operating expenditures include $797,000 (CAD$1.04 million) in respect of Denison’s share of the planned 2016 budget for the Surface Access Borehole Resource Extraction (“SABRE”) program.
Reclamation expenditures at Elliot Lake are budgeted to be $665,000 (CAD$864,000).
Mineral Property Exploration & Evaluation
Denison expects
to operate and/or participate in a total of 15 exploration programs (including 13 drilling programs totaling approximately 75,000 metres), of which Wheeler River will continue to be the primary focus. The total budget for all of these programs,
inclusive of the evaluation work planned for Wheeler River, is budgeted to be CAD$24.6 million (Denison’s share, CAD$16.9 million).
Wheeler River –
Exploration
A total of 47,000 metres of exploration drilling is planned at Wheeler River between the winter and summer drill programs, along with
geophysical surveys at a total cost of CAD$10.0 million (Denison’s share, CAD$6.0 million).
Exploration drilling planned for 2016 will continue
to test the unconformity to the southwest of Gryphon as well as numerous basement targets near Gryphon.
Wheeler River - Evaluation
The PEA is expected to be completed during the first half of 2016. Subject to a positive outcome from the PEA, the Company plans to initiate work on a
Prefeasibility Study and environmental assessment work with an approximate budget for 2016 of CAD$2.6 million (Denison’s share, CAD$1.6 million).
Other High
Priority Exploration Properties
Drilling at the Company’s high priority exploration properties is planned to continue at Murphy Lake,
Crawford Lake and Waterbury Lake during 2016. Drill programs are also planned for Denison’s non-operated joint venture projects, including Mann Lake, Wolly and McClean Lake.
Environmental services
Revenue from operations at DES during
2016 is budgeted to be $7.2 million (CAD$9.4 million) and operating and overhead expenses are budgeted to be $6.1 million (CAD$7.9 million). Capital expenditures at DES are budgeted to be $230,000 (CAD$300,000).
Corporate administration and other
Budgeted at $3.85 million
(CAD$5.0 million) in 2016, corporate administration costs include all head office salaries and benefits, office costs, audit and regulatory costs, legal fees, investor relations expenses and all other costs related to operating a public company with
listings in Canada and the United States.
Net management fees earned during 2016 from UPC are budgeted at $1.5 million (CAD$1.95 million).
Letter of credit and standby fees relating to the 2016 Credit Facility are budgeted to be $400,000 (CAD$520,000).
TECHNICAL INFORMATION
Further details regarding the Gryphon
deposit and the current mineral resources estimated at Wheeler River are provided in the report titled “Technical Report on a Mineral Resource Estimate For The Wheeler River Property, Eastern Athabasca Basin, Northern Saskatchewan,
Canada.”, dated Nov. 25, 2015, authored by William E. Roscoe Ph.D, P.Eng. and Mark B. Mathisen C.P.G of RPA Inc. A copy of this report is available under Denison’s profile on SEDAR (www.sedar.com).
The disclosure of a scientific or technical nature contained in this news release was prepared by Dale Verran, MSc, Pr.Sci.Nat., Denison’s Vice
President, Exploration, who is a Qualified Person in accordance with the requirements of NI 3-101. For a description of the quality assurance program and quality control measures applied by Denison, please see Denison’s Annual Information
Form dated March 5, 2015 filed under the Company’s profile on SEDAR at www.sedar.com.
For more information, please contact
|
|
|
| David Cates |
|
(416) 979 – 1991 ext 362 |
| President and Chief Executive Officer |
|
|
|
|
| Sophia Shane |
|
(604) 689 - 7842 |
| Investor Relations |
|
|
5
Cautionary Statement Regarding Forward-Looking Statements
Certain information contained in this press release constitutes “forward-looking information”, within the meaning of the United States Private
Securities Litigation Reform Act of 1995 and similar Canadian legislation concerning the business, operations and financial performance and condition of Denison.
Generally, these forward-looking statements can be identified by the use of forward-looking terminology such as “plans”, “expects”,
“budget”, “scheduled”, “estimates”, “forecasts”, “intends”, “anticipates”, or “believes”, or the negatives and/or variations of such words and phrases, or state that certain
actions, events or results “may”, “could”, “would”, “might” or “will be taken”, “occur”, “be achieved” or “has the potential to”.
In particular, this press release contains forward-looking information pertaining to the following: the likelihood of completing and benefits to be
derived from corporate transactions, including the potential for receipt of any contingent payments; the estimates of Denison’s mineral reserves and mineral resources; completion of the PEA; expectations regarding the toll milling of Cigar Lake
ores; expectations regarding revenues and expenditure from operations at DES; capital expenditure programs, estimated exploration and development expenditures and reclamation costs and Denison’s share of same; exploration, development and
expansion plans and objectives; and statements regarding anticipated budgets, fees and expenditures. Statements relating to “mineral reserves” or “mineral resources” are deemed to be forward-looking information, as they involve
the implied assessment, based on certain estimates and assumptions that the mineral reserves and mineral resources described can be profitably produced in the future.
Forward looking statements are based on the opinions and estimates of management as of the date such statements are made, and they are subject to known
and unknown risks, uncertainties and other factors that may cause the actual results, level of activity, performance or achievements of Denison to be materially different from those expressed or implied by such forward-looking
statements. Denison believes that the expectations reflected in this forward-looking information are reasonable but no assurance can be given that these expectations will prove to be accurate and may differ materially from those anticipated in
this forward looking information. For a discussion in respect of risks and other factors that could influence forward-looking events, please refer to the factors discussed in the MD&A under the heading “Risk Factors”. These
factors are not, and should not be construed as being exhaustive.
Accordingly, readers should not place undue reliance on forward-looking
statements. The forward-looking information contained in this press release is expressly qualified by this cautionary statement. Any forward-looking information and the assumptions made with respect thereto speaks only as of the date of
this press release. Denison does not undertake any obligation to publicly update or revise any forward-looking information after the date of this press release to conform such information to actual results or to changes in Denison’s
expectations except as otherwise required by applicable legislation.
Cautionary Note to United States Investors Concerning Estimates of Measured,
Indicated and Inferred Mineral Resources: This press release may use the terms “measured”, “indicated” and “inferred” mineral resources. United States investors are advised that while such terms are recognized and
required by Canadian regulations, the United States Securities and Exchange Commission does not recognize them. “Inferred mineral resources” have a great amount of uncertainty as to their existence, and as to their economic and legal
feasibility. It cannot be assumed that all or any part of an inferred mineral resource will ever be upgraded to a higher category. Under Canadian rules, estimates of inferred mineral resources may not form the basis of feasibility or other economic
studies. United States investors are cautioned not to assume that all or any part of measured or indicated mineral resources will ever be converted into mineral reserves. United States investors are also cautioned not to assume
that all or any part of an inferred mineral resource exists, or is economically or legally mineable.
6
Exhibit 99.2

ANNUAL CONSOLIDATED FINANCIAL STATEMENTS
FOR THE YEAR ENDED DECEMBER 31, 2015

Responsibility for Financial Statements
The Company’s management is responsible for the integrity and fairness of presentation of these consolidated financial statements. The consolidated
financial statements have been prepared by management, in accordance with International Financial Reporting Standards as issued by the International Accounting Standards Board, for review by the Audit Committee and approval by the Board of
Directors.
The preparation of financial statements requires the selection of appropriate accounting policies in accordance with International
Financial Reporting Standards and the use of estimates and judgements by management to present fairly and consistently the consolidated financial position of the Company. Estimates are necessary when transactions affecting the current period cannot
be finalized with certainty until future information becomes available. In making certain material estimates, the Company’s management has relied on the judgement of independent specialists.
The Company’s management has developed and maintains a system of internal accounting controls to ensure, on a reasonable and cost-effective basis,
that the financial information is timely reported and is accurate and reliable in all material respects and that the Company’s assets are appropriately accounted for and adequately safeguarded.
The consolidated financial statements have been audited by PricewaterhouseCoopers LLP, our independent auditor. Its report outlines the scope of its
examination and expresses its opinions on the consolidated financial statements and internal control over financial reporting.
|
|
|
| Original signed by “David D.Cates” |
|
Original signed by “Gabriel (Mac) McDonald” |
|
|
| David D. Cates |
|
Gabriel (Mac) McDonald |
| President and Chief Executive Officer |
|
Vice-President Finance and Chief Financial Officer |
March 9, 2016
Management’s Report on Internal Control over Financial Reporting
The Company’s management is responsible for establishing and maintaining an adequate system of internal control over financial reporting. Management
conducted an evaluation of the effectiveness of internal control over financial reporting based on the Internal Control – Integrated Framework, 2013 issued by the Committee of Sponsoring Organizations of the Treadway Commission. Based on
this evaluation, management concluded that the Company’s internal control over financial reporting was effective as of December 31, 2015.
The effectiveness of the Company’s internal control over financial reporting as at December 31, 2015 has been audited by PricewaterhouseCoopers
LLP, our independent auditor, as stated in its report which appears herein.
Changes to Internal Control over Financial Reporting
There has not been any change in the Company’s internal control over financial reporting that occurred during 2015 that has
materially affected, or is reasonably likely to materially affect, the Company’s internal control over financial reporting.
2

March 9, 2016
Independent Auditor’s Report
To the Shareholders of
Denison Mines Corp.
We
have completed the integrated audits of the consolidated financial statements of Denison Mines Corp. and its subsidiaries for the years ending December 31, 2015 and December 31, 2014 and their internal control over financial reporting as
at December 31, 2015. Our opinions based on our audits are presented below.
Report on the consolidated financial statements
We have audited the accompanying consolidated financial statements of Denison Mines Corp. and its subsidiaries, which comprise the
consolidated statements of financial position as at December 31, 2015 and 2014 and the consolidated statements of income (loss) and comprehensive income (loss), changes in equity and cash flow for the years then ended, and the related notes,
which comprise a summary of significant accounting policies and other explanatory information.
Management’s responsibility for
the consolidated financial statements
Management is responsible for the preparation and fair presentation of these consolidated
financial statements in accordance with International Financial Reporting Standards (IFRS) as issued by the International Accounting Standards Board (IASB) and for such internal control as management determines is necessary to enable the preparation
of consolidated financial statements that are free from material misstatement, whether due to fraud or error.
Auditor’s
responsibility
Our responsibility is to express an opinion on these consolidated financial statements based on our audits. We
conducted our audits in accordance with Canadian generally accepted auditing standards and the standards of the Public Company Accounting Oversight Board (United States). Those standards require that we plan and perform the audit to obtain
reasonable assurance about whether the consolidated financial statements are free from material misstatement. Canadian generally accepted auditing standards also require that we comply with ethical requirements.
An audit involves performing procedures to obtain audit evidence, on a test basis, about the amounts and disclosures in the consolidated
financial statements. The procedures selected depend on the auditor’s judgment, including the assessment of the risks of material misstatement of the consolidated financial statements, whether due to fraud or error. In making those risk
assessments, the auditor considers internal control relevant to the company’s preparation and fair presentation of the consolidated financial statements in order to design audit procedures that are appropriate in the circumstances. An audit
also includes evaluating the appropriateness of accounting principles and policies used and the reasonableness of accounting estimates made by management, as well as evaluating the overall presentation of the consolidated financial statements.
|
|
|
| |
|
|
|
|
PricewaterhouseCoopers LLP PwC Tower,
18 York Street, Suite 2600, Toronto, Ontario, Canada M5J 0B2 T: +1 416 863 1133, F: +1 416 365 8215, www.pwc.com/ca
“PwC” refers to PricewaterhouseCoopers LLP, an Ontario limited liability
partnership. |
3
We believe that the audit evidence we have obtained in our audits is sufficient and
appropriate to provide a basis for our audit opinion on the consolidated financial statements.
Opinion
In our opinion, the consolidated financial statements present fairly, in all material respects, the financial position of Denison Mines Corp.
and its subsidiaries as at December 31, 2015 and 2014 and their financial performance and their cash flows for the years then ended in accordance with IFRS as issued by the IASB.
Emphasis of matter
Without qualifying our opinion, we draw attention to Note 2 in the consolidated financial statements which describe matters and conditions that
indicate the existence of material uncertainties that raise substantial doubt about the company’s ability to continue as a going concern.
Report on internal control over financial reporting
We have also audited Denison Mines Corp. and its subsidiaries’ internal control over financial reporting as at December 31, 2015,
based on criteria established in Internal Control - Integrated Framework (2013), issued by the Committee of Sponsoring Organizations of the Treadway Commission (COSO).
Management’s responsibility for internal control over financial reporting
Management is responsible for maintaining effective internal control over financial reporting and for its assessment of the effectiveness of
internal control over financial reporting included in the accompanying Management’s Report on Internal Control over Financial Reporting.
Auditor’s responsibility
Our responsibility is to express an opinion on the company’s internal control over financial reporting based on our audit. We conducted
our audit of internal control over financial reporting in accordance with the standards of the Public Company Accounting Oversight Board (United States). Those standards require that we plan and perform the audit to obtain reasonable assurance about
whether effective internal control over financial reporting was maintained in all material respects.
An audit of internal control over
financial reporting includes obtaining an understanding of internal control over financial reporting, assessing the risk that a material weakness exists, testing and evaluating the design and operating effectiveness of internal control, based on the
assessed risk, and performing such other procedures as we consider necessary in the circumstances.
We believe that our audit provides a
reasonable basis for our audit opinion on the company’s internal control over financial reporting.
Definition of internal control
over financial reporting
A company’s internal control over financial reporting is a process designed to provide reasonable
assurance regarding the reliability of financial reporting and the preparation of financial statements for external purposes in accordance with generally accepted accounting principles.
4
A company’s internal control over financial reporting includes those policies and
procedures that: (i) pertain to the maintenance of records that, in reasonable detail, accurately and fairly reflect the transactions and dispositions of the assets of the company; (ii) provide reasonable assurance that transactions are recorded as
necessary to permit preparation of financial statements in accordance with generally accepted accounting principles, and that receipts and expenditures of the company are being made only in accordance with authorizations of management and directors
of the company; and (iii) provide reasonable assurance regarding prevention or timely detection of unauthorized acquisition, use, or disposition of the company’s assets that could have a material effect on the financial statements.
Inherent limitations
Because of its inherent limitations, internal control over financial reporting may not prevent or detect misstatements. Also, projections of
any evaluation of effectiveness to future periods are subject to the risk that controls may become inadequate because of changes in conditions or that the degree of compliance with the policies or procedures may deteriorate.
Opinion
In our opinion,
Denison Mines Corp. and its subsidiaries maintained, in all material respects, effective internal control over financial reporting as at December 31, 2015, based on criteria established in Internal Control - Integrated Framework (2013) issued
by COSO.
(Signed) “PricewaterhouseCoopers LLP”
Chartered Professional Accountants, Licensed Public Accountants
Toronto, Ontario, Canada
5
Consolidated Statements of Financial Position
|
|
|
|
|
|
|
|
|
|
|
| |
|
| (Expressed in thousands of U.S. dollars except for share amounts) |
|
|
|
At December 31
2015 |
|
|
At December 31
2014 |
|
| |
|
|
|
|
|
| ASSETS |
|
|
|
|
|
|
|
|
|
|
| Current |
|
|
|
|
|
|
|
|
|
|
| Cash and cash equivalents (note 7) |
|
$ |
|
|
5,367 |
|
|
$ |
18,640 |
|
| Investments (note 10) |
|
|
|
|
7,282 |
|
|
|
4,381 |
|
| Trade and other receivables (note 8) |
|
|
|
|
4,826 |
|
|
|
9,411 |
|
| Inventories (note 9) |
|
|
|
|
2,256 |
|
|
|
2,240 |
|
| Prepaid expenses and other |
|
|
|
|
619 |
|
|
|
850 |
|
| |
|
|
|
|
|
|
20,350 |
|
|
|
35,522 |
|
| Non-Current |
|
|
|
|
|
|
|
|
|
|
| Inventories-ore in stockpiles (note 9) |
|
|
|
|
1,515 |
|
|
|
1,760 |
|
| Investments (note 10) |
|
|
|
|
496 |
|
|
|
954 |
|
| Restricted cash and investments (note 11) |
|
|
|
|
2,040 |
|
|
|
2,068 |
|
| Property, plant and equipment (note 12) |
|
|
|
|
188,250 |
|
|
|
270,388 |
|
| Intangibles (note 13) |
|
|
|
|
107 |
|
|
|
638 |
|
| |
|
| Total assets |
|
$ |
|
|
212,758 |
|
|
$ |
311,330 |
|
| |
|
|
|
|
|
| LIABILITIES |
|
|
|
|
|
|
|
|
|
|
| Current |
|
|
|
|
|
|
|
|
|
|
| Accounts payable and accrued liabilities |
|
$ |
|
|
4,574 |
|
|
$ |
10,050 |
|
| Current portion of long-term liabilities: |
|
|
|
|
|
|
|
|
|
|
| Post-employment benefits (note 14) |
|
|
|
|
217 |
|
|
|
259 |
|
| Reclamation obligations (note 15) |
|
|
|
|
624 |
|
|
|
706 |
|
| Debt obligations (note 16) |
|
|
|
|
300 |
|
|
|
30 |
|
| Other liabilities (note 17) |
|
|
|
|
1,863 |
|
|
|
1,935 |
|
| |
|
|
|
|
|
|
7,578 |
|
|
|
12,980 |
|
| Non-Current |
|
|
|
|
|
|
|
|
|
|
| Post-employment benefits (note 14) |
|
|
|
|
2,172 |
|
|
|
2,662 |
|
| Reclamation obligations (note 15) |
|
|
|
|
18,836 |
|
|
|
16,953 |
|
| Debt obligations (note 16) |
|
|
|
|
- |
|
|
|
9 |
|
| Other liabilities (note 17) |
|
|
|
|
652 |
|
|
|
841 |
|
| Deferred income tax liability (note 18) |
|
|
|
|
16,465 |
|
|
|
21,826 |
|
| |
|
| Total liabilities |
|
|
|
|
45,703 |
|
|
|
55,271 |
|
| |
|
|
|
|
|
| EQUITY |
|
|
|
|
|
|
|
|
|
|
| Share capital (note 19) |
|
|
|
|
1,130,779 |
|
|
|
1,120,758 |
|
| Share purchase warrants (note 20) |
|
|
|
|
- |
|
|
|
376 |
|
| Contributed surplus (note 21) |
|
|
|
|
53,965 |
|
|
|
53,321 |
|
| Deficit |
|
|
|
|
(944,097) |
|
|
|
(892,537) |
|
| Accumulated other comprehensive loss (note 22) |
|
|
|
|
(73,592) |
|
|
|
(25,859) |
|
| |
|
| Total equity |
|
|
|
|
167,055 |
|
|
|
256,059 |
|
| |
|
| Total liabilities and equity |
|
$ |
|
|
212,758 |
|
|
$ |
311,330 |
|
| |
|
|
|
|
|
| Issued and outstanding common shares (note 19) |
|
|
|
|
518,438,669 |
|
|
|
505,868,894 |
|
| |
|
| Going concern basis of accounting (note 2) |
|
|
|
|
|
|
|
|
|
|
| Commitments and contingencies (note 27) |
|
|
|
|
|
|
|
|
|
|
| Subsequent events (note 29) |
|
|
|
|
|
|
|
|
|
|
The accompanying notes are an integral part of the consolidated financial statements
On behalf of the Board of Directors:
|
|
|
| (Signed) “William A. Rand” |
|
(Signed) “Catherine J.G. Stefan” |
| Director |
|
Director |
6
Consolidated Statements of Income (Loss) and
Comprehensive Income (Loss)
|
|
|
|
|
|
|
|
|
|
|
|
|
| |
|
| |
|
|
|
Year Ended |
|
| (Expressed in thousands of U.S. dollars except for share and per share amounts) |
|
|
|
December 31
2015 |
|
|
|
|
December 31
2014 |
|
| |
|
|
|
|
|
|
| REVENUES (note 24) |
|
$ |
|
|
12,670 |
|
|
$ |
|
|
9,619 |
|
| |
|
|
|
|
|
|
| EXPENSES |
|
|
|
|
|
|
|
|
|
|
|
|
| Operating expenses (note 23, 24) |
|
|
|
|
(12,408) |
|
|
|
|
|
(11,651) |
|
| Mineral property exploration (note 24) |
|
|
|
|
(14,257) |
|
|
|
|
|
(14,401) |
|
| General and administrative (note 24) |
|
|
|
|
(6,463) |
|
|
|
|
|
(6,636) |
|
| Impairment of mineral properties (note 12) |
|
|
|
|
(27,767) |
|
|
|
|
|
(1,745) |
|
| Foreign exchange |
|
|
|
|
(16,042) |
|
|
|
|
|
(5,893) |
|
| Other income (expense) (note 23) |
|
|
|
|
(525) |
|
|
|
|
|
425 |
|
| |
|
|
|
|
|
|
(77,462) |
|
|
|
|
|
(39,901) |
|
| |
|
| Loss before finance charges |
|
|
|
|
(64,792) |
|
|
|
|
|
(30,282) |
|
|
|
|
|
|
| Finance expense (note 23) |
|
|
|
|
(714) |
|
|
|
|
|
(283) |
|
| |
|
| Loss before taxes |
|
|
|
|
(65,506) |
|
|
|
|
|
(30,565) |
|
| Income tax recovery (expense) (note 18): |
|
|
|
|
|
|
|
|
|
|
|
|
| Current |
|
|
|
|
- |
|
|
|
|
|
(5) |
|
| Deferred |
|
|
|
|
3,769 |
|
|
|
|
|
2,304 |
|
| |
|
| Loss from continuing operations |
|
|
|
|
(61,737) |
|
|
|
|
|
(28,266) |
|
| Net income (loss) from discontinued operations, net of tax (note 6) |
|
|
|
|
10,177 |
|
|
|
|
|
(3,437) |
|
| |
|
| Net loss for the period |
|
$ |
|
|
(51,560) |
|
|
$ |
|
|
(31,703) |
|
| |
|
|
|
|
|
|
| Other comprehensive income (loss): |
|
|
|
|
|
|
|
|
|
|
|
|
| Items that may be reclassified to loss: |
|
|
|
|
|
|
|
|
|
|
|
|
| Unrealized gain (loss) on investments-net of tax |
|
|
|
|
|
|
|
|
|
|
|
|
| Continuing operations |
|
|
|
|
(4) |
|
|
|
|
|
7 |
|
| Discontinued operations |
|
|
|
|
- |
|
|
|
|
|
- |
|
| Foreign currency translation change |
|
|
|
|
|
|
|
|
|
|
|
|
| Continuing operations |
|
|
|
|
(59,653) |
|
|
|
|
|
(22,813) |
|
| Discontinued operations |
|
|
|
|
11,924 |
|
|
|
|
|
4,676 |
|
| |
|
| Comprehensive loss for the period |
|
$ |
|
|
(99,293) |
|
|
$ |
|
|
(49,833) |
|
| |
|
|
|
|
|
|
| Basic and diluted net income (loss) per share: |
|
|
|
|
|
|
|
|
|
|
|
|
| Continuing operations |
|
$ |
|
|
(0.12) |
|
|
$ |
|
|
(0.06) |
|
| Discontinued operations |
|
$ |
|
|
0.02 |
|
|
$ |
|
|
(0.01) |
|
| All operations |
|
$ |
|
|
(0.10) |
|
|
$ |
|
|
(0.06) |
|
| |
|
|
|
|
|
|
| Weighted-average number of shares outstanding (in thousands): |
|
|
|
|
|
|
|
|
|
|
|
|
| Basic and diluted |
|
|
|
|
513,415 |
|
|
|
|
|
494,510 |
|
| |
|
The accompanying notes are an integral part of the consolidated financial statements
7
Consolidated Statements of Changes in Equity
|
|
|
|
|
|
|
|
|
|
|
|
|
| |
|
| |
|
|
|
Year Ended |
|
| (Expressed in thousands of U.S. dollars) |
|
|
|
December 31
2015 |
|
|
|
|
December 31
2014 |
|
| |
|
|
|
|
|
|
| Share capital |
|
|
|
|
|
|
|
|
|
|
|
|
| Balance-beginning of period |
|
$ |
|
|
1,120,758 |
|
|
$ |
|
|
1,092,144 |
|
| Share issues-net of issue costs |
|
|
|
|
11,318 |
|
|
|
|
|
12,845 |
|
| Flow-through share premium |
|
|
|
|
(2,028) |
|
|
|
|
|
(2,030) |
|
| Shares issued on acquisition of Rockgate Capital Corp (note 6) |
|
|
|
|
- |
|
|
|
|
|
3,034 |
|
| Shares issued on acquisition of International Enexco Limited (note 6) |
|
|
|
|
- |
|
|
|
|
|
11,979 |
|
| Shares issued to settle payable and accrued liability obligations (note 19) |
|
|
|
|
- |
|
|
|
|
|
610 |
|
| Share options exercised-cash |
|
|
|
|
5 |
|
|
|
|
|
946 |
|
| Share options exercised-non cash |
|
|
|
|
4 |
|
|
|
|
|
525 |
|
| Share purchase warrants exercised-cash |
|
|
|
|
406 |
|
|
|
|
|
405 |
|
| Share purchase warrants exercised–non-cash |
|
|
|
|
316 |
|
|
|
|
|
300 |
|
| |
|
| Balance-end of period |
|
|
|
|
1,130,779 |
|
|
|
|
|
1,120,758 |
|
| |
|
|
|
|
|
|
| Share purchase warrants |
|
|
|
|
|
|
|
|
|
|
|
|
| Balance-beginning of period |
|
|
|
|
376 |
|
|
|
|
|
616 |
|
| Warrants issued on acquisition of International Enexco Limited (note 6) |
|
|
|
|
- |
|
|
|
|
|
61 |
|
| Warrants exercised |
|
|
|
|
(316) |
|
|
|
|
|
(300) |
|
| Warrants expired |
|
|
|
|
(60) |
|
|
|
|
|
(1) |
|
| |
|
| Balance-end of period |
|
|
|
|
- |
|
|
|
|
|
376 |
|
| |
|
|
|
|
|
|
| Contributed surplus |
|
|
|
|
|
|
|
|
|
|
|
|
| Balance-beginning of period |
|
|
|
|
53,321 |
|
|
|
|
|
52,943 |
|
| Stock-based compensation expense |
|
|
|
|
588 |
|
|
|
|
|
800 |
|
| Share options issued on acquisition of International Enexco Limited (note 6) |
|
|
|
|
- |
|
|
|
|
|
102 |
|
| Share options exercised-non-cash |
|
|
|
|
(4) |
|
|
|
|
|
(525) |
|
| Warrants expired |
|
|
|
|
60 |
|
|
|
|
|
1 |
|
| |
|
| Balance-end of period |
|
|
|
|
53,965 |
|
|
|
|
|
53,321 |
|
| |
|
|
|
|
|
|
| Deficit |
|
|
|
|
|
|
|
|
|
|
|
|
| Balance-beginning of period |
|
|
|
|
(892,537) |
|
|
|
|
|
(860,834) |
|
| Net loss |
|
|
|
|
(51,560) |
|
|
|
|
|
(31,703) |
|
| |
|
| Balance-end of period |
|
|
|
|
(944,097) |
|
|
|
|
|
(892,537) |
|
| |
|
|
|
|
|
|
| Accumulated other comprehensive loss |
|
|
|
|
|
|
|
|
|
|
|
|
| Balance-beginning of period |
|
|
|
|
(25,859) |
|
|
|
|
|
(7,729) |
|
| Unrealized gain (loss) on investments |
|
|
|
|
(4) |
|
|
|
|
|
7 |
|
| Foreign currency translation |
|
|
|
|
(61,399) |
|
|
|
|
|
(18,137) |
|
| Foreign currency translation realized in net income |
|
|
|
|
13,670 |
|
|
|
|
|
- |
|
| |
|
| Balance-end of period |
|
|
|
|
(73,592) |
|
|
|
|
|
(25,859) |
|
| |
|
|
|
|
|
|
| Total Equity |
|
|
|
|
|
|
|
|
|
|
|
|
| Balance-beginning of period |
|
$ |
|
|
256,059 |
|
|
$ |
|
|
277,140 |
|
| |
|
| Balance-end of period |
|
$ |
|
|
167,055 |
|
|
$ |
|
|
256,059 |
|
| |
|
The accompanying notes are an integral part of the consolidated financial statements
8
Consolidated Statements of Cash Flow
|
|
|
|
|
|
|
|
|
|
|
|
|
| |
|
| |
|
|
|
Year Ended |
|
| (Expressed in thousands of U.S. dollars) |
|
|
|
December 31
2015 |
|
|
|
|
December 31
2014 |
|
| |
|
|
|
|
|
|
| CASH PROVIDED BY (USED IN): |
|
|
|
|
|
|
|
|
|
|
|
|
|
|
|
|
|
| OPERATING ACTIVITIES |
|
|
|
|
|
|
|
|
|
|
|
|
| Net loss for the period |
|
$ |
|
|
(51,560) |
|
|
$ |
|
|
(31,703) |
|
| Items not affecting cash: |
|
|
|
|
|
|
|
|
|
|
|
|
| Depletion, depreciation, amortization and accretion |
|
|
|
|
3,626 |
|
|
|
|
|
2,095 |
|
| Impairment-mineral properties (note 12) |
|
|
|
|
27,767 |
|
|
|
|
|
1,745 |
|
| Impairment-investments |
|
|
|
|
- |
|
|
|
|
|
22 |
|
| Stock-based compensation |
|
|
|
|
588 |
|
|
|
|
|
800 |
|
| Gain on divestiture of Mongolia Mining Division (note 6) |
|
|
|
|
(8,374) |
|
|
|
|
|
- |
|
| Gains on asset disposals |
|
|
|
|
(85) |
|
|
|
|
|
(449) |
|
| Losses on investments and restricted investments |
|
|
|
|
346 |
|
|
|
|
|
59 |
|
| Losses on reclamation obligation revisions |
|
|
|
|
2,262 |
|
|
|
|
|
2,086 |
|
| Non-cash inventory adjustments |
|
|
|
|
169 |
|
|
|
|
|
- |
|
| Deferred income tax recovery |
|
|
|
|
(3,769) |
|
|
|
|
|
(2,304) |
|
| Foreign exchange losses |
|
|
|
|
13,169 |
|
|
|
|
|
7,983 |
|
| Change in non-cash working capital items (note 23) |
|
|
|
|
(1,872) |
|
|
|
|
|
(3,834) |
|
| |
|
| Net cash used in operating activities |
|
|
|
|
(17,733) |
|
|
|
|
|
(23,500) |
|
| |
|
|
|
|
|
|
| INVESTING ACTIVITIES |
|
|
|
|
|
|
|
|
|
|
|
|
| Acquisition of asset group, net of cash and cash equivalents acquired: |
|
|
|
|
|
|
|
|
|
|
|
|
| Rockgate Capital Corp (note 6) |
|
|
|
|
- |
|
|
|
|
|
(57) |
|
| International Enexco Limited (note 6) |
|
|
|
|
- |
|
|
|
|
|
(141) |
|
| Divestiture of asset group, net of cash and cash equivalents divested: |
|
|
|
|
|
|
|
|
|
|
|
|
| Mongolia Mining Division (note 6) |
|
|
|
|
897 |
|
|
|
|
|
- |
|
| Sale of investments |
|
|
|
|
4,033 |
|
|
|
|
|
9,529 |
|
| Purchase of investments |
|
|
|
|
(8,134) |
|
|
|
|
|
(569) |
|
| Expenditures on property, plant and equipment |
|
|
|
|
(1,987) |
|
|
|
|
|
(859) |
|
| Proceeds on sale of property, plant and equipment |
|
|
|
|
115 |
|
|
|
|
|
265 |
|
| Decrease (increase) in restricted cash and investments |
|
|
|
|
(346) |
|
|
|
|
|
44 |
|
| |
|
| Net cash provided by (used in) investing activities |
|
|
|
|
(5,422) |
|
|
|
|
|
8,212 |
|
| |
|
|
|
|
|
|
| FINANCING ACTIVITIES |
|
|
|
|
|
|
|
|
|
|
|
|
| Increase (decrease) in debt obligations |
|
|
|
|
276 |
|
|
|
|
|
(53) |
|
| Issuance of common shares for: |
|
|
|
|
|
|
|
|
|
|
|
|
| New share issues-net of issue costs (note 19) |
|
|
|
|
11,318 |
|
|
|
|
|
12,845 |
|
| Share options exercised (note 19) |
|
|
|
|
5 |
|
|
|
|
|
946 |
|
| Share purchase warrants exercised (note 19) |
|
|
|
|
406 |
|
|
|
|
|
405 |
|
| |
|
| Net cash provided by financing activities |
|
|
|
|
12,005 |
|
|
|
|
|
14,143 |
|
| |
|
|
|
|
|
|
| Decrease in cash and cash equivalents |
|
|
|
|
(11,150) |
|
|
|
|
|
(1,145) |
|
| Foreign exchange effect on cash and cash equivalents |
|
|
|
|
(2,123) |
|
|
|
|
|
(2,001) |
|
| Cash and cash equivalents, beginning of period |
|
|
|
|
18,640 |
|
|
|
|
|
21,786 |
|
| |
|
| Cash and cash equivalents, end of period |
|
$ |
|
|
5,367 |
|
|
$ |
|
|
18,640 |
|
| |
|
|
|
|
|
|
| Supplemental cash flow disclosure: |
|
|
|
|
|
|
|
|
|
|
|
|
| Interest paid |
|
$ |
|
|
2 |
|
|
$ |
|
|
2 |
|
| Income taxes paid |
|
|
|
|
- |
|
|
|
|
|
- |
|
|
| |
|
The accompanying notes are an integral part of the consolidated financial statements
9
Notes to the consolidated financial statements for the years ended
December 31, 2015 and 2014
(Expressed in U.S. dollars except for shares and per share amounts)
Denison Mines Corp. and its subsidiary companies and joint arrangements (collectively, the “Company”) are engaged in uranium
mining related activities, including acquisition, exploration and development of uranium properties, extraction, processing and selling of uranium.
The Company has a 22.5% interest in the McClean Lake Joint Venture (“MLJV”) (which includes the McClean Lake mill) and a 25.17%
interest in the Midwest Joint Venture (“MWJV”), both of which are located in the Athabasca Basin of Saskatchewan, Canada. The McClean Lake mill provides toll milling services to the Cigar Lake Joint Venture (“CLJV”) under the
terms of a toll milling agreement between the parties. In addition, the Company has varying ownership interests in a number of evaluation and exploration projects located in Canada, Mali, Namibia and Zambia.
The Company provides mine decommissioning and decommissioned site monitoring services to third parties through its Denison Environmental
Services (“DES”) division and is also the manager of Uranium Participation Corporation (“UPC”), a publicly-listed investment holding company formed to invest substantially all of its assets in uranium oxide concentrates (“U3O8“) and uranium hexafluoride (“UF6”). The Company has no ownership
interest in UPC but receives fees for management services and commissions from the purchase and sale of U3O8 and UF6 by UPC.
Denison Mines Corp. (“DMC”) is incorporated under the
Business Corporations Act (Ontario) and domiciled in Canada. The address of its registered head office is 40 University Avenue, Suite 1100, Toronto, Ontario, Canada, M5J 1T1.
References to “2015” and “2014” refer to the year ended December 31, 2015 and the year ended December 31,
2014 respectively.
| 2. |
GOING CONCERN BASIS OF ACCOUNTING |
These consolidated financial statements have been prepared using International Financial Reporting Standards, as issued by the
International Accounting Standards Board, on a going concern basis, which assumes that the Company will be able to meet its obligations and continue its operations for the next twelve months.
At December 31, 2015, the Company has sufficient liquidity on hand to fund its planned operations for the fiscal 2016 year. However,
in the absence of additional funding, the Company anticipates that it will become non-compliant with the minimum cash covenant requirement of its letters of credit facility in 2016 and, as a result, there is substantial doubt upon the Company’s
ability to realize its assets and discharge its liabilities in the normal course of business, and accordingly, the appropriateness of the use of accounting principles applicable to a going concern. In order to both fund operations and maintain
rights under existing agreements, the Company must secure sufficient future funding. The Company is actively pursuing access to different sources of funding and while it has been successful in the past in obtaining financing for its activities,
there is no assurance that it will be able to obtain adequate financing in the future.
These financial statements do not reflect the
adjustments to the carrying values of assets and liabilities and the reported expenses and balance sheet classifications that would be necessary if the Company ceases to exist as a going concern in the normal course of operations. Such adjustments
could be material.
The consolidated financial statements have been prepared in accordance with International Financial Reporting Standards
(“IFRS”) as issued by the International Accounting Standards Board (“IASB”).
The Company’s presentation
currency is U.S dollars.
These financial statements were approved by the board of directors for issue on March 9, 2016.
10
| 4. |
ACCOUNTING POLICIES AND COMPARATIVE NUMBERS |
Significant Accounting Policies
The significant accounting policies used in the preparation of these consolidated financial statements are described below:
The financial statements of the Company include the accounts of DMC and its subsidiaries and joint operations. Subsidiaries are all
entities (including structured entities) over which the group has control. The group controls an entity where the group is exposed to, or has rights to, variable returns from its involvement with the entity and has the ability to affect those
returns through its power to direct the activities of the entity. Subsidiaries are fully consolidated from the date on which control is transferred to the group and are deconsolidated from the date that control ceases. Intercompany
transactions, balances and unrealized gains and losses from intercompany transactions are eliminated.
Joint operations include
various mineral property interests which are held through option or contractual agreements. These arrangements involve joint control of one or more of the assets acquired or contributed for the purpose of the joint operation. The
consolidated financial statements of the Company include its share of the assets in such joint operations, together with its share of the liabilities, revenues and expenses arising jointly or otherwise from those operations. All such amounts
are measured in accordance with the terms of each arrangement.
| |
(b) |
Foreign currency translation |
| |
(i) |
Functional and presentation currency |
Items included in the financial statements of each entity in the DMC group are measured using the currency of the primary economic
environment in which the entity operates (“the functional currency”). Primary and secondary indicators are used to determine the functional currency. Primary indicators include the currency that mainly influences sales prices, labour,
material and other costs. Secondary indicators include the currency in which funds from financing activities are generated and in which receipts from operating activities are usually retained. For our entities located in Canada, Mali, Namibia and
Zambia, the local currency has been determined to be the functional currency.
The consolidated financial statements are presented
in U.S. dollars, unless otherwise stated.
The financial statements of entities that have a functional currency different from the
presentation currency of DMC (“foreign operations”) are translated into U.S. dollars as follows: assets and liabilities-at the closing rate at the date of the statement of financial position, and income and expenses-at the average rate of
the period (as this is considered a reasonable approximation to actual rates). All resulting changes are recognized in other comprehensive income or loss as cumulative foreign currency translation adjustments.
When the Company disposes of its entire interest in a foreign operation, or loses control, joint control, or significant influence over
a foreign operation, the foreign currency gains or losses accumulated in other comprehensive income or loss related to the foreign operation are recognized in the statement of income or loss as translational foreign exchange gains or losses.
| |
(ii) |
Transactions and balances |
Foreign currency transactions are translated into an entity’s functional currency using the exchange rates prevailing at the dates
of the transactions. Foreign exchange gains and losses resulting from the settlement of foreign currency transactions and from the translation at year-end exchange rates of monetary assets and liabilities denominated in currencies other than an
operation’s functional currency are recognized in the statement of income or loss as transactional foreign exchange gains or losses.
| |
(c) |
Cash and cash equivalents |
Cash and cash equivalents include cash on hand, deposits held with banks, and other short-term highly liquid investments with original
maturities of three months or less which are subject to an insignificant risk of changes in value.
11
| |
(d) |
Financial instruments |
Financial assets and financial liabilities are recognized when the Company becomes a party to the contractual provisions of the financial
instrument. Financial assets are derecognized when the rights to receive cash flows from the assets have expired or have been transferred and the Company has transferred substantially all risks and rewards of ownership. Financial liabilities
are derecognized when the obligations specified in the contract is discharged, cancelled or expires.
At initial recognition, the
Company classifies its financial instruments in the following categories:
| |
(i) |
Financial assets and liabilities at fair value through profit or loss (“FVPL”) |
A financial asset or liability is classified in this category if acquired principally for the purpose of selling or repurchasing in the
short-term. Financial instruments in this category are recognized initially and subsequently at fair value. Transaction costs are expensed in the statement of income or loss. Gains and losses arising from changes in fair value are
presented in the statement of income or loss in the period in which they arise.
| |
(ii) |
Available-for-sale investments |
Available-for-sale investments are recognized initially at fair value plus transaction costs and are subsequently carried at fair
value. Gains or losses arising from re-measurement are recognized in other comprehensive income or loss. When an available-for-sale investment is sold or impaired, the accumulated gains or losses are moved from accumulated other
comprehensive income or loss to the statement of income or loss.
| |
(iii) |
Held-to-maturity investments |
Held-to-maturity investments are non-derivative financial assets with fixed or determinable payments and fixed maturities that are
intended to be held to maturity. Held-to-maturity investments are initially recognized at fair value plus transaction costs and subsequently measured at amortized cost using the effective interest method less a provision for impairment.
| |
(iv) |
Loans and receivables |
Loans and receivables are non-derivative financial assets with fixed or determinable payments that are not quoted in an active
market. Loans and receivables are initially recognized at the amount expected to be received, less a discount (when material) to reduce the loans and receivables to fair value. Subsequently, loans and receivables are measured at amortized
cost using the effective interest method less a provision for impairment.
| |
(v) |
Financial liabilities at amortized cost |
Financial liabilities are initially recognized at the amount required to be paid, less a discount (when material) to reduce the
financial liabilities to fair value. Subsequently, financial liabilities are measured at amortized cost using the effective interest method.
The Company has designated its financial assets and liabilities as follows:
| |
(i) |
“Cash and cash equivalents” and “Trade and other receivables” are classified as loans and receivables and are measured at amortized cost
using the effective interest rate method, with the exception of contingent consideration which is classified as a financial asset at fair value through profit and loss (note 4(s)). Interest income is recorded in net income through finance income
(expense), as applicable; |
| |
(ii) |
A portion of “Investments” are classified as FVPL and any period change in fair value is recorded in net income within other income (expense). The
remaining amount is classified as available-for-sale and any period change in fair value is recorded in other comprehensive income. When the investment’s value becomes impaired, the loss is recognized in net income within other income (expense)
in the period of impairment; |
| |
(iii) |
“Restricted cash and investments” is classified as held-to-maturity investments; and |
| |
(iv) |
“Accounts payable and accrued liabilities” and “Debt obligations” are classified as other financial liabilities and are measured at
amortized cost using the effective interest rate method. Interest expense is recorded in net income through finance income (expense), as applicable. |
12
| |
(e) |
Impairment of financial assets |
At each reporting date, the Company assesses whether there is objective evidence that a financial asset (other than a financial asset
classified as fair value through profit and loss) is impaired. Objective evidence of an impairment loss includes: i) significant financial difficulty of the debtor; ii) delinquencies in interest or principal payments; iii) increased probability
that the borrower will enter bankruptcy or other financial reorganization; and (iv) in the case of equity investments, a significant or prolonged decline in the fair value of the security below its cost.
If such evidence exists, the Company recognizes an impairment loss, as follows:
| |
(i) |
Financial assets carried at amortized cost: The loss is the difference between the amortized cost of the loan or receivable and the present value of the
estimated future cash flows, discounted using the instrument’s original effective interest rate. The carrying amount of the asset is reduced by this amount either directly or indirectly through the use of an allowance account.
|
| |
(ii) |
Available-for-sale financial assets: The impairment loss is the difference between the original cost of the asset and its fair value at the measurement
date, less any impairment losses previously recognized in the statement of income. This amount represents the cumulative loss in accumulated other comprehensive income that is reclassified to net income. |
Expenditures, including depreciation, depletion and amortization of production assets, incurred in the mining and processing activities
that will result in the future concentrate production are deferred and accumulated as ore in stockpiles and in-process and concentrate inventories. These amounts are carried at the lower of average costs or net realizable value (“NRV”).
NRV is the difference between the estimated future concentrate price (net of selling costs) and estimated costs to complete production into a saleable form.
Stockpiles are comprised of coarse ore that has been extracted from the mine and is available for further processing. Mining
production costs are added to the stockpile as incurred and removed from the stockpile based upon the average cost per tonne of ore produced from mines considered to be in commercial production. The current portion of ore in stockpiles
represents the amount expected to be processed in the next twelve months.
In-process and concentrate inventories include the cost of
the ore removed from the stockpile, a pro-rata share of the amortization of the associated mineral property, as well as production costs incurred to process the ore into a saleable product. Processing costs typically include labor, chemical
reagents and directly attributable mill overhead expenditures. Items are valued at weighted average cost.
Materials and other
supplies held for use in the production of inventories are carried at average cost and are not written down below that cost if the finished products in which they will be incorporated are expected to be sold at or above cost. However, when a
decline in the price of concentrates indicates that the cost of the finished products exceeds net realizable value, the materials are written down to net realizable value. In such circumstances, the replacement cost of the materials may be the
best available measure of their net realizable value.
| |
(g) |
Property, plant and equipment |
Property, plant and equipment are recorded at acquisition or production cost and carried net of depreciation and impairments. Cost
includes expenditures incurred by the Company that are directly attributable to the acquisition of the asset. Subsequent costs are included in the asset’s carrying amount or recognized as a separate asset, as appropriate, only when it is
probable that future economic benefits associated with the item will flow to the Company and the cost can be measured reliably. The carrying amount of a replaced asset is derecognized when replaced. Repairs and maintenance costs are charged to the
statement of income during the period in which they are incurred.
Depreciation is calculated on a straight line or unit of
production basis as appropriate. Where a straight line methodology is used, the assets are depreciated to their estimated residual value over an estimated useful life which ranges from three to twenty years depending upon the asset type. Where a
unit of production methodology is used, the assets are depreciated to their estimated residual value over the useful life defined by management’s best estimate of recoverable reserves and resources in the current mine plan. When assets are
retired or sold, the resulting gains or losses are reflected in the statement of income or loss as a
13
component of other income or expense. The Company allocates the amount initially recognized in respect of an item of property, plant and equipment to its significant parts and depreciates
separately each such part. Residual values, method of depreciation and useful lives of the assets are reviewed at least annually and adjusted if appropriate.
Where straight-line depreciation is utilized, the range of useful lives for various asset classes is generally as follows:
|
|
|
|
|
|
|
| Buildings |
|
|
|
15 - 20 years; |
|
|
| Production machinery and equipment |
|
|
|
5 - 7 years; |
|
|
| Other |
|
|
|
3 - 5 years; |
|
|
| |
(h) |
Mineral property acquisition, exploration, evaluation and development costs |
Costs relating to the acquisition of acquired mineral rights and acquired exploration rights are capitalized.
Exploration expenditures are expensed as incurred.
Evaluation expenditures are expensed as incurred, until an area of interest is considered by management to be sufficiently advanced. Once
this determination is made, the area of interest is classified as an evaluation stage mineral property, a component of the Company’s mineral properties, and all further non-exploration expenditures for the current and subsequent periods are
capitalized. These expenses include further evaluation expenditures such as mining method selection and optimization, metallurgical sampling test work and costs to further delineate the ore body to a higher confidence level.
Once commercial and technical viability has been established for a property, the property is classified as a development stage mineral
property and all further development costs are capitalized to the asset. Further development costs include costs related to constructing a mine, such as shaft sinking and access, lateral development, drift development, engineering studies and
environmental permitting, infrastructure development and the costs of maintaining the site until commercial production.
Such capital
costs represent the net expenditures incurred and capitalized as at the balance sheet date and do not necessarily reflect present or future values.
Once a development stage mineral property goes into commercial production, the property is classified as “Producing” and the
accumulated costs are amortized over the estimated recoverable resources in the current mine plan using a unit of production basis. Commercial production occurs when a property is substantially complete and ready for its intended use.
| |
(i) |
Identifiable Intangible assets |
The Company’s identifiable intangible assets are stated at cost less accumulated amortization. These assets are capitalized and
amortized on a straight-line basis in the statement of income or loss over the period of their expected useful lives. The useful lives of the assets are reviewed at least annually and adjusted if appropriate.
| |
(j) |
Impairment of non-financial assets |
Property, plant and equipment and intangible assets are assessed at the end of each reporting period to determine if there is any
indication that the asset may be impaired. If any such indication exists, an estimate of the recoverable amount of the asset is made. For the purpose of measuring recoverable amounts, assets are grouped at the lowest levels for which there are
separately identifiable cash inflows or CGUs. The recoverable amount is the higher of an asset’s fair value less costs of disposal and value in use (being the present value of the expected future cash flows of the relevant asset or CGU, as
determined by management). An impairment loss is recognized for the amount by which the CGU’s carrying amount exceeds its recoverable amount.
Mineral property assets are tested for impairment using the impairment indicators under IFRS 6 “Exploration for and Evaluation of
Mineral Resources” up until the commercial and technical feasibility for the property is established. From that point onwards, mineral property assets are tested for impairment using the impairment indicators of IAS 36 “Impairment of
Assets”.
14
| |
(i) |
Post-employment benefit obligations |
The Company assumed the obligation of a predecessor company to provide life insurance, supplemental health care and dental benefits,
excluding pensions, to its former Canadian employees who retired from active service prior to 1997. The estimated cost of providing these benefits is actuarially determined using the projected benefits method and is recorded on the balance
sheet at its estimated present value. The interest cost on this unfunded liability is being accreted over the remaining lives of this retiree group. Experience gains and losses are being deferred as a component of accumulated other
comprehensive income or loss and are adjusted, as required, on the obligations re-measurement date.
| |
(ii) |
Stock-based compensation |
The Company uses a fair value-based method of accounting for stock options to employees and to non-employees. The fair value is
determined using the Black-Scholes option pricing model on the date of the grant. The cost is recognized on a graded method basis, adjusted for expected forfeitures, over the applicable vesting period as an increase in stock-based compensation
expense and the contributed surplus account. When such stock options are exercised, the proceeds received by the Company, together with the respective amount from contributed surplus, are credited to share capital.
| |
(iii) |
Termination benefits |
The Company recognizes termination benefits when it is demonstrably committed to either terminating the employment of current employees
according to a detailed formal plan without possibility of withdrawal, or providing benefits as a result of an offer made to encourage voluntary termination. Benefits falling due more than twelve months after the end of the reporting period are
discounted to their present value.
| |
(l) |
Reclamation provisions |
Reclamation provisions, any legal and constructive obligation related to the retirement of tangible long-lived assets, are recognized
when such obligations are incurred and if a reasonable estimate of the value can be determined. These obligations are measured initially at the present value of expected cash flows using a pre-tax discount rate reflecting risks specific to the
liability and the resulting costs are capitalized and added to the carrying value of the related assets. In subsequent periods, the liability is adjusted for the accretion of the discount and the expense is recorded in the statement of income
or loss. Changes in the amount or timing of the underlying future cash flows or changes in the discount rate are immediately recognized as an increase or decrease in the carrying amounts of the related asset and liability. These costs are
amortized to the results of operations over the life of the asset. Reductions in the amount of the liability are first applied against the amount of the net reclamation asset on the books with any excess value being recorded in the statement of
income or loss.
The Company’s activities are subject to numerous governmental laws and regulations. Estimates of future
reclamation liabilities for asset decommissioning and site restoration are recognized in the period when such liabilities are incurred. These estimates are updated on a periodic basis and are subject to changing laws, regulatory requirements,
changing technology and other factors which will be recognized when appropriate. Liabilities related to site restoration include long-term treatment and monitoring costs and incorporate total expected costs net of recoveries. Expenditures incurred
to dismantle facilities, restore and monitor closed resource properties are charged against the related reclamation and remediation liability.
Provisions for restructuring costs and legal claims, where applicable, are recognized in liabilities when the Company has a present legal
or constructive obligation as a result of past events, it is probable that an outflow of resources will be required to settle the obligation, and the amount can be reliably estimated. Provisions are measured at management’s best estimate of the
expenditure required to settle the obligation at the end of the reporting period, and are discounted to present value where the effect is material. The Company performs evaluations to identify onerous contracts and, where applicable, records
provisions for such contracts.
15
| |
(n) |
Current and Deferred Income tax |
Current income tax payable is based on taxable income for the period. Taxable income differs from income as reported in the statement of
income or loss because it excludes items of income or expense that are taxable or deductible in other periods and it further excludes items that are never taxable or deductible. The Company’s liability for current tax is calculated using tax
rates that have been enacted or substantively enacted by the balance sheet date.
Deferred income taxes are accounted for using the
balance sheet liability method. Deferred income tax assets and liabilities are computed based on temporary differences between the financial statement carrying values of the existing assets and liabilities and their respective income tax bases
used in the computation of taxable income. Computed deferred tax liabilities are generally recognized for all taxable temporary differences and deferred tax assets are recognized to the extent that it is probable that taxable income will be
available against which deductible temporary differences can be utilized. Such assets and liabilities are not recognized if the temporary difference arises from goodwill or from the initial recognition (other than in a business combination) of
other assets and liabilities in a transaction that affects neither the taxable income nor the accounting income. Deferred tax liabilities are recognized for taxable temporary differences arising on investments in subsidiaries and investments,
and interests in joint ventures, except where the Company is able to control the reversal of the temporary differences and it is probable that the temporary differences will not reverse in the foreseeable future. The carrying amount of deferred
tax assets is reviewed at each balance sheet date and reduced to the extent that it is no longer probable that sufficient taxable earnings will be available to allow all or part of the asset to be recovered.
Deferred tax is calculated at the tax rates that are expected to apply in the period when the liability is settled or the asset realized,
based on tax rates and tax laws that have been enacted or substantively enacted by the balance sheet date. Deferred tax is charged or credited to income, except when it relates to items charged or credited directly to equity, in which case the
deferred tax is also recorded within equity.
Income tax assets and liabilities are offset when there is a legally enforceable right
to offset the assets and liabilities and when they relate to income taxes levied by the same tax authority on either the same taxable entity or different taxable entities where there is an intention to settle the balance on a net basis.
| |
(o) |
Flow-Through Common Shares |
The Company’s Canadian exploration activities have been financed in part through the issuance of flow-through common shares whereby
the Canadian income tax deductions relating to these expenditures are claimable by the subscribers and not by the Company. The proceeds from issuing flow-through shares are allocated between the offering of shares and the sale of tax benefits. The
allocation is based on the difference (“premium”) between the quoted price of the Company’s existing shares and the amount the investor pays for the actual flow-through shares. A liability is recognized for the premium when the shares
are issued, and is extinguished when the tax effect of the temporary differences, resulting from the renunciation, is recorded - with the difference between the liability and the value of the tax assets renounced being recorded as a deferred tax
expense. The tax effect of the renunciation is recorded at the time the Company makes the renunciation to its subscribers – which may differ from the effective date of renunciation. If the flow-through shares are not issued at a premium, a
liability is not established, and on renunciation the full value of the tax assets renounced is recorded as a deferred tax expense.
Revenue from the sale of mineral concentrates is recognized when it is probable that the economic benefits will flow to the
Company. This is generally the case once delivery has occurred, the sales price and costs incurred with respect to the transaction can be measured reliably and collectability is reasonably assured. For uranium, revenue is typically
recognized when delivery is evidenced by book transfer at the applicable uranium storage facility.
Revenue from toll milling
services is recognized as material is processed in accordance with the specifics of the applicable toll milling agreement. Revenue and unbilled accounts receivable are recorded as related costs are incurred using billing formulas included in
the applicable toll milling agreement.
Revenue on environmental service contracts is recognized using the percentage of completion
method, whereby sales, earnings and unbilled accounts receivable are recorded as related costs are incurred. Earnings rates are adjusted periodically as a result of revisions to projected contract revenues and
16
estimated costs of completion. Losses, if any, are recognized fully when first anticipated. Revenues from engineering services are recognized as the services are provided in accordance
with customer agreements.
Management fees from UPC are recognized as management services are provided under the contract on a
monthly basis. Commission revenue earned on acquisition or sale of U3O8 and
UF6 on behalf of UPC (or other parties where Denison acts as an agent) is recognized on the date when title passes.
| |
(q) |
Earnings (loss) per share |
Basic earnings per share (“EPS”) is calculated by dividing the net income or loss for the period attributable to equity owners
of DMC by the weighted average number of common shares outstanding during the period.
Diluted EPS is calculated by adjusting the
weighted average number of common shares outstanding for dilutive instruments. The number of shares included with respect to options, warrants and similar instruments is computed using the treasury stock method.
| |
(r) |
Discontinued Operations |
A discontinued operation is a component of the Company that has either been disposed of or that is classified as held for sale. A
component of the Company is comprised of operations and cash flows that can be clearly distinguished, operationally and for financial reporting purposes, from the rest of the Company. Net income or loss of a discontinued operation and any gain
or loss on disposal are combined and presented as net income or loss from discontinued operations, net of tax, in the statement of income or loss.
| |
(s) |
Contingent Consideration |
Contingent consideration receivable on the sale of assets is recognized, as a financial asset through income or loss, at fair value on
the date of sale. Subsequent changes to the fair value of contingent consideration will be recognized in the statement of income or loss at each reporting date and on settlement.
Accounting Standards Issued But Not Yet Applied
The Company has not yet adopted the following new accounting pronouncements which are effective for fiscal periods of the Company
beginning on or after January 1, 2016:
International Financial Reporting Standard 9, Financial Instruments (“IFRS 9”)
In July 2014, the IASB published the final version of IFRS 9 Financial Instruments (“IFRS 9”), which brings
together the classification, measurement, impairment and hedge accounting phases of the IASB’s project to replace IAS 39 Financial Instruments: Recognition and Measurement. IFRS 9 replaces the multiple classifications for financial assets in
IAS 39 with a single principle based approach for determining the classification of financial assets based on how an entity manages its financial instruments in the context of its business model and the contractual cash flow characteristics of the
financial assets. The new standard also requires a single impairment method to be used, replacing the multiple impairment methods in IAS 39. The final version of IFRS 9 is effective for periods beginning on or after January 1, 2018; however, it
is available for early adoption.
The Company has not evaluated the impact of adopting this standard.
International Financial Reporting Standard 15, Revenue from Contracts with Customers (“IFRS 15”)
IFRS 15 deals with revenue recognition and establishes principles for reporting useful information to users of financial statements about
the nature, amount, timing and uncertainty of revenue and cash flows arising from an entity’s contracts with customers. Revenue is recognized when a customer obtains control of a good or service. The standard replaces IAS 18 “Revenue”
and IAS 11”Construction Contracts” and related interpretations. The standard is effective for annual periods beginning on or after January 1, 2018 and earlier application is permitted.
The Company has not evaluated the impact of adopting this standard.
17
International Financial Reporting Standard 16, Leases (“IFRS 16”)
In January 2016, the IASB issued IFRS 16 which replaces existing standards and interpretations under IAS 17 “Leases”. IFRS
16 requires all leases, including financing and operating leases, to be reported on the balance sheet with the intent of providing greater transparency on a company’s lease assets and liabilities. IFRS 16 is effective for annual periods
beginning on or after January 1, 2019 with early adoption permitted.
The Company has not evaluated the impact of adopting this
standard.
Comparative Numbers
On November 30, 2015, the Company completed a transaction with Uranium Industry a.s. (“Uranium Industry”) to sell all of
its mining assets and operations located in Mongolia (see note 6). The Company is treating the sale as a discontinued operation and has adjusted the presentation of its consolidated statement of comprehensive income (loss) in accordance with its
accounting policy for discontinued operations. Adjustments have also been made to the supplemental note disclosure relating to the statement of comprehensive income (loss). The consolidated statements of financial position and the consolidated
statement of cash flows have not been revised.
| 5. |
CRITICAL ACCOUNTING ESTIMATES AND JUDGEMENTS |
The preparation of consolidated financial statements in accordance with IFRS requires the use of certain critical accounting estimates
and judgements that affect the amounts reported. It also requires management to exercise judgement in applying the Company’s accounting policies. These judgements and estimates are based on management’s best knowledge of the relevant facts
and circumstances taking into account previous experience. Although the Company regularly reviews the estimates and judgements made that affect these financial statements, actual results may be materially different.
Significant estimates and judgements made by management relate to:
| |
(a) |
Determination of a Mineral Property being Sufficiently Advanced |
The Company follows a policy of capitalizing non-exploration related expenditures on properties it considers to be sufficiently
advanced. Once a mineral property is determined to be sufficiently advanced, that determination is irrevocable and the capitalization policy continues to apply over the life of the property. In determining whether or not a mineral property
is sufficiently advanced, management considers a number of factors, including, but not limited to: current uranium market conditions, the quality of resources identified, access to the resource, the suitability of the resource to current mining
methods, ease of permitting, confidence in the jurisdiction in which the resource is located and milling complexity.
Many of these
factors are subject to risks and uncertainties that can support a “sufficiently advanced” determination as at one point in time but not support it at another. The final determination requires significant judgment on the part of the
Company’s management and directly impacts the carrying value of the Company’s mineral properties.
| |
(b) |
Mineral Property Impairment Reviews and Impairment Adjustments |
Mineral properties are tested for impairment when events or changes in circumstances indicate that the carrying amount may not be
recoverable. When an indicator is identified, the Company determines the recoverable amount of the property, which is the higher of an asset’s fair value less costs of disposal and value in use. An impairment loss is recognized if the
carrying value exceeds the recoverable amount. The recoverable amount of a mineral property may be determined by reference to estimated future operating results and discounted net cash flows, current market valuations of similar properties or a
combination of the above. In undertaking this review, management of the Company is required to make significant estimates of, amongst other things: reserve and resource amounts, future production and sale volumes, forecast commodity prices, future
operating, capital and reclamation costs to the end of the mine’s life and current market valuations from observable market data which may not be directly comparable. These estimates are subject to various risks and uncertainties, which may
ultimately have an effect on the expected recoverable amount of a specific mineral property asset. Changes in these estimates could have a material impact the carrying value of the mineral property amounts and the impairment losses recognized.
18
| |
(c) |
Deferred Tax Assets and Liabilities |
Deferred tax assets and liabilities are computed in respect of taxes that are based on taxable profit. Taxable profit will often
differ from accounting profit and management may need to exercise judgement to determine whether some taxes are income taxes (and subject to deferred tax accounting) or operating expenses.
Deferred tax assets and liabilities are measured using enacted or substantively enacted tax rates expected to apply when the temporary
differences between accounting carrying values and tax basis are expected to be recovered or settled. The determination of the ability of the Company to utilize tax loss carry forwards to offset deferred tax liabilities requires management to
exercise judgment and make certain assumptions about the future performance of the Company. Management is required to assess whether it is “probable” that the Company will benefit from these prior losses and other deferred tax assets.
Changes in economic conditions, commodity prices and other factors could result in revisions to the estimates of the benefits to be realized or the timing of utilizing the losses.
| |
(d) |
Reclamation Obligations |
Asset retirement obligations are recorded as a liability when the asset is initially constructed or a constructive or legal obligation
exists and typically involve identifying costs to be incurred in the future and discounting them to the present using an appropriate discount rate for the liability. The determination of future costs involves a number of estimates relating to
timing, type of costs, mine closure plans, and review of potential methods and technical advancements. Furthermore, due to uncertainties concerning environmental remediation, the ultimate cost of the Company’s decommissioning liability could
differ materially from amounts provided. The estimate of the Company’s obligation is subject to change due to amendments to applicable laws and regulations and as new information concerning the Company’s operations becomes available. The
Company is not able to determine the impact on its financial position, if any, of environmental laws and regulations that may be enacted in the future.
| |
(e) |
Contingent Consideration |
The fair value of contingent consideration is remeasured at each reporting period. The determination of fair value requires
judgement in estimating the likely outcome of the components of the contingent consideration, including but not limited to the likelihood of approval of mining licenses and the achievement of production thresholds, based on information available to
management.
| 6. |
ACQUISITIONS AND DIVESTITURES |
Discontinued Operation - Sale of Mongolia Mining Division
On November 30, 2015, the Company completed its transaction with Uranium Industry to sell all of its mining assets and operations
located in Mongolia (the “Mongolia Mining Division”). The primary assets of the Mongolia Mining Division are the exploration licenses for the Hairhan, Haraat, Gurvan Saihan and Ulzit projects.
As consideration for the sale, the Company received cash consideration of $1,250,000 prior to closing and the rights to receive
additional contingent consideration of $12,000,000. The contingent consideration is payable as follows:
| |
● |
|
$5,000,000 (the “First Contingent Payment”) within 60 days of the issuance of a mining license for an area covered by any of the exploration
licenses in the Mongolia Mining Division (the “First Project”); |
| |
● |
|
$5,000,000 (the “Second Contingent Payment”) within 60 days of the issuance of a mining license for an area covered by any of the other exploration
licenses held by the Mongolia Mining Division (the “Second Project”); |
| |
● |
|
$1,000,000 (the “Third Contingent Payment”) within 365 days following the production of an aggregate of 1,000 pounds U3O8 from the operation of the First Project; and |
| |
● |
|
$1,000,000 (the “Fourth Contingent Payment”) within 365 days following the production of an aggregate of 1,000 pounds U3O8 from the operation of the Second Project. |
On December 2, 2015, Uranium Industry submitted applications for mining licenses for all four projects to the Mongolian government
(see note 29).
19
The details of the net assets of the Mongolia Mining Division sold to Uranium Industry
on November 30, 2015 are as follows:
|
|
|
|
|
|
|
| |
| (in thousands, except share amounts) |
|
|
|
|
|
| |
|
|
|
| Consideration received or receivable at fair value: |
|
|
|
|
|
|
| Cash consideration prior to closing |
|
$ |
1,250 |
|
|
|
| Fair value of contingent consideration |
|
|
- |
|
|
|
| Transaction costs |
|
|
(337 |
) |
|
|
| |
| Consideration received or receivable at fair value |
|
$ |
913 |
|
|
|
| |
|
|
|
| Net assets disposed of at carrying value: |
|
|
|
|
|
|
| Cash |
|
$ |
(16 |
) |
|
|
| Property, plant and equipment |
|
|
|
|
|
|
| Plant and equipment |
|
|
(90 |
) |
|
|
| Mineral properties-Mongolia |
|
|
(6,130 |
) |
|
|
| |
| Total assets |
|
|
(6,236 |
) |
|
|
| |
|
|
|
| Accounts payable and accrued liabilities |
|
|
17 |
|
|
|
| |
| Net assets disposed of at carrying value |
|
$ |
(6,219 |
) |
|
|
| |
|
|
|
| Cumulative foreign currency gain translation adjustment |
|
$ |
13,680 |
|
|
|
|
|
|
| Gain on disposal of Mongolia Mining Division |
|
$ |
8,374 |
|
|
|
| |
The contingent consideration, which is contingent on the approval of mining licenses and
achievement of certain production thresholds, has been recognized at a fair value of $Nil in the financial statements at this time and will be remeasured at each subsequent reporting date until settlement.
A detailed breakdown of the discontinued operations statement of income (loss) and a summary of the impact of the discontinued operations
on the consolidated statement of cash flows is presented below.
The consolidated statement of income (loss) for the Mongolia Mining
Division discontinued operation for 2015 and 2014 is as follows:
|
|
|
|
|
|
|
|
|
| |
|
| |
|
Year Ended |
|
| (in thousands) |
|
December 31
2015 |
|
|
December 31
2014 |
|
| |
|
|
|
|
| Expenses |
|
|
|
|
|
|
|
|
| Operating expenses |
|
|
(15) |
|
|
|
- |
|
| Mineral property exploration |
|
|
(384) |
|
|
|
(394) |
|
| General and administrative |
|
|
(692) |
|
|
|
(954) |
|
| Foreign exchange income (expense) |
|
|
|
|
|
|
|
|
| Transactional |
|
|
2,873 |
|
|
|
(2,090) |
|
| Other income (expense) |
|
|
|
|
|
|
|
|
| Gain on disposal |
|
|
8,374 |
|
|
|
- |
|
| Other |
|
|
20 |
|
|
|
- |
|
| |
|
|
|
|
10,176 |
|
|
|
(3,438) |
|
| |
|
| Income (loss) before finance charges |
|
|
10,176 |
|
|
|
(3,438) |
|
| Finance income |
|
|
1 |
|
|
|
1 |
|
| |
|
| Income (loss) before taxes |
|
|
10,177 |
|
|
|
(3,437) |
|
| Income tax recovery (expense) |
|
|
- |
|
|
|
- |
|
| |
|
| Net income (loss) for the period |
|
|
$ 10,177 |
|
|
|
$ (3,437) |
|
| |
|
The gain on disposal of $8,374,000 includes $13,680,000 of cumulative foreign currency gains
recognized as translational foreign exchange gains in the period of disposal.
20
Cash flows for the Mongolia Mining Division discontinued operation for 2015 and 2014 is
as follows:
|
|
|
|
|
|
|
|
|
|
|
| |
|
| |
|
|
|
Year Ended |
|
| (in thousands) |
|
|
|
December 31
2015 |
|
|
December 31
2014 |
|
| |
|
|
|
|
|
| Cash inflow (outflow): |
|
|
|
|
|
|
|
|
|
|
| Operating activities |
|
|
|
|
(1,060) |
|
|
|
(1,315) |
|
| Investing activities |
|
|
|
|
(523) |
|
|
|
(104) |
|
| Financing activities |
|
|
|
|
- |
|
|
|
- |
|
| |
|
| Net cash outflow for the period |
|
$ |
|
|
(1,583) |
|
|
$ |
(1,419) |
|
| |
|
Acquisition of International Enexco Limited
On June 6, 2014, Denison completed a plan of arrangement (the “IEC Arrangement”) to acquire all of the outstanding shares,
options and warrants of International Enexco Limited (“IEC”). IEC’s principal uranium assets included a 30% interest in the Mann Lake exploration project and a 20% interest in the Bachman Lake Joint Venture, both located in
Saskatchewan, Canada. Prior to completing the IEC Arrangment, IEC also owned a subsidiary holding an indirect interest in IEC’s Contact Copper project and its other US properties (“Spinco”).
Pursuant to the IEC Arrangement, the former shareholders of IEC ultimately exchanged each IEC common share held for 0.26 of a Denison
common share (the “Exchange Ratio”). Outstanding warrants and options of IEC were exchanged for options and warrants of Denison adjusted by the Exchange Ratio. The Denison options received on exchange expired 90 days after the IEC
Arrangement completion date while the Denison warrants received on exchange retained the expiry dates of the originally issued IEC warrants.
As part of the IEC Arrangement, IEC’s shareholders also received a pro rata distribution of Spinco shares on a one-for-one basis and
one-half of a warrant to acquire an additional Spinco share, exercisable for 6 months, at a price of CAD$5.00 for each whole share to be acquired. Each holder of IEC options and warrants also received replacement options and warrants, as the case
may be, from Spinco with the same terms and conditions as the IEC options and warrants being replaced.
For accounting purposes, IEC
was not considered a business under IFRS 3 “Business Combinations” as at the time of the acquisition it was not capable of generating outputs that could provide a return to Denison. As a result, the IEC Arrangement was accounted for as an
asset acquisition with share based consideration. Transaction costs incurred by Denison related to the IEC Arrangement were capitalized as part of the consideration amount. Denison is including the results of IEC as part of its Canadian mining
segment for reporting purposes.
The following table summarizes the fair value of the IEC assets acquired and the liabilities assumed
at the acquisition date of June 6, 2014:
|
|
|
|
|
|
|
| |
| (in thousands) |
|
IEC
Fair Value |
|
|
|
| |
|
|
|
| Cash and cash equivalents |
|
$ |
206 |
|
|
|
| Trade and other receivables |
|
|
421 |
|
|
|
| Prepaid expenses and other |
|
|
15 |
|
|
|
| Property, plant and equipment |
|
|
|
|
|
|
| Mineral properties-Canada |
|
|
14,120 |
|
|
|
| |
| Total assets |
|
|
14,762 |
|
|
|
| |
|
|
|
| Accounts payable and accrued liabilities |
|
|
1,319 |
|
|
|
| Reclamation obligations |
|
|
20 |
|
|
|
| |
| Net assets |
|
$ |
13,423 |
|
|
|
| |
21
The total consideration relating to the IEC Arrangement is summarized below:
|
|
|
|
|
|
|
| |
| (in thousands except for share amounts) |
|
|
|
|
|
| |
|
|
|
| Fair value of 10,229,035 common shares issued by Denison |
|
$ |
11,979 |
|
|
|
| Fair value of 660,127 common share purchase warrants issued by Denison |
|
|
61 |
|
|
|
| Fair value of 902,200 common share options issued by Denison |
|
|
102 |
|
|
|
| Fair value of IEC shares held by Denison prior to acquisition |
|
|
934 |
|
|
|
| Costs incurred by the Company pursuant to arrangement: |
|
|
|
|
|
|
| Transaction costs |
|
|
347 |
|
|
|
| |
| Fair value of total consideration |
|
$ |
13,423 |
|
|
|
| |
The fair value of the common shares was determined using Denison’s closing share price on June
6, 2014 of CAD$1.28 converted to USD$ using the June 6, 2014 foreign exchange rate of 0.9149.
The fair value of the common share
purchase warrants issued by Denison to replace those of IEC totaled $61,000 or $0.0924 per warrant. The fair value was determined using the Black-Scholes option pricing model with the following assumptions: risk-free interest rate of 1.06%,
expected stock price volatility between 38.56% and 48.62%, expected life between 0.50 years and 1.25 years and expected dividend yield of nil%.
The fair value of the common share options issued by Denison to replace those of IEC totaled $102,000 or $0.1131 per option. The
fair value was determined using the Black-Scholes option pricing model with the following assumptions: risk-free interest rate of 1.06%, expected stock price volatility of 34.85%, expected life of 0.25 years and expected dividend yield of
nil%. As at June 6, 2014, all of the options issued to replace the IEC options were fully-vested.
Acquisition of
Rockgate Capital Corp
In September 2013, Denison formally commenced a takeover bid to acquire all of the outstanding shares
of Rockgate Capital Corp. (“Rockgate”). Rockgate’s key mining asset was its Falea uranium-copper-silver project located in Mali.
Under the terms of the takeover bid, Rockgate shareholders received 0.192 of a common share of Denison for each Rockgate share
held. As at December 6, 2013, Denison had acquired 104,852,532 shares of Rockgate, equivalent to an initial 89.72% ownership amount and valued the remaining 12,014,561 shares of Rockgate (or 10.28%) owned by non-controlling interests at
$3,091,000. On January 17, 2014, pursuant to a plan of arrangement with the same terms as the takeover bid, Denison acquired the remaining 10.28% non-controlling interest of Rockgate it had not previously acquired under its takeover bid in
2013.
For accounting purposes, Rockgate was not considered a business under IFRS 3 “Business Combinations” as at the time
of the acquisition was not capable of generating outputs that could provide a return to Denison. As a result, the Rockgate transaction was accounted for as an asset acquisition with share based consideration. Transaction costs incurred by Denison
related to the Rockgate transaction were capitalized as part of the consideration amount. Denison is including the results of Rockgate as part of its African mining segment for reporting purposes.
The total consideration relating to the acquisition of Rockgate’s non-controlling interests in 2014 is summarized below:
|
|
|
|
|
|
|
| |
| (in thousands except for share amounts) |
|
|
|
|
|
| |
|
|
|
| Fair value of 2,312,622 common shares issued by Denison under plan of arrangement |
|
$ |
3,034 |
|
|
|
| Costs incurred by the Company pursuant to the acquisition: |
|
|
|
|
|
|
| Plan of arrangement transaction costs |
|
|
57 |
|
|
|
| |
| Fair value of total consideration |
|
$ |
3,091 |
|
|
|
| |
The fair value of the common shares issued by Denison under the plan of arrangement to acquire the
non-controlling interest totaled $3,034,000. The fair value of the common shares was determined using Denison’s closing share price on January 17, 2014 of CAD$1.44 converted to USD$ using the January 17, 2014 foreign exchange rate of
0.9111.
22
| 7. |
CASH AND CASH EQUIVALENTS |
The cash and cash equivalent balance consists of:
|
|
|
|
|
|
|
|
|
| |
|
| (in thousands) |
|
At December 31
2015 |
|
|
At December 31
2014 |
|
| |
|
|
|
|
| Cash |
|
$ |
3,092 |
|
|
$ |
2,265 |
|
| Cash in MLJV and MWJV |
|
|
9 |
|
|
|
885 |
|
| Cash equivalents |
|
|
2,266 |
|
|
|
15,490 |
|
| |
|
|
|
$ |
5,367 |
|
|
$ |
18,640 |
|
| |
|
Cash equivalents consist of various money market funds.
| 8. |
TRADE AND OTHER RECEIVABLES |
The trade and other receivables balance consists of:
|
|
|
|
|
|
|
|
|
| |
|
| (in thousands) |
|
At December 31
2015 |
|
|
At December 31
2014 |
|
| |
|
|
|
|
| Trade receivables-other |
|
$ |
1,860 |
|
|
$ |
2,138 |
|
| Receivables in MLJV and MWJV |
|
|
2,824 |
|
|
|
7,127 |
|
| Sales tax receivables |
|
|
8 |
|
|
|
131 |
|
| Sundry receivables |
|
|
134 |
|
|
|
15 |
|
| |
|
|
|
$ |
4,826 |
|
|
$ |
9,411 |
|
| |
|
The
inventories balance consists of:
|
|
|
|
|
|
|
|
|
| |
|
| (in thousands) |
|
At December 31
2015 |
|
|
At December 31
2014 |
|
| |
|
|
|
|
| Uranium concentrates and work-in-progress |
|
$ |
380 |
|
|
$ |
433 |
|
| Inventory of ore in stockpiles |
|
|
1,515 |
|
|
|
1,834 |
|
| Mine and mill supplies |
|
|
1,876 |
|
|
|
1,733 |
|
| |
|
|
|
$ |
3,771 |
|
|
$ |
4,000 |
|
| |
|
|
|
|
| Inventories-by duration: |
|
|
|
|
|
|
|
|
| Current |
|
$ |
2,256 |
|
|
$ |
2,240 |
|
| Long term-ore in stockpiles |
|
|
1,515 |
|
|
|
1,760 |
|
| |
|
|
|
$ |
3,771 |
|
|
$ |
4,000 |
|
| |
|
Long-term ore in stockpile inventory represents an estimate of the amount of ore on the stockpile
in excess of the next twelve months of planned mill production.
23
The
investments balance consists of:
|
|
|
|
|
|
|
|
|
| |
|
| (in thousands) |
|
At December 31
2015 |
|
|
At December 31
2014 |
|
| |
|
|
|
|
| Investments: |
|
|
|
|
|
|
|
|
| Equity instruments-fair value through profit and loss |
|
$ |
484 |
|
|
$ |
932 |
|
| Equity instruments-available for sale |
|
|
12 |
|
|
|
22 |
|
| Debt instruments-fair value through profit and loss |
|
|
7,282 |
|
|
|
4,381 |
|
| |
|
|
|
$ |
7,778 |
|
|
$ |
5,335 |
|
| |
|
|
|
|
| Investments-by duration |
|
|
|
|
|
|
|
|
| Current |
|
$ |
7,282 |
|
|
$ |
4,381 |
|
| Long-term |
|
|
496 |
|
|
|
954 |
|
| |
|
|
|
$ |
7,778 |
|
|
$ |
5,335 |
|
| |
|
At December 31, 2015, investments include equity instruments in publicly-traded companies with
a fair value of $496,000 (December 31, 2014: $954,000) and debt instruments with a fair value of $7,282,000 (December 31, 2014: $4,381,000). The debt instruments at December 31, 2015 consist of guaranteed investment certificates
with rates of interest ranging between 1.15% to 1.80% and maturity dates occurring up to May 2016.
Investment Purchases,
Sales, Maturities, Impairments and Other Movements
During 2015, the Company purchased debt instruments at a cost of
$8,134,000. During 2014, the Company purchased additional equity instruments at a cost of $569,000.
During 2015, the Company
had debt instrument maturities of $4,029,000 and it sold equity instruments for $4,000. During 2014, the Company had debt instrument maturities of $9,529,000.
During 2014, the Company recorded impairment charges on equity instruments of $22,000. The resulting loss has been included in other
income (expense) in the consolidated statements of income (loss) (see note 23).
During 2014, an amount of $934,000 was transferred
out of fair value through profit and loss equity instruments as part of the IEC acquisition (see note 6). This transfer represented the fair value of the equity instruments held by the Company on the date of acquisition of IEC.
| 11. |
RESTRICTED CASH AND INVESTMENTS |
The Company has certain restricted cash and investments deposited to collateralize its reclamation obligations. The restricted cash
and investments balance consists of:
|
|
|
|
|
|
|
|
|
| |
|
| (in thousands) |
|
At December 31
2015 |
|
|
At December 31
2014 |
|
| |
|
|
|
|
| Cash |
|
$ |
234 |
|
|
$ |
42 |
|
| Cash equivalents |
|
|
- |
|
|
|
104 |
|
| Investments |
|
|
1,806 |
|
|
|
1,922 |
|
| |
|
|
|
$ |
2,040 |
|
|
$ |
2,068 |
|
| |
|
|
|
|
| Restricted cash and investments-by item: |
|
|
|
|
|
|
|
|
| Elliot Lake reclamation trust fund |
|
$ |
2,040 |
|
|
$ |
2,068 |
|
| |
|
|
|
$ |
2,040 |
|
|
$ |
2,068 |
|
| |
|
The investment at December 31, 2015 consists of a term deposit.
24
Elliot Lake Reclamation Trust Fund
The Company has the obligation to maintain its decommissioned Elliot Lake uranium mine pursuant to a Reclamation Funding Agreement
effective December 21, 1995 (“Agreement”) with the Governments of Canada and Ontario. The Agreement, as further amended in February 1999, requires the Company to maintain funds in the Reclamation Trust Fund equal to estimated
reclamation spending for the succeeding six calendar years, less interest expected to accrue on the funds during the period. Withdrawals from this Reclamation Trust Fund can only be made with the approval of the Governments of Canada and Ontario to
fund Elliot Lake monitoring and site restoration costs.
In 2015, the Company deposited an additional $832,000 (CAD$1,042,000) into
the Elliot Lake Reclamation Trust Fund and withdrew $511,000 (CAD$651,000). In 2014, the Company deposited an additional $545,000 (CAD$603,000) into the Elliot Lake Reclamation Trust Fund and withdrew $617,000 (CAD$680,000).
| 12. |
PROPERTY, PLANT AND EQUIPMENT |
The property, plant and equipment balance consists of:
|
|
|
|
|
|
|
|
|
|
|
|
|
| |
|
| (in thousands) |
|
|
|
|
At December 31
2015 |
|
|
At December 31
2014 |
|
| |
|
|
|
|
|
| Plant and equipment: |
|
|
|
|
|
|
|
|
|
|
|
|
| Cost |
|
|
|
|
|
$ |
72,716 |
|
|
$ |
82,980 |
|
| Construction-in-progress |
|
|
|
|
|
|
4,542 |
|
|
|
6,960 |
|
| Accumulated depreciation |
|
|
|
|
|
|
(11,640) |
|
|
|
(12,205) |
|
| |
|
| Net book value |
|
|
|
|
|
$ |
65,618 |
|
|
$ |
77,735 |
|
| |
|
|
|
|
|
| Mineral properties: |
|
|
|
|
|
|
|
|
|
|
|
|
| Cost |
|
|
|
|
|
$ |
122,797 |
|
|
$ |
192,851 |
|
| Accumulated amortization |
|
|
|
|
|
|
(165) |
|
|
|
(198) |
|
| |
|
| Net book value |
|
|
|
|
|
$ |
122,632 |
|
|
$ |
192,653 |
|
| |
|
|
|
|
|
|
|
|
|
|
|
|
|
|
| |
|
| Net book value |
|
|
|
|
|
$ |
188,250 |
|
|
$ |
270,388 |
|
| |
|
| The plant and equipment continuity summary is as follows:
|
|
|
|
|
|
|
|
|
|
|
|
|
| |
|
| (in thousands) |
|
Cost |
|
|
Accumulated
Amortization / Depreciation |
|
|
Net
Book Value |
|
| |
|
|
|
|
|
| Plant and equipment: |
|
|
|
|
|
|
|
|
|
|
|
|
| Balance-January 1, 2014 |
|
$ |
94,321 |
|
|
$ |
(12,627) |
|
|
$ |
81,694 |
|
| Additions |
|
|
240 |
|
|
|
- |
|
|
|
240 |
|
| Amortization |
|
|
- |
|
|
|
(15) |
|
|
|
(15) |
|
| Depreciation |
|
|
- |
|
|
|
(817) |
|
|
|
(817) |
|
| Disposals |
|
|
(67) |
|
|
|
67 |
|
|
|
- |
|
| Reclamation adjustment (note 15) |
|
|
3,502 |
|
|
|
14 |
|
|
|
3,516 |
|
| Foreign exchange |
|
|
(8,056) |
|
|
|
1,173 |
|
|
|
(6,883) |
|
| |
|
| Balance-December 31, 2014 |
|
$ |
89,940 |
|
|
$ |
(12,205) |
|
|
$ |
77,735 |
|
| |
|
|
|
|
|
| Additions |
|
|
604 |
|
|
|
- |
|
|
|
604 |
|
| Amortization |
|
|
- |
|
|
|
(82) |
|
|
|
(82) |
|
| Asset divestitures (note 6) |
|
|
(260) |
|
|
|
170 |
|
|
|
(90) |
|
| Depreciation |
|
|
- |
|
|
|
(2,216) |
|
|
|
(2,216) |
|
| Disposals |
|
|
(423) |
|
|
|
393 |
|
|
|
(30) |
|
| Reclamation adjustment (note 15) |
|
|
2,186 |
|
|
|
78 |
|
|
|
2,264 |
|
| Foreign exchange |
|
|
(14,789) |
|
|
|
2,222 |
|
|
|
(12,567) |
|
| |
|
| Balance-December 31, 2015 |
|
$ |
77,258 |
|
|
$ |
(11,640) |
|
|
$ |
65,618 |
|
| |
|
25
The mineral property continuity summary is as follows:
|
|
|
|
|
|
|
|
|
|
|
|
|
| |
|
| (in thousands) |
|
Cost |
|
|
Accumulated
Amortization |
|
|
Net
Book Value |
|
| |
|
|
|
|
|
| Mineral properties: |
|
|
|
|
|
|
|
|
|
|
|
|
| Balance-January 1, 2014 |
|
$ |
199,532 |
|
|
$ |
(216) |
|
|
$ |
199,316 |
|
| Additions |
|
|
729 |
|
|
|
- |
|
|
|
729 |
|
| Asset acquisitions (note 6) |
|
|
14,120 |
|
|
|
- |
|
|
|
14,120 |
|
| Impairment |
|
|
(1,745) |
|
|
|
- |
|
|
|
(1,745) |
|
| Foreign exchange |
|
|
(19,785) |
|
|
|
18 |
|
|
|
(19,767) |
|
| |
|
| Balance-December 31, 2014 |
|
$ |
192,851 |
|
|
$ |
(198) |
|
|
$ |
192,653 |
|
| |
|
|
|
|
|
| Additions |
|
|
1,436 |
|
|
|
- |
|
|
|
1,436 |
|
| Asset divestitures (note 6) |
|
|
(6,130) |
|
|
|
- |
|
|
|
(6,130) |
|
| Impairment |
|
|
(27,767) |
|
|
|
- |
|
|
|
(27,767) |
|
| Foreign exchange |
|
|
(37,593) |
|
|
|
33 |
|
|
|
(37,560) |
|
| |
|
| Balance-December 31, 2015 |
|
$ |
122,797 |
|
|
$ |
(165) |
|
|
$ |
122,632 |
|
| |
|
Plant and Equipment - Mining
The Company has a 22.5% interest in the McClean Lake mill located in the Athabasca Basin of Saskatchewan, Canada. A toll milling
agreement has been signed with the participants in the CLJV that provides for the processing of the future output of the Cigar Lake mine at the McClean Lake mill, for which the owners of the McClean Lake mill receive a toll milling fee and other
benefits. In determining the units of production amortization rate for the McClean Lake mill, the amount of production attributable to the mill assets has been adjusted to include Denison’s expected share of mill feed related to the CLJV toll
milling contract.
In March 2014, the first ore from the Cigar Lake mine was received at the mill. In September 2014,
after being on stand-by since August 2010, milling activities were restarted at the McClean Lake mill and uranium packaging began in October 2014.
Plant and Equipment - Services and Other
The environmental services division of the Company provides mine decommissioning and decommissioned site monitoring services for third
parties.
Mineral Properties
The Company has various interests in exploration and evaluation projects located in Canada, Mali, Namibia and Zambia which are held
directly or through option or various contractual agreements.
Canada Mining Segment
The Company’s mineral property interests in Canada with significant carrying values and their locations are:
| |
a) |
McClean Lake (Saskatchewan) - the Company has a 22.5% interest in the project (includes the Sue D, Sue E, Caribou, McClean North and McClean South deposits);
|
| |
b) |
Midwest (Saskatchewan) - the Company has a 25.17% interest in the project (includes the Midwest and Midwest A deposits); |
| |
c) |
Wheeler River (Saskatchewan) - the Company has a 60% interest in the project (includes the Phoenix and Gryphon deposits); |
| |
d) |
Waterbury Lake (Saskatchewan) - the Company has a 61.55% interest in the project (includes the J Zone deposit) and also has a 2.0% net smelter return royalty
on the portion of the project it does not own; |
| |
e) |
Mann Lake (Saskatchewan) - the Company has a 30% interest in the project; and |
| |
f) |
Wolly (Saskatchewan) - the Company has a 22.5% interest in the project. |
In March 2014, the Company recognized an impairment charge of $1,658,000 to reflect the abandonment of the Black Lake property.
26
In June 2014, Denison completed the sale of its land holdings related to the Way
Lake and Yurchison properties for cash and share consideration valued at $202,000. The sale resulted in a gain of $202,000 which has been included in other income (expense) in the consolidated statements of operations.
In June 2014, Denison received a cash payment of CAD$250,000 from SeqUr Exploration Inc (“SeqUr”) as part of an option
agreement entered into between the parties in December 2013 involving the Jasper Lake property. The receipt has been reflected as a gain in other income (expense). In February 2015, SeqUr terminated its option to earn an interest in
the Jasper Lake property.
In June 2014, Denison completed the acquisition of IEC and acquired mineral property interests in
Canada with a fair value of $14,120,000 (see note 6). As a result of the IEC Arrangement, Denison acquired a 30% interest in the Mann Lake project and increased its interest in the Bachman Lake project from 80% to 100%.
In September 2015, the Company’s interest increased in the Waterbury Lake property from 60.00% to 61.55% under the terms of the
dilution provisions in the agreements governing the project (see note 25).
In December 2015, due to the Company’s current
intention to let claims on three of its Canadian properties lapse in the normal course and to not carry out the required exploration programs or make deficiency deposit payments needed to maintain the claims, the Company has recognized impairment
charges of $2,603,000. The $nil recoverable amount of the properties is based on a market-based fair value less costs of disposal assessment using unobservable inputs including the Company’s data about the properties and management’s
interpretation of that data. As such, it is classified within Level 3 of the fair value hierarchy. A value in use calculation is not applicable as the Company does not have any expected cash flows from using these properties at this stage.
Africa Mining Segment - Mali, Namibia and Zambia
The Company’s mineral property interests in Africa and their specific country locations are:
| |
a) |
Falea (Mali) - the Company has a 100% interest in the Falea project (includes the Falea deposit). This project was acquired as part of the Rockgate
acquisition in November 2013; |
| |
b) |
Dome (Namibia) - the Company has a 90% interest in the Dome project. This project was acquired as part of the Fission Energy Corp acquisition in
April 2013; and |
| |
c) |
Mutanga (Zambia) - The Company has a 100% interest in the Mutanga project (includes the Mutanga, Dibwe and Dibwe East deposits). The project was acquired
in August 2007; |
In November 2014, Denison released its land holdings related to the Telwa Gada property
in Niger (also acquired as part of the Rockgate acquisition) and recognized an impairment charge of $87,000 in its results to reflect the abandonment of this property. At December 2014, the Company no longer had any mineral property
interests in Niger.
In December 2015, in light of the intention to pursue a spin-out or disposal strategy and the adoption of
minimal exploration plans for its African properties for the upcoming fiscal year, the Company completed an impairment test of its African properties and has recognized impairment charges of $25,164,000. The Company used a market-based fair
value less costs of disposal analysis, adjusted for certain unobservable inputs, to determine the recoverable amount of $3,264,000 for the Falea, Dome and Mutanga projects combined. As a result of these unobservable inputs, it is classified
within Level 3 of the fair value hierarchy. A value in use calculation is not applicable as the Company does not have any expected cash flows from using its African properties at this stage of operations.
Asia Mining Segment - Mongolia
Prior to November 2015, the Company had an 85% interest in and was the managing partner of the Gurvan Saihan Joint Venture
(“GSJV”) in Mongolia (which included the Hairhan and Haraat deposits and the Hairhan, Haraat, Gurvan Saihan and Ulzit exploration licenses).
In November 2015, the Company has divested its mineral property assets in Mongolia as part of the sale of the Mongolia Mining
Division to Uranium Industry (see note 6).
27
The
intangibles balance consists of:
|
|
|
|
|
|
|
|
|
|
|
|
|
| |
|
| (in thousands) |
|
|
|
|
At December 31
2015 |
|
|
At December 31
2014 |
|
| |
|
|
|
|
|
| Cost |
|
|
|
|
|
$ |
5,347 |
|
|
$ |
6,379 |
|
| Accumulated amortization |
|
|
|
|
|
|
(5,240) |
|
|
|
(5,741) |
|
| |
|
| Net book value |
|
|
|
|
|
$ |
107 |
|
|
$ |
638 |
|
| |
|
|
|
|
|
| Net book value-by item: |
|
|
|
|
|
|
|
|
|
|
|
|
| UPC management services agreement |
|
|
|
|
|
$ |
107 |
|
|
$ |
638 |
|
| |
|
| Net book value |
|
|
|
|
|
$ |
107 |
|
|
$ |
638 |
|
| |
|
| The intangibles continuity summary is as follows:
|
|
|
|
|
|
|
|
|
|
|
|
|
| |
|
| (in thousands) |
|
Cost |
|
|
Accumulated
Amortization |
|
|
Net
Book Value |
|
| |
|
|
|
|
|
| Balance-January 1, 2014 |
|
$ |
6,957 |
|
|
$ |
(5,705) |
|
|
$ |
1,252 |
|
| Amortization |
|
|
- |
|
|
|
(536) |
|
|
|
(536) |
|
| Foreign exchange |
|
|
(578) |
|
|
|
500 |
|
|
|
(78) |
|
| |
|
| Balance-December 31, 2014 |
|
$ |
6,379 |
|
|
$ |
(5,741) |
|
|
$ |
638 |
|
| |
|
|
|
|
|
| Amortization |
|
|
- |
|
|
|
(464) |
|
|
|
(464) |
|
| Foreign exchange |
|
|
(1,032) |
|
|
|
965 |
|
|
|
(67) |
|
| |
|
| Balance-December 31, 2015 |
|
$ |
5,347 |
|
|
$ |
(5,240) |
|
|
$ |
107 |
|
| |
|
UPC Management Services Agreement
The intangible from the UPC management services agreement is associated with the acquisition of Denison Mines Inc (“DMI”) in
2006. The contract is being amortized over its estimated useful life (see note 25).
| 14. |
POST-EMPLOYMENT BENEFITS |
The Company provides post-employment benefits for former Canadian employees who retired on immediate pension prior to 1997. The
post-employment benefits provided include life insurance and medical and dental benefits as set out in the applicable group policies but does not include pensions. No post-employment benefits are provided to employees outside the employee group
referenced above. The post-employment benefit plan is not funded.
The effective date of the most recent actuarial valuation of
the accrued benefit obligation is December 31, 2011. The amount accrued is based on estimates provided by the plan administrator which are based on past experience, limits on coverage as set out in the applicable group policies and
assumptions about future cost trends. The significant assumptions used in the valuation are listed below:
| |
● |
|
Discount rate of 3.65%; |
| |
● |
|
Medical cost trend rates at 7.00% per annum initially, grading down to 4.50% per annum over 20 years and remaining at 4.50% per annum thereafter; and
|
| |
● |
|
Dental cost trend rates at 4.00% per annum for the first ten years, 3.50% per annum for the following ten years and 3.0% per annum thereafter;
|
28
The post-employment benefits balance consists of:
|
|
|
|
|
|
|
|
|
| |
|
| (in thousands) |
|
At December 31
2015 |
|
|
At December 31
2014 |
|
| |
|
|
|
|
| Accrued benefit obligation |
|
$ |
2,389 |
|
|
$ |
2,921 |
|
| |
|
|
|
$ |
2,389 |
|
|
$ |
2,921 |
|
| |
|
|
|
|
| Post-employment benefits liability-by duration: |
|
|
|
|
|
|
|
|
| Current |
|
$ |
217 |
|
|
$ |
259 |
|
| Non-current |
|
|
2,172 |
|
|
|
2,662 |
|
| |
|
|
|
$ |
2,389 |
|
|
$ |
2,921 |
|
| |
|
| The post-employment benefits continuity summary is as follows:
|
|
|
|
|
|
|
|
|
| |
|
| (in thousands) |
|
|
|
|
|
|
| |
|
|
|
|
| Balance-January 1, 2014 |
|
|
|
|
|
$ |
3,321 |
|
| Benefits paid |
|
|
|
|
|
|
(244) |
|
| Interest cost |
|
|
|
|
|
|
114 |
|
| Foreign exchange |
|
|
|
|
|
|
(270) |
|
| |
|
| Balance-December 31, 2014 |
|
|
|
|
|
$ |
2,921 |
|
| |
|
|
|
|
| Benefits paid |
|
|
|
|
|
|
(160) |
|
| Interest cost |
|
|
|
|
|
|
95 |
|
| Foreign exchange |
|
|
|
|
|
|
(467) |
|
| |
|
| Balance-December 31, 2015 |
|
|
|
|
|
$ |
2,389 |
|
| |
|
| 15. |
RECLAMATION OBLIGATIONS |
The reclamation obligations balance consists of:
|
|
|
|
|
|
|
|
|
| |
|
| (in thousands) |
|
At December 31
2015 |
|
|
At December 31
2014 |
|
| |
|
|
|
|
| Reclamation liability-by location: |
|
|
|
|
|
|
|
|
| Elliot Lake |
|
$ |
11,610 |
|
|
$ |
11,234 |
|
| McClean and Midwest Joint Ventures |
|
|
7,834 |
|
|
|
6,406 |
|
| Other |
|
|
16 |
|
|
|
19 |
|
| |
|
|
|
$ |
19,460 |
|
|
$ |
17,659 |
|
| |
|
|
|
|
| Reclamation and remediation liability-by duration: |
|
|
|
|
|
|
|
|
| Current |
|
$ |
624 |
|
|
$ |
706 |
|
| Non-current |
|
|
18,836 |
|
|
|
16,953 |
|
| |
|
|
|
$ |
19,460 |
|
|
$ |
17,659 |
|
| |
|
29
The reclamation obligations continuity summary is as follows:
|
|
|
|
|
| |
|
| (in thousands) |
|
|
|
| |
|
|
|
| Balance-January 1, 2014 |
|
$ |
12,208 |
|
| Accretion |
|
|
720 |
|
| Asset acquisition (note 6) |
|
|
20 |
|
| Expenditures incurred |
|
|
(593) |
|
| Future expenditures reimbursed by CLJV |
|
|
883 |
|
| Liability adjustments-income statement (note 23) |
|
|
2,086 |
|
| Liability adjustments-balance sheet (note 12) |
|
|
3,516 |
|
| Foreign exchange |
|
|
(1,181) |
|
| |
|
| Balance-December 31, 2014 |
|
$ |
17,659 |
|
| |
|
|
|
| Accretion |
|
|
836 |
|
| Expenditures incurred |
|
|
(517) |
|
| Liability adjustments-income statement (note 23) |
|
|
2,262 |
|
| Liability adjustments-balance sheet (note 12) |
|
|
2,264 |
|
| Foreign exchange |
|
|
(3,044) |
|
| |
|
| Balance-December 31, 2015 |
|
$ |
19,460 |
|
| |
|
Site Restoration: Elliot Lake
The Elliot Lake uranium mine was closed in 1992 and capital works to decommission this site were completed in 1997. The remaining
provision is for the estimated cost of monitoring the Tailings Management Areas at the Company and Stanrock sites and for treatment of water discharged from these areas. The Company conducts its activities at both sites pursuant to licenses issued
by the Canadian Nuclear Safety Commission. The above accrual represents the Company’s best estimate of the present value of the total future reclamation cost based on assumptions as to levels of treatment, which will be required in the future,
discounted at 4.43% (2014: 5.22%). As at December 31, 2015, the undiscounted amount of estimated future reclamation costs is $21,657,000 (CAD$29,975,000) (December 31, 2014: $24,818,000 (CAD$28,791,000)). Revisions to the reclamation
liability for Elliot Lake are recognized in the income statement as there is no net reclamation asset associated with this site.
Spending on restoration activities at the Elliot Lake site is funded from monies in the Elliot Lake Reclamation Trust fund (see
note 11).
Site Restoration: McClean Lake Joint Venture and Midwest Joint Venture
The McClean Lake and Midwest operations are subject to environmental regulations as set out by the Saskatchewan government and the
Canadian Nuclear Safety Commission. Cost estimates of the estimated future decommissioning and reclamation activities are prepared periodically and filed with the applicable regulatory authorities for approval. The above accrual represents the
Company’s best estimate of the present value of the future reclamation cost contemplated in these cost estimates discounted at 4.43% (2014: 5.22%). As at December 31, 2015, the undiscounted amount of estimated future reclamation costs is
$15,699,000 (CAD$21,728,000) (December 31, 2014: $17,529,000 (CAD$20,335,000)). Reclamation costs are expected to be incurred between 2033 and 2056.
Under the Mineral Industry Environmental Protection Regulations (1996), the Company is required to provide its pro-rata share of
financial assurances to the Province. As at December 31, 2015, the Company has in place irrevocable standby letters of credit, from a chartered bank, in favour of Saskatchewan Environment, totalling CAD$9,698,000 which relate to a
previously filed reclamation plan. Under an updated plan submitted in November 2015 which is under review by the applicable regulatory authorities, the Company currently expects to increase its pro-rata share of financial assurances to the
Province by CAD$14,292,000 to approximately CAD$23,990,000 (see note 29).
Under the terms of a Potentially Reactive Waste Rock
Disposal Agreement (“PRWR Agreement”) between the MLJV and the CLJV, the MLJV agreed to deposit certain waste rock material from the Cigar Lake mine in its mined-out Sue C pit. In return, the CLJV has agreed to reimburse the MLJV for
additional site restoration costs that may reasonably occur as a result.
30
In 2014, triggered by the delivery of the first Cigar Lake mine ore to the McClean Lake
mill in March 2014, the CLJV made payments totalling CAD$4,332,000 to the MLJV under the terms of the PRWR Agreement. Denison has recorded its proportionate share of this total amount of $883,000 (CAD$974,700) as a component of its
“Reclamation obligations”.
The debt obligations balance consists of:
|
|
|
|
|
|
|
|
|
| |
|
| (in thousands) |
|
At December 31
2015 |
|
|
At December 31
2014 |
|
| |
|
|
|
|
| Notes payable and other financing |
|
$ |
300 |
|
|
$ |
39 |
|
| |
|
|
|
$ |
300 |
|
|
$ |
39 |
|
| |
|
|
|
|
| Debt obligations-by duration: |
|
|
|
|
|
|
|
|
| Current |
|
$ |
300 |
|
|
$ |
30 |
|
| Non-current |
|
|
- |
|
|
|
9 |
|
| |
|
|
|
$ |
300 |
|
|
$ |
39 |
|
| |
|
Letters of Credit Facility
In 2015, the Company had a facility in place with the Bank of Nova Scotia for credit of up to CAD$24,000,000 with a one year term and a
maturity date of January 31, 2016 (the “2015 facility”). Use of the 2015 facility was restricted to non-financial letters of credit in support of reclamation obligations.
The 2015 facility contained a covenant to maintain a level of tangible net worth greater than or equal to the sum of $150,000,000 and a
covenant to maintain a minimum balance of cash and equivalents of CAD$5,000,000 on deposit with the Bank of Nova Scotia (see note 2). As security for the 2015 facility, DMC has provided an unlimited full recourse guarantee and a pledge of all
of the shares of DMI. DMI has provided a first-priority security interest in all present and future personal property and an assignment of its rights and interests under all material agreements relative to the McClean Lake and Midwest
projects. The 2015 facility is subject to letter of credit and standby fees of 2.40% and 0.75% respectively.
At
December 31, 2015, the Company had no outstanding borrowings under the 2015 facility (December 31, 2014 - $nil). At December 31, 2015, the Company was in compliance with its 2015 facility covenants and CAD$9,698,000 of the 2015
facility was being utilized as collateral for certain letters of credit (December 31, 2014 - CAD$9,698,000). During 2015 and 2014, the Company incurred letter of credit and standby fees of $260,000 and $221,000, respectively.
On January 30, 2016, the Company entered into an amended agreement (the “2016 facility”) with the Bank of Nova Scotia to
amend the terms of the 2015 facility and extend the maturity date to January 31, 2017 (see note 29).
Scheduled Debt
Obligation Maturities
The table below represents scheduled maturities of the Company’s debt obligations over the next year
after which its debt obligations will be paid in full:
|
|
|
|
|
| |
|
| (in thousands) |
|
|
|
| |
|
|
|
| 2016 |
|
$ |
300 |
|
| |
|
|
|
$ |
300 |
|
| |
|
31
The other liabilities balance consists of:
|
|
|
|
|
|
|
|
|
| |
|
| (in thousands) |
|
At December 31
2015 |
|
|
At December 31
2014 |
|
| |
|
|
|
|
| Unamortized fair value of toll milling contracts |
|
$ |
694 |
|
|
$ |
861 |
|
| Flow-through share premium obligation |
|
|
1,821 |
|
|
|
1,915 |
|
| |
|
|
|
$ |
2,515 |
|
|
$ |
2,776 |
|
| |
|
|
|
|
| Other long-term liabilities-by duration: |
|
|
|
|
|
|
|
|
| Current |
|
$ |
1,863 |
|
|
$ |
1,935 |
|
| Non-current |
|
|
652 |
|
|
|
841 |
|
| |
|
|
|
$ |
2,515 |
|
|
$ |
2,776 |
|
| |
|
Unamortized fair values of toll milling contracts are amortized to revenue on a pro-rata basis over
the estimated volume of the applicable contract.
The
income tax recovery balance from continuing operations consists of:
|
|
|
|
|
|
|
|
|
| |
|
| (in thousands) |
|
2015 |
|
|
2014 |
|
| |
|
|
|
|
| Current income tax: |
|
|
|
|
|
|
|
|
| Based on taxable income for the period |
|
$ |
- |
|
|
$ |
- |
|
| Prior period under provision |
|
|
- |
|
|
|
(5) |
|
| |
|
|
|
|
- |
|
|
|
(5) |
|
| |
|
| Deferred income tax: |
|
|
|
|
|
|
|
|
| Origination (reversal) of temporary differences |
|
|
835 |
|
|
|
(972) |
|
| Tax benefit-previously unrecognized tax assets |
|
|
2,977 |
|
|
|
3,588 |
|
| Change in tax rates / legislation |
|
|
- |
|
|
|
- |
|
| Prior year under provision |
|
|
(43) |
|
|
|
(312) |
|
| |
|
|
|
|
3,769 |
|
|
|
2,304 |
|
| |
|
| Income tax recovery |
|
$ |
3,769 |
|
|
$ |
2,299 |
|
| |
|
32
The Company operates in multiple industries and jurisdictions, and the related income is
subject to varying rates of taxation. The combined Canadian tax rate reflects the federal and provincial tax rates in effect in Ontario, Canada for each applicable year. A reconciliation of the combined Canadian tax rate to the Company’s
effective rate of income tax is as follows:
|
|
|
|
|
|
|
|
|
| |
|
| (in thousands) |
|
2015 |
|
|
2014 |
|
| |
|
|
|
|
| Loss before taxes from continuing operations |
|
$ |
(65,506) |
|
|
$ |
(30,565) |
|
| Combined Canadian tax rate |
|
|
26.50% |
|
|
|
26.50% |
|
| |
|
| Income tax recovery at combined rate |
|
|
17,359 |
|
|
|
8,100 |
|
|
|
|
| Difference in foreign tax rates |
|
|
3,681 |
|
|
|
(282) |
|
| Non-deductible amounts (2) |
|
|
(15,093) |
|
|
|
(3,055) |
|
| Non-taxable amounts |
|
|
5,517 |
|
|
|
1,968 |
|
| Previously unrecognized deferred tax assets (1) |
|
|
2,977 |
|
|
|
3,588 |
|
| Renunciation of tax attributes-flow through shares |
|
|
(1,025) |
|
|
|
(1,071) |
|
| Change in deferred tax assets not recognized |
|
|
(10,143) |
|
|
|
(957) |
|
| Prior year under provision |
|
|
(43) |
|
|
|
(317) |
|
| Other |
|
|
539 |
|
|
|
(5,675) |
|
| |
|
| Income tax recovery |
|
$ |
3,769 |
|
|
$ |
2,299 |
|
| |
|
| |
(1) |
The Company has recognized certain previously unrecognized Canadian tax assets in 2015 and 2014 as a result of the renunciation of certain tax benefits to
subscribers pursuant to its August 2014 CAD$14,997,000 and May 2013 CAD$14,950,000 flow-through share offerings. |
| |
(2) |
The increase in 2015 is primarily due to foreign exchange losses on intercompany loans with Zambia. |
The deferred income tax assets (liabilities) balance reported on the balance sheet is comprised of the temporary differences as presented
below:
|
|
|
|
|
|
|
|
|
| |
|
| (in thousands) |
|
At December 31
2015 |
|
|
At December 31
2014 |
|
| |
|
|
|
|
| Deferred income tax assets: |
|
|
|
|
|
|
|
|
| Property, plant and equipment, net |
|
$ |
247 |
|
|
$ |
1,865 |
|
| Post-employment benefits |
|
|
624 |
|
|
|
767 |
|
| Reclamation and remediation obligations |
|
|
5,657 |
|
|
|
5,102 |
|
| Other long-term liabilities |
|
|
182 |
|
|
|
226 |
|
| Tax loss carry forwards |
|
|
8,231 |
|
|
|
8,875 |
|
| Other |
|
|
4,308 |
|
|
|
5,295 |
|
| |
|
| Deferred income tax assets-gross |
|
|
19,249 |
|
|
|
22,130 |
|
| Set-off against deferred income tax liabilities |
|
|
(19,249) |
|
|
|
(22,130) |
|
| |
|
| Deferred income tax assets-per balance sheet |
|
$ |
- |
|
|
$ |
- |
|
| |
|
|
|
|
| Deferred income tax liabilities: |
|
|
|
|
|
|
|
|
| Inventory |
|
$ |
(515) |
|
|
$ |
(620) |
|
| Property, plant and equipment, net |
|
|
(34,391) |
|
|
|
(40,591) |
|
| Intangibles |
|
|
(28) |
|
|
|
(167) |
|
| Other |
|
|
(780) |
|
|
|
(2,578) |
|
| |
|
| Deferred income tax liabilities-gross |
|
|
(35,714) |
|
|
|
(43,956) |
|
| Set-off of deferred income tax assets |
|
|
19,249 |
|
|
|
22,130 |
|
| |
|
| Deferred income tax liabilities-per balance sheet |
|
$ |
(16,465) |
|
|
$ |
(21,826) |
|
| |
|
33
The deferred income tax liability continuity summary is as follows:
|
|
|
|
|
| |
|
| (in thousands) |
|
|
|
| |
|
|
|
| Balance-January 1, 2014 |
|
$ |
(25,847) |
|
| Recognized in income (loss) |
|
|
2,304 |
|
| Recognized in other liabilities (flow-through shares) |
|
|
(313) |
|
| Other, including foreign exchange gain (loss) |
|
|
2,030 |
|
| |
|
| Balance-December 31, 2014 |
|
$ |
(21,826) |
|
| |
|
|
|
| Recognized in income (loss) |
|
|
3,769 |
|
| Recognized in other liabilities (flow-through shares) |
|
|
(1,790) |
|
| Other, including foreign exchange gain (loss) |
|
|
3,382 |
|
| |
|
| Balance-December 31, 2015 |
|
$ |
(16,465) |
|
| |
|
Management believes that it is not probable that sufficient taxable profit will be available in
future years to allow the benefit of the following deferred tax assets to be utilized:
|
|
|
|
|
|
|
|
|
| |
|
| (in thousands) |
|
At December 31
2015 |
|
|
At December 31
2014 |
|
| |
|
|
|
|
| Deferred income tax assets not recognized |
|
|
|
|
|
|
|
|
| Investments |
|
$ |
94 |
|
|
$ |
64 |
|
| Property, plant and equipment |
|
|
23,108 |
|
|
|
18,317 |
|
| Tax losses – capital |
|
|
22,548 |
|
|
|
26,895 |
|
| Tax losses – operating |
|
|
22,850 |
|
|
|
22,650 |
|
| Tax credits |
|
|
891 |
|
|
|
983 |
|
| Other deductible temporary differences |
|
|
418 |
|
|
|
2,922 |
|
| |
|
| Deferred income tax assets not recognized |
|
$ |
69,909 |
|
|
$ |
71,831 |
|
| |
|
A geographic split of the Company’s tax losses and tax credits not recognized and the
associated expiry dates of those losses and credits is as follows:
|
|
|
|
|
|
|
|
|
|
|
|
|
| |
|
| (in thousands) |
|
Expiry Date |
|
|
|
At December 31
2015 |
|
|
At December 31
2014 |
|
| |
|
|
|
|
|
|
| Tax losses - gross |
|
|
|
|
|
|
|
|
|
|
|
|
| Canada |
|
2025-2035 |
|
|
|
$ |
109,970 |
|
|
$ |
115,088 |
|
| Mongolia |
|
|
|
|
|
|
- |
|
|
|
4,296 |
|
| Zambia (1) |
|
2020-2025 |
|
|
|
|
6,575 |
|
|
|
- |
|
| Other |
|
Unlimited |
|
|
|
|
13 |
|
|
|
12 |
|
| |
|
| Tax losses - gross |
|
|
|
|
|
|
116,558 |
|
|
|
119,396 |
|
| Tax benefit at tax rate of 25% - 37.5% |
|
|
|
|
|
|
31,081 |
|
|
|
31,525 |
|
| Set-off against deferred tax liabilities |
|
|
|
|
|
|
(8,231) |
|
|
|
(8,875) |
|
| |
|
| Total tax loss assets not recognized |
|
|
|
|
|
$ |
22,850 |
|
|
$ |
22,650 |
|
| |
|
|
|
|
|
|
| Tax credits |
|
|
|
|
|
|
|
|
|
|
|
|
| Canada |
|
2025-2035 |
|
|
|
|
891 |
|
|
|
983 |
|
| |
|
| Total tax credit assets not recognized |
|
|
|
|
|
$ |
891 |
|
|
$ |
983 |
|
| |
|
| |
(1) |
In December 2014, the Zambian government passed into law amendments to the Income Tax and Mine and Minerals Development Act which had the effect of
eliminating corporate tax on profits from certain mining activities effective January 1, 2015. For the Company, the amendments reduced the corporate tax rate to 0% but increased the mineral royalty rate from 6% for all mining methods to 8%
for underground mining and 20% for open pit mining. As a result of these amendments, the Company was no longer subject to income tax in Zambia and any tax attributes accumulated prior to December 31, 2014 were effectively expired or have
been reduced to nil. |
In August 2015, the Zambian government enacted changes to the country’s mining tax
regime that were effective July 1, 2015. The changes resulted in the reinstatement of a corporate tax on mining profits of 30% with an additional variable profits tax of up to 15%, and a decrease in mineral royalty rates to 6% for underground
mining and 9% for open pit mining. As a result of these changes, the Company has disclosed its tax attributes available for carry-forward as at December 31, 2015.
34
Denison is authorized to issue an unlimited number of common shares without par value. A continuity summary of the issued and
outstanding common shares and the associated dollar amounts is presented below:
|
|
|
|
|
|
|
|
|
| |
|
| (in thousands except share amounts) |
|
Number of
Common
Shares |
|
|
|
|
| |
|
|
|
|
| Balance-January 1, 2014 |
|
|
482,003,444 |
|
|
$ |
1,092,144 |
|
| |
|
| Issued for cash: |
|
|
|
|
|
|
|
|
| New issue gross proceeds |
|
|
9,257,500 |
|
|
|
13,704 |
|
| New issue gross issue costs |
|
|
- |
|
|
|
(859) |
|
| Share options exercised |
|
|
1,025,449 |
|
|
|
946 |
|
| Share purchase warrants exercised |
|
|
536,050 |
|
|
|
405 |
|
| Acquisition of Rockgate (note 6) |
|
|
2,312,622 |
|
|
|
3,034 |
|
| Acquisition of IEC (note 6) |
|
|
10,229,035 |
|
|
|
11,979 |
|
| Settlement of liabilities associated with IEC Arrangement |
|
|
504,794 |
|
|
|
610 |
|
| Share options exercised-fair value adjustment |
|
|
- |
|
|
|
525 |
|
| Share purchase warrants exercised-fair value adjustment |
|
|
- |
|
|
|
300 |
|
| Flow-through share premium liability |
|
|
- |
|
|
|
(2,030) |
|
| |
|
|
|
|
23,865,450 |
|
|
|
28,614 |
|
| |
|
| Balance-December 31, 2014 |
|
|
505,868,894 |
|
|
$ |
1,120,758 |
|
| |
|
|
|
|
| Issued for cash: |
|
|
|
|
|
|
|
|
| New issue gross proceeds |
|
|
12,000,000 |
|
|
|
12,069 |
|
| New issue gross issue costs |
|
|
- |
|
|
|
(751) |
|
| Share options exercised |
|
|
7,100 |
|
|
|
5 |
|
| Share purchase warrants exercised |
|
|
562,675 |
|
|
|
406 |
|
| Share options exercised-fair value adjustment |
|
|
- |
|
|
|
4 |
|
| Share purchase warrants exercised-fair value adjustment |
|
|
- |
|
|
|
316 |
|
| Flow-through share premium liability |
|
|
- |
|
|
|
(2,028) |
|
| |
|
|
|
|
12,569,775 |
|
|
|
10,021 |
|
| |
|
| Balance-December 31, 2015 |
|
|
518,438,669 |
|
|
$ |
1,130,779 |
|
| |
|
New Issues
In August 2014, the Company completed a private placement of 9,257,500 flow-through common shares at a price of CAD$1.62 per share
for gross proceeds of $13,704,000 (CAD$14,997,000). The income tax benefits of this issue were renounced to subscribers with an effective date of December 31, 2014. The related flow-through share premium liability is included as a
component of other liabilities on the balance sheet at December 31, 2014 and was extinguished during 2015 (note 17).
In
May 2015, the Company completed a private placement of 12,000,000 flow-through common shares at a price of CAD$1.25 per share for gross proceeds of $12,069,000 (CAD$15,000,000). The income tax benefits of this issue will be renounced to
subscribers with an effective date no later than December 31, 2015. The related flow-through share premium liability is included as a component of other liabilities on the balance sheet at December 31, 2015 and will be extinguished
during 2016 (note 17).
Acquisition Related Issues
In January 2014, the Company issued 2,312,622 shares at a value of $3,034,000 (CAD$3,330,000) to acquire the remaining
non-controlling interest in Rockgate (see note 6).
In June 2014, the Company issued 10,229,035 shares at a value of $11,979,000
(CAD$13,093,000) as part of the acquisition of IEC (see note 6).
In June 2014, the Company issued 504,794 shares at a value of
$610,000 (CAD$661,000) as settlement for various advisory fee and change of control liabilities associated with the IEC Arrangement.
35
Flow-Through Share Issues
As at December 31, 2015, the Company estimates that it has satisfied its obligation to spend CAD$14,997,000 on eligible exploration
expenditures as a result of the issuance of flow-through shares in August 2014. The Company renounced the income tax benefits of this issue in February 2015, with an effective date of renunciation to its subscribers of
December 31, 2014. In conjunction with the renunciation, the flow-through share premium liability has been reversed and recognized as part of the deferred tax recovery (see notes 18).
As at December 31, 2015, the Company estimates that it has incurred CAD$1,567,000 of its obligation to spend CAD$15,000,000 on
eligible exploration expenditures as a result of the issuance of flow-through shares in May 2015. The Company renounced the income tax benefits of this issue in February 2016, with an effective date of renunciation to its subscribers
of December 31, 2015.
| 20. |
SHARE PURCHASE WARRANTS |
A continuity summary of the issued and outstanding share purchase warrants in terms of common shares of the Company and the associated
dollar amounts is presented below:
|
|
|
|
|
|
|
|
|
|
|
|
|
|
|
| |
|
| (in thousands except share amounts) |
|
Weighted
Average Exercise
Price Per
Share (CAD$) |
|
|
|
|
Number of
Common
Shares
Issuable |
|
|
Fair
Value
Amount |
|
| |
|
|
|
|
|
|
| Balance-January 1, 2014 |
|
$ |
0.84 |
|
|
|
|
|
1,098,725 |
|
|
$ |
616 |
|
| |
|
|
|
|
|
|
| Warrants issued on acquisition of IEC (note 6) |
|
|
1.71 |
|
|
|
|
|
660,127 |
|
|
|
61 |
|
| Warrants exercised |
|
|
0.84 |
|
|
|
|
|
(536,050) |
|
|
|
(300) |
|
| Warrants expired |
|
|
2.31 |
|
|
|
|
|
(143,000) |
|
|
|
(1) |
|
| |
|
| Balance-December 31, 2014 |
|
$ |
1.17 |
|
|
|
|
|
1,079,802 |
|
|
$ |
376 |
|
| |
|
|
|
|
|
|
| Warrants exercised |
|
|
0.84 |
|
|
|
|
|
(562,675) |
|
|
|
(316) |
|
| Warrants expired |
|
|
1.54 |
|
|
|
|
|
(517,127) |
|
|
|
(60) |
|
| |
|
| Balance-December 31, 2015 |
|
$ |
- |
|
|
|
|
|
- |
|
|
$ |
- |
|
| |
|
The Company’s stock-based compensation plan (the “Plan”) provides for the granting of stock options up to 10% of the
issued and outstanding common shares at the time of grant, subject to a maximum of 39,670,000 common shares. As at December 31, 2015, an aggregate of 13,390,925 options have been granted (less cancellations) since the Plan’s inception in
1997.
Under the Plan, all stock options are granted at the discretion of the Company’s board of directors, including any
vesting provisions if applicable. The term of any stock option granted may not exceed ten years and the exercise price may not be lower than the closing price of the Company’s shares on the last trading day immediately preceding the date of
grant. In general, stock options granted under the Plan have five year terms and vesting periods up to thirty months.
36
A continuity summary of the stock options of the Company granted under the Plan for 2015
is presented below:
|
|
|
|
|
|
|
|
|
| |
|
Number of
Common
Shares |
|
|
Weighted-
Average
Exercise
Price
per
Share (CAD$) |
|
|
|
|
| Stock options outstanding - beginning of period |
|
|
6,179,574 |
|
|
$ |
1.80 |
|
| Granted |
|
|
2,185,000 |
|
|
|
0.96 |
|
| Exercised (1) |
|
|
(7,100) |
|
|
|
0.71 |
|
| Forfeitures |
|
|
(377,480) |
|
|
|
1.81 |
|
| Expiries |
|
|
(905,535) |
|
|
|
1.64 |
|
| Stock options outstanding - end of period |
|
|
7,074,459 |
|
|
$ |
1.56 |
|
| Stock options exercisable - end of period |
|
|
4,386,459 |
|
|
$ |
1.82 |
|
| |
(1) |
The weighted average share price at the date of exercise was CAD$1.07. |
A summary of the Company’s stock options outstanding at December 31, 2015 is presented below:
|
|
|
|
|
|
|
|
|
|
|
| Range of Exercise
Prices per Share (CAD$) |
|
Weighted
Average
Remaining
Contractual
Life
(Years) |
|
Number of
Common
Shares |
|
|
Weighted-
Average
Exercise
Price
per
Share (CAD$) |
|
|
|
|
|
| Stock options outstanding |
|
|
|
|
|
|
|
|
|
|
| $ 0.50 to $ 0.99 |
|
3.47 |
|
|
1,050,100 |
|
|
$ |
0.63 |
|
| $ 1.00 to $ 1.19 |
|
3.79 |
|
|
1,843,524 |
|
|
|
1.09 |
|
| $ 1.20 to $ 1.39 |
|
1.92 |
|
|
1,306,750 |
|
|
|
1.31 |
|
| $ 1.40 to $ 1.99 |
|
2.28 |
|
|
2,001,725 |
|
|
|
1.71 |
|
| $ 2.00 to $ 5.03 |
|
0.25 |
|
|
872,360 |
|
|
|
3.71 |
|
| Stock options outstanding - end of period |
|
2.53 |
|
|
7,074,459 |
|
|
$ |
1.56 |
|
Options outstanding at December 31, 2015 expire between January 2016 and
November 2020.
The fair value of each option granted is estimated on the date of grant using the Black-Scholes option pricing
model. The following table outlines the range of assumptions used in the model to determine the fair value of options granted (excluding those granted pursuant to the IEC acquisition – refer to note 6):
|
|
|
|
|
|
|
|
|
| |
|
2015 |
|
|
2014 |
|
|
|
|
| Risk-free interest rate |
|
|
0.56% - 0.88% |
|
|
|
1.42% - 1.47% |
|
| Expected stock price volatility |
|
|
43.23% - 47.00% |
|
|
|
55.21% - 55.56% |
|
| Expected life |
|
|
3.6 years |
|
|
|
3.7 years |
|
| Estimated forfeiture rate |
|
|
3.34% - 3.40% |
|
|
|
3.50% - 3.70% |
|
| Expected dividend yield |
|
|
– |
|
|
|
– |
|
| Fair value per share under options granted |
|
|
CAD$0.18 - CAD$0.39 |
|
|
|
CAD$0.54 - CAD$0.74 |
|
The fair values of stock options with vesting provisions are amortized on a graded method basis as
stock-based compensation expense over the applicable vesting periods. Included in the statement of income (loss) is stock-based compensation of $588,000 for 2015 and $800,000 for 2014. At December 31, 2015, the Company had an
additional $267,000 in stock-based compensation expense to be recognized periodically to November 2017.
37
| 22. |
ACCUMULATED OTHER COMPREHENSIVE INCOME |
The accumulated other comprehensive income balance consists of:
|
|
|
|
|
| |
| (in thousands) |
|
At December 31
2015 |
|
At December 31
2014 |
| |
|
|
|
| Cumulative foreign currency translation |
|
$ (73,746) |
|
$ (26,017) |
| Unamortized experience gain – post employment liability |
|
|
|
|
| Gross |
|
206 |
|
206 |
| Tax effect |
|
(56) |
|
(56) |
| Unrealized gains on investments |
|
|
|
|
| Gross |
|
4 |
|
8 |
| |
|
|
$ (73,592) |
|
$ (25,859) |
| |
| 23. |
SUPPLEMENTAL FINANCIAL INFORMATION |
The components of operating expenses for continuing operations are as follows:
|
|
|
|
|
|
|
|
|
| |
|
|
|
Year Ended |
| (in thousands) |
|
|
|
December 31
2015 |
|
|
|
December 31
2014 |
|
|
|
|
|
| Cost of goods and services sold: |
|
|
|
|
|
|
|
|
| Cost of goods sold-mineral concentrates |
|
$ |
|
(35) |
|
$ |
|
- |
| Operating Overheads: |
|
|
|
|
|
|
|
|
| Mining, other development expense |
|
|
|
(1,075) |
|
|
|
(2,482) |
| Milling, conversion expense |
|
|
|
(1,655) |
|
|
|
(466) |
| Mill feed cost: |
|
|
|
|
|
|
|
|
| -Stockpile depletion |
|
|
|
(24) |
|
|
|
(61) |
| Less absorption: |
|
|
|
|
|
|
|
|
| -Stockpiles, mineral properties |
|
|
|
410 |
|
|
|
631 |
| -Concentrates |
|
|
|
54 |
|
|
|
440 |
| Cost of services |
|
|
|
(7,551) |
|
|
|
(7,612) |
| Inventory-non cash adjustments |
|
|
|
(168) |
|
|
|
- |
| Cost of goods and services sold |
|
|
|
(10,044) |
|
|
|
(9,550) |
| Reclamation asset amortization |
|
|
|
(82) |
|
|
|
(15) |
| Reclamation liability adjustments (note 15) |
|
|
|
(2,262) |
|
|
|
(2,086) |
| Selling expenses |
|
|
|
(14) |
|
|
|
- |
| Sales royalties and non-income taxes |
|
|
|
(6) |
|
|
|
- |
| Operating expenses |
|
$ |
|
(12,408) |
|
$ |
|
(11,651) |
The components of other income (expense) for continuing operations are as follows:
|
|
|
|
|
|
|
|
|
| |
|
|
|
Year Ended |
| (in thousands) |
|
|
|
December 31
2015 |
|
|
|
December 31
2014 |
|
|
|
|
|
| Gains (losses) on: |
|
|
|
|
|
|
|
|
| Disposal of property, plant and equipment |
|
$ |
|
65 |
|
$ |
|
449 |
| Investment impairments |
|
|
|
- |
|
|
|
(22) |
| Investment disposals / fair value through profit (loss) |
|
|
|
(346) |
|
|
|
(59) |
| Other |
|
|
|
(244) |
|
|
|
57 |
| Other income (expense) |
|
$ |
|
(525) |
|
$ |
|
425 |
38
The components of finance income (expense) for continuing operations are as follows:
|
|
|
|
|
|
|
|
|
|
|
|
|
|
|
|
|
| |
|
|
|
|
Year Ended |
|
| (in thousands) |
|
|
|
|
December 31
2015 |
|
|
|
|
|
December 31
2014 |
|
|
|
|
|
|
| Interest income |
|
$ |
|
|
|
|
219 |
|
|
$ |
|
|
|
|
553 |
|
| Interest expense |
|
|
|
|
|
|
(2) |
|
|
|
|
|
|
|
(2) |
|
| Accretion expense-reclamation obligations |
|
|
|
|
|
|
(836) |
|
|
|
|
|
|
|
(720) |
|
| Accretion expense-post-employment benefits |
|
|
|
|
|
|
(95) |
|
|
|
|
|
|
|
(114) |
|
| Finance expense |
|
$ |
|
|
|
|
(714) |
|
|
$ |
|
|
|
|
(283) |
|
A summary of depreciation expense recognized in the statement of income (loss) is as follows:
|
|
|
|
|
|
|
|
|
|
|
|
|
|
|
|
|
| |
|
|
|
|
Year Ended |
|
| (in thousands) |
|
|
|
|
December 31
2015 |
|
|
|
|
|
December 31
2014 |
|
|
|
|
|
|
| Continuing operations: |
|
|
|
|
|
|
|
|
|
|
|
|
|
|
|
|
| Operating expenses: |
|
|
|
|
|
|
|
|
|
|
|
|
|
|
|
|
| Mining, other development expense |
|
$ |
|
|
|
|
(192) |
|
|
$ |
|
|
|
|
(303) |
|
| Milling, conversion expense |
|
|
|
|
|
|
(1,627) |
|
|
|
|
|
|
|
(79) |
|
| Cost of services |
|
|
|
|
|
|
(254) |
|
|
|
|
|
|
|
(244) |
|
| Mineral property exploration |
|
|
|
|
|
|
(94) |
|
|
|
|
|
|
|
(125) |
|
| General and administrative |
|
|
|
|
|
|
(36) |
|
|
|
|
|
|
|
(51) |
|
| Discontinued operations |
|
|
|
|
|
|
(13) |
|
|
|
|
|
|
|
(15) |
|
| Depreciation expense-gross |
|
$ |
|
|
|
|
(2,216) |
|
|
$ |
|
|
|
|
(817) |
|
A summary of employee benefits expense recognized in the statement of income (loss) is as follows:
|
|
|
|
|
|
|
|
|
|
|
|
|
|
|
|
|
| |
|
|
|
|
Year Ended |
|
| (in thousands) |
|
|
|
|
December 31
2015 |
|
|
|
|
|
December 31
2014 |
|
|
|
|
|
|
| Continuing operations: |
|
|
|
|
|
|
|
|
|
|
|
|
|
|
|
|
| Salaries and short-term employee benefits |
|
$ |
|
|
|
|
(6,997) |
|
|
$ |
|
|
|
|
(7,909) |
|
| Share-based compensation |
|
|
|
|
|
|
(588) |
|
|
|
|
|
|
|
(783) |
|
| Termination benefits |
|
|
|
|
|
|
(327) |
|
|
|
|
|
|
|
(202) |
|
| Discontinued operations |
|
|
|
|
|
|
(375) |
|
|
|
|
|
|
|
(555) |
|
| Employee benefits expense-gross |
|
$ |
|
|
|
|
(8,287) |
|
|
$ |
|
|
|
|
(9,449) |
|
The change in non-cash working capital items in the consolidated statements of cash flows is as
follows:
|
|
|
|
|
|
|
|
|
|
|
|
|
|
|
|
|
| |
|
|
|
|
Year Ended |
|
| (in thousands) |
|
|
|
|
December 31
2015 |
|
|
|
|
|
December 31
2014 |
|
|
|
|
|
|
| Change in non-cash working capital items: |
|
|
|
|
|
|
|
|
|
|
|
|
|
|
|
|
| Trade and other receivables |
|
$ |
|
|
|
|
3,240 |
|
|
$ |
|
|
|
|
(5,310) |
|
| Inventories |
|
|
|
|
|
|
(622) |
|
|
|
|
|
|
|
(520) |
|
| Prepaid expenses and other assets |
|
|
|
|
|
|
119 |
|
|
|
|
|
|
|
(152) |
|
| Accounts payable and accrued liabilities |
|
|
|
|
|
|
(3,932) |
|
|
|
|
|
|
|
2,102 |
|
| Post-employment benefits |
|
|
|
|
|
|
(160) |
|
|
|
|
|
|
|
(244) |
|
| Reclamation obligations |
|
|
|
|
|
|
(517) |
|
|
|
|
|
|
|
290 |
|
| Change in non-cash working capital items |
|
$ |
|
|
|
|
(1,872) |
|
|
$ |
|
|
|
|
(3,834) |
|
39
| 24. |
SEGMENTED INFORMATION |
Business Segments
The Company operates in three primary segments – the Mining segment, the Environmental Services segment and the Corporate and Other
segment. The Mining segment, which has been further subdivided into geographic regions, being Canada and Africa, includes activities related to exploration, evaluation and development, mining, milling (including toll milling) and the sale of mineral
concentrates. The Environmental Services segment includes the results of the Company’s environmental services business, DES. The Corporate and Other segment includes management fees and commission income earned from UPC and general corporate
expenses not allocated to the other segments. Management fees and commission income have been included with general corporate expenses due to the shared infrastructure between the two activities.
Business segment results for 2014 have been presented using the segmentation reported in 2015.
For the year ended December 31, 2015, reportable segment results for continuing operations were as follows:
|
|
|
|
|
|
|
|
|
|
|
|
|
|
|
|
|
|
|
|
|
| (in thousands) |
|
Canada
Mining |
|
|
Africa
Mining |
|
|
DES |
|
|
Corporate
and
Other |
|
|
Total |
|
|
|
|
|
|
|
| Statement of Operations: |
|
|
|
|
|
|
|
|
|
|
|
|
|
|
|
|
|
|
|
|
| Revenues |
|
|
3,241 |
|
|
|
- |
|
|
|
7,607 |
|
|
|
1,822 |
|
|
|
12,670 |
|
|
|
|
|
|
|
| Expenses: |
|
|
|
|
|
|
|
|
|
|
|
|
|
|
|
|
|
|
|
|
| Operating expenses |
|
|
(4,554) |
|
|
|
(303) |
|
|
|
(6,875) |
|
|
|
(676) |
|
|
|
(12,408) |
|
| Mineral property exploration |
|
|
(13,439) |
|
|
|
(818) |
|
|
|
- |
|
|
|
- |
|
|
|
(14,257) |
|
| General and administrative |
|
|
(17) |
|
|
|
(604) |
|
|
|
- |
|
|
|
(5,842) |
|
|
|
(6,463) |
|
| Impairment-mineral properties (note 12) |
|
|
(2,603) |
|
|
|
(25,164) |
|
|
|
- |
|
|
|
- |
|
|
|
(27,767) |
|
| |
|
|
(20,613) |
|
|
|
(26,889) |
|
|
|
(6,875) |
|
|
|
(6,518) |
|
|
|
(60,895) |
|
| Segment income (loss) |
|
|
(17,372) |
|
|
|
(26,889) |
|
|
|
732 |
|
|
|
(4,696) |
|
|
|
(48,225) |
|
|
|
|
|
|
|
| Revenues – supplemental: |
|
|
|
|
|
|
|
|
|
|
|
|
|
|
|
|
|
|
|
|
| Uranium concentrates |
|
|
86 |
|
|
|
- |
|
|
|
- |
|
|
|
- |
|
|
|
86 |
|
| Environmental services |
|
|
- |
|
|
|
- |
|
|
|
7,607 |
|
|
|
- |
|
|
|
7.607 |
|
| Management fees and commissions |
|
|
- |
|
|
|
- |
|
|
|
- |
|
|
|
1,822 |
|
|
|
1,822 |
|
| Toll milling services |
|
|
3,155 |
|
|
|
- |
|
|
|
- |
|
|
|
- |
|
|
|
3,155 |
|
| |
|
|
3,241 |
|
|
|
- |
|
|
|
7,607 |
|
|
|
1,822 |
|
|
|
12,670 |
|
|
|
|
|
|
|
| Capital additions: (1) |
|
|
|
|
|
|
|
|
|
|
|
|
|
|
|
|
|
|
|
|
| Property, plant and equipment |
|
|
1,028 |
|
|
|
357 |
|
|
|
318 |
|
|
|
147 |
|
|
|
1,850 |
|
|
|
|
|
|
|
| Long-lived assets: |
|
|
|
|
|
|
|
|
|
|
|
|
|
|
|
|
|
|
|
|
| Plant and equipment |
|
|
|
|
|
|
|
|
|
|
|
|
|
|
|
|
|
|
|
|
| Cost |
|
|
72,386 |
|
|
|
1,498 |
|
|
|
3,162 |
|
|
|
212 |
|
|
|
77,258 |
|
| Accumulated depreciation |
|
|
(8,711) |
|
|
|
(1,217) |
|
|
|
(1,675) |
|
|
|
(37) |
|
|
|
(11,640) |
|
| Mineral properties |
|
|
119,368 |
|
|
|
3,264 |
|
|
|
- |
|
|
|
- |
|
|
|
122,632 |
|
| Intangibles |
|
|
- |
|
|
|
- |
|
|
|
- |
|
|
|
107 |
|
|
|
107 |
|
| |
|
|
183,043 |
|
|
|
3,545 |
|
|
|
1,487 |
|
|
|
282 |
|
|
|
188,357 |
|
| |
(1) |
In November 2015, the Company divested its Mongolia Mining Division (see note 6) which was the only operation within the previously reported Asia Mining
Segment. The capital additions amount reported above excludes $190,000 of capital additions attributable to the former Asia mining segment. |
40
For the year ended December 31, 2014, reportable segment results for continuing
operations were as follows:
|
|
|
|
|
|
|
|
|
|
|
|
|
|
|
|
|
|
|
|
|
| (in thousands) |
|
Canada
Mining |
|
|
Africa
Mining |
|
|
DES |
|
|
Corporate
and
Other |
|
|
Total |
|
|
|
|
|
|
|
| Statement of Operations: |
|
|
|
|
|
|
|
|
|
|
|
|
|
|
|
|
|
|
|
|
| Revenues |
|
|
111 |
|
|
|
- |
|
|
|
7,327 |
|
|
|
2,181 |
|
|
|
9,619 |
|
|
|
|
|
|
|
| Expenses: |
|
|
|
|
|
|
|
|
|
|
|
|
|
|
|
|
|
|
|
|
| Operating expenses |
|
|
(2,649) |
|
|
|
(1,390) |
|
|
|
(6,917) |
|
|
|
(695) |
|
|
|
(11,651) |
|
| Mineral property exploration |
|
|
(13,488) |
|
|
|
(913) |
|
|
|
- |
|
|
|
- |
|
|
|
(14,401) |
|
| General and administrative |
|
|
(10) |
|
|
|
(1,152) |
|
|
|
- |
|
|
|
(5,474) |
|
|
|
(6,636) |
|
| Impairment-mineral properties (note 11) |
|
|
(1,658) |
|
|
|
(87) |
|
|
|
- |
|
|
|
- |
|
|
|
(1,745) |
|
| |
|
|
(17,805) |
|
|
|
(3,542) |
|
|
|
(6,917) |
|
|
|
(6,169) |
|
|
|
(34,433) |
|
| Segment income (loss) |
|
|
(17,694) |
|
|
|
(3,542) |
|
|
|
410 |
|
|
|
(3,988) |
|
|
|
(24,814) |
|
|
|
|
|
|
|
| Revenues – supplemental: |
|
|
|
|
|
|
|
|
|
|
|
|
|
|
|
|
|
|
|
|
| Environmental services |
|
|
- |
|
|
|
- |
|
|
|
7,327 |
|
|
|
- |
|
|
|
7,327 |
|
| Management fees and commissions |
|
|
- |
|
|
|
- |
|
|
|
- |
|
|
|
2,181 |
|
|
|
2,181 |
|
| Toll milling services |
|
|
111 |
|
|
|
- |
|
|
|
- |
|
|
|
- |
|
|
|
111 |
|
| |
|
|
111 |
|
|
|
- |
|
|
|
7,327 |
|
|
|
2,181 |
|
|
|
9,619 |
|
|
|
|
|
|
|
| Capital additions: (1) |
|
|
|
|
|
|
|
|
|
|
|
|
|
|
|
|
|
|
|
|
| Property, plant and equipment |
|
|
207 |
|
|
|
557 |
|
|
|
100 |
|
|
|
- |
|
|
|
864 |
|
|
|
|
|
|
|
| Long-lived assets: |
|
|
|
|
|
|
|
|
|
|
|
|
|
|
|
|
|
|
|
|
| Plant and equipment |
|
|
|
|
|
|
|
|
|
|
|
|
|
|
|
|
|
|
|
|
| Cost |
|
|
83,613 |
|
|
|
2,288 |
|
|
|
3,452 |
|
|
|
242 |
|
|
|
89,595 |
|
| Accumulated depreciation |
|
|
(8,326) |
|
|
|
(1,738) |
|
|
|
(1,735) |
|
|
|
(170) |
|
|
|
(11,969) |
|
| Mineral properties |
|
|
144,409 |
|
|
|
41,939 |
|
|
|
- |
|
|
|
- |
|
|
|
186,348 |
|
| Intangibles |
|
|
- |
|
|
|
- |
|
|
|
- |
|
|
|
638 |
|
|
|
638 |
|
| |
|
|
219,696 |
|
|
|
42,489 |
|
|
|
1,717 |
|
|
|
710 |
|
|
|
264,612 |
|
| |
(1) |
In November 2015, the Company divested its Mongolia Mining Division (see note 6) which was the only operation within the previously reported Asia Mining
Segment. The capital additions amount reported above excludes $105,000 of capital additions attributable to the former Asia mining segment. |
Revenue Concentration
The Company’s business from continuing operations is such that, at any given time, it sells its environmental and other services to
a relatively small number of customers. During 2015, one customer from the corporate and other segment, one customer from the DES segment and one customer from the mining segment accounted for approximately 83% of total revenues consisting of 14%,
44% and 25% individually. During 2014, one customer from the corporate and other segment and two customers from the DES segment accounted for approximately 86% of total revenues consisting of 23%, 53% and 10% individually.
| 25. |
RELATED PARTY TRANSACTIONS |
Uranium Participation Corporation
The Company is a party to a management services agreement with UPC. The current agreement was entered into on April 1, 2013 and it
had a three year term that may be terminated by either party upon the provision of 120 days written notice. Under the terms of the current agreement, the Company received the following fees from UPC: a) a commission of 1.5% of the gross value of any
purchases or sales of uranium completed at the request of the Board of Directors of UPC; b) a minimum annual management fee of CAD$400,000 (plus reasonable out-of-pocket expenses) plus an additional fee of 0.3% per annum based upon UPC’s net
asset value in excess of CAD$100,000,000; and c) a fee, at the discretion of the Board of UPC, for on-going monitoring
41
or work associated with a transaction or arrangement (other than a financing, or the purchase or sale of uranium) – see note 29.
The following transactions were incurred with UPC for the periods noted:
|
|
|
|
|
|
|
|
|
| |
|
|
|
Year Ended |
| (in thousands) |
|
|
|
December 31
2015 |
|
|
|
December 31
2014 |
| |
|
|
|
|
|
| Revenue: |
|
|
|
|
|
|
|
|
| Management fees |
|
$ |
|
1,747 |
|
$ |
|
1,628 |
| Commission fees |
|
|
|
75 |
|
|
|
553 |
| |
|
$ |
|
1,822 |
|
$ |
|
2,181 |
At December 31, 2015, accounts receivable includes $157,000 (December 31, 2014: $123,000)
due from UPC with respect to the fees and transactions indicated above.
Korea Electric Power Corporation (“KEPCO”)
In June 2009, Denison completed definitive agreements with KEPCO including a long-term offtake agreement (which has been
assigned to Energy Fuels Inc. (“EFR”) as part of the U.S. Mining Division transaction completed in June 2012) and a strategic relationship agreement. Pursuant to the strategic relationship agreement, KEPCO is entitled to subscribe for
additional common shares in Denison’s future share offerings. The strategic relationship agreement also provides KEPCO with a right of first opportunity if Denison intends to sell any of its substantial assets, a right to participate in certain
purchases of substantial assets which Denison proposes to acquire and a right to nominate one director to Denison’s board so long as its share interest in Denison is above 5.0%.
As at December 31, 2015, KEPCO holds 58,284,000 shares of Denison representing a share interest of approximately 11.2%.
Denison also holds a 60% interest in Waterbury Lake Uranium Corporation (“WLUC”) and a 61.55% interest in Waterbury Lake
Uranium Limited Partnership (“WLULP”), entities whose key asset is the Waterbury Lake property. The other 40% and 38.45% interest in these entities is held by a consortium of investors (“KWULP”) of which KEPCO is the primary
holder (see note 28). When a spending program is approved by the participants, each participant is required to fund these entities based upon its respective ownership interest. Spending program approval requires 75% of the voting interest.
In January 2014, Denison agreed to allow KWULP to defer its funding obligations to WLUC and WLULP until September 30, 2015 and
not be diluted as per the dilution provisions in the relevant agreements in exchange for allowing Denison to authorize spending programs without obtaining the approval of 75% of the voting interest.
In September 2015, KWULP notified Denison that it has elected to dilute its interest in the Waterbury Lake project and that it will
not fund its deferred funding obligation to WLUC and WLULP. As a result, Denison earned an additional 1.55% interest in the Waterbury Lake project and will continue to be able to authorize funding programs up to CAD$10,000,000 without obtaining the
approval of 75% of the voting interest up to September 30, 2016. The acquisition of the additional 1.55% in Waterbury Lake has been accounted for using an effective date of September 30, 2015 and has resulted in Denison recording its
increased pro-rata share of the net assets of Waterbury Lake, the majority of which relates to an addition to mineral property assets of $836,000. Further dilution of KWULP’s interest will occur in 2016.
Other
During
2015, the Company incurred investor relations, administrative service fees and other expenses of $159,000 (2014: $60,000) with Namdo Management Services Ltd, which shares a common director with Denison. These services were incurred in the
normal course of operating a public company. At December 31, 2015, an amount of $nil (December 31, 2014: $nil) was due to this company.
During 2015, the Company incurred legal fees of $548,000 (2014: $276,000) with Cassels Brock & Blackwell, LLP, a law firm of which a
former member of Denison’s Board of Directors is a partner. These services and associated costs were mainly related to various acquisition initiatives and internal re-organization activities done
42
by the Company. At December 31, 2015, an amount of $12,000 (December 31, 2014: $1,000) is due to this legal firm.
During 2014, the Company provided executive services of $106,000 to Lundin Gold Inc., which shares common directors with Denison. No
similar services were provided during 2015. At December 31, 2015, an amount of $nil (December 31, 2014: $44,000) is due from this company.
Compensation of Key Management Personnel
Key management personnel are those persons having authority and responsibility for planning, directing and controlling the activities of
the Company, directly or indirectly. Key management personnel includes the Company’s executive officers, vice-presidents and members of its Board of Directors.
The following compensation was awarded to key management personnel:
|
|
|
|
|
|
|
|
|
| |
|
|
|
Year Ended |
| (in thousands) |
|
|
|
December 31
2015 |
|
|
|
December 31
2014 |
|
|
|
|
|
| Salaries and short-term employee benefits |
|
$ |
|
1,391 |
|
$ |
|
1,633 |
| Share-based compensation |
|
|
|
370 |
|
|
|
516 |
| Termination benefits |
|
|
|
314 |
|
|
|
158 |
| Key management personnel compensation |
|
$ |
|
2,075 |
|
$ |
|
2,307 |
| 26. |
CAPITAL MANAGEMENT AND FINANCIAL RISK |
Capital Management
The Company’s capital includes cash, cash equivalents, investments in debt instruments and debt obligations. The Company’s
primary objective with respect to its capital management is to ensure that it has sufficient capital to maintain its ongoing operations, to provide returns for shareholders and benefits for other stakeholders and to pursue growth opportunities (see
note 2).
Planning, annual budgeting and controls over major investment decisions are the primary tools used to manage the
Company’s capital. The Company’s cash is managed centrally and disbursed to the various regions via a system of cash call requests which are reviewed by the key decision makers. Under the Company’s delegation of authority guidelines,
significant debt obligations require the approval of both the CEO and the CFO before they are entered into.
The Company manages its
capital by review of the following measure:
|
|
|
|
|
|
|
|
|
| |
|
| (in thousands) |
|
At December 31
2015 |
|
|
At December 31
2014 |
|
| |
|
|
|
|
| Net cash: |
|
|
|
|
|
|
|
|
| Cash and cash equivalents |
|
$ |
5,367 |
|
|
$ |
18,640 |
|
| Investments in debt instruments (see note 10) |
|
|
7,282 |
|
|
|
4,381 |
|
| Debt obligations-current |
|
|
(300) |
|
|
|
(30) |
|
| Debt obligations-long term |
|
|
- |
|
|
|
(9) |
|
| |
|
| Net cash |
|
$ |
12,349 |
|
|
$ |
22,982 |
|
| |
|
Financial Risk
The Company examines the various financial risks to which it is exposed and assesses the impact and likelihood of those risks. These
risks may include credit risk, liquidity risk, currency risk, interest rate risk and price risk.
Credit risk is the risk of loss due to a counterparty’s inability to meet its obligations under a financial instrument that will
result in a financial loss to the Company. The Company believes that the carrying amount of its cash
43
and cash equivalents, trade and other receivables, investments in debt instruments and restricted cash and investments represents its maximum credit exposure.
The maximum exposure to credit risk at the reporting dates is as follows:
|
|
|
|
|
|
|
|
|
| (in thousands) |
|
At December 31
2015 |
|
|
At December 31
2014 |
|
|
|
|
| Cash and cash equivalents |
|
$ |
5,367 |
|
|
$ |
18,640 |
|
| Trade and other receivables |
|
|
4,826 |
|
|
|
9,411 |
|
| Investments in debt instruments |
|
|
7,282 |
|
|
|
4,381 |
|
| Restricted cash and investments |
|
|
2,040 |
|
|
|
2,068 |
|
| |
|
$ |
19,515 |
|
|
$ |
34,500 |
|
The Company limits cash and cash equivalents, investment in debt instruments and restricted cash
and investment risk by dealing with credit worthy financial institutions. The Company’s trade and other receivables balance relates to a small number of customers who are credit worthy and with whom the Company has established a relationship
through its past dealings.
Liquidity risk is the risk that the Company will encounter difficulties in meeting obligations associated with its financial liabilities
as they become due. The Company has in place a planning and budgeting process to help determine the funds required to support the Company’s normal operating requirements on an ongoing basis. The Company ensures that there is sufficient
committed capital to meet its short-term business requirements, taking into account its anticipated cash flows from operations, its holdings of cash and cash equivalents and its access to credit and capital markets, if required (see note 2).
The maturities of the Company’s financial liabilities are as follows:
|
|
|
|
|
|
|
|
|
| (in thousands) |
|
Within 1
Year |
|
|
1 to 5
Years
|
|
|
|
|
| Accounts payable and accrued liabilities |
|
$ |
4,574 |
|
|
$ |
- |
|
| Debt obligations (Note 16) |
|
|
300 |
|
|
|
- |
|
| |
|
$ |
4,874 |
|
|
$ |
- |
|
Foreign exchange risk is the risk that the fair value of future cash flows of a financial instrument will fluctuate because of changes in
foreign exchange rates. The Company operates internationally and is exposed to foreign exchange risk arising from various currency exposures as its subsidiaries incur operating and capital costs denominated in local currencies. Foreign
exchange risk also arises from assets and liabilities that are denominated in a currency that is not the functional currency for the relevant subsidiary company.
Currently, the Company does not have any foreign exchange hedge programs in place and manages its operational foreign exchange
requirements through spot purchases in the foreign exchange markets. The impact of the U.S dollar strengthening (by 10%) at December 31, 2015 against the Company’s foreign currencies, with all other variables held constant, is as
follows:
|
|
|
|
|
|
|
|
|
|
|
| (in thousands except foreign exchange rates) |
|
Dec. 31, 2015
Foreign Ex-
Change Rate |
|
|
|
Sensitivity
Foreign Ex-
Change Rate |
|
Change
in
net income
(loss) |
|
|
|
|
|
|
| Currency risk |
|
|
|
|
|
|
|
|
|
|
| Canadian dollar (“CAD”) |
|
1.3841 |
|
|
|
1.5225 |
|
$ |
13,687 |
|
| West Africa French Franc (“CFA”) |
|
600.96 |
|
|
|
661.06 |
|
|
(6,258) |
|
| Zambian kwacha (“ZMW”) |
|
11.0272 |
|
|
|
12.1299 |
|
|
(4,509) |
|
| |
|
|
|
|
|
|
|
$ |
2,920 |
|
44
Interest rate risk is the risk that the fair value or future cash flows of a financial instrument will fluctuate because of changes in
market interest rates. The Company is exposed to interest rate risk on its liabilities through its outstanding borrowings and on its assets through its investments in debt instruments. The Company monitors its exposure to interest rates
and has not entered into any derivative contracts to manage this risk.
The
Company is exposed to equity price risk as a result of holding equity investments in other exploration and mining companies. The Company does not actively trade these investments. The sensitivity analysis below has been determined based on
the exposure to equity price risk at December 31, 2015:
|
|
|
|
|
|
|
|
|
| (in thousands) |
|
Change in
net income
(loss) |
|
|
Change
in
Comprehensive
income (loss) |
|
|
|
|
| Equity price risk |
|
|
|
|
|
|
|
|
| 10% increase in equity prices |
|
$ |
48 |
|
|
$ |
49 |
|
| |
|
|
|
|
|
|
|
|
Fair Value of Financial Instruments
IFRS requires disclosures about the inputs to fair value measurements, including their classification within a hierarchy that prioritizes
the inputs to fair value measurement. The three levels of the fair value hierarchy are:
| |
● |
|
Level 1 - Unadjusted quoted prices in active markets for identical assets or liabilities; |
| |
● |
|
Level 2 - Inputs other than quoted prices that are observable for the asset or liability either directly or indirectly; and |
| |
● |
|
Level 3 - Inputs that are not based on observable market data. |
The fair value of financial instruments which trade in active markets (such as equity instruments) is based on quoted market prices at
the balance sheet date. The quoted marked price used to value financial assets held by the Company is the current closing price.
Except as otherwise disclosed, the fair values of cash and cash equivalents, trade and other receivables, accounts payable and accrued
liabilities, restricted cash and cash equivalents and debt obligations approximate their carrying values as a result of the short-term nature of the instruments, or the variable interest rate associated with the instruments, or the fixed interest
rate of the instruments being similar to market rates.
45
The following table illustrates the classification of the Company’s financial
assets within the fair value hierarchy as at December 31, 2015 and December 31, 2014:
|
|
|
|
|
|
|
|
|
|
|
|
|
|
|
| (in thousands) |
|
Financial
Instrument
Category(1) |
|
Fair
Value
Hierarchy |
|
|
December 31,
2015
Fair Value |
|
|
December 31,
2014
Fair Value |
|
|
|
|
|
|
| Financial Assets: |
|
|
|
|
|
|
|
|
|
|
|
|
|
|
| Cash and equivalents |
|
Category D |
|
|
|
|
|
$ |
5,367 |
|
|
$ |
18,640 |
|
| Trade and other receivables |
|
|
|
|
|
|
|
|
|
|
|
|
|
|
| Trade and other |
|
Category D |
|
|
|
|
|
|
4,826 |
|
|
|
9,411 |
|
| Contingent consideration |
|
Category A |
|
|
Level |
3 |
|
|
- |
|
|
|
- |
|
| Investments |
|
|
|
|
|
|
|
|
|
|
|
|
|
|
| Equity instruments |
|
Category A |
|
|
Level |
1 |
|
|
460 |
|
|
|
916 |
|
| Equity instruments |
|
Category A |
|
|
Level |
2 |
|
|
24 |
|
|
|
16 |
|
| Equity instruments |
|
Category B |
|
|
Level |
1 |
|
|
12 |
|
|
|
22 |
|
| Debt instruments |
|
Category A |
|
|
Level |
1 |
|
|
7,282 |
|
|
|
4,381 |
|
| Restricted cash and equivalents |
|
|
|
|
|
|
|
|
|
|
|
|
|
|
| Elliot Lake reclamation trust fund |
|
Category C |
|
|
|
|
|
|
2,040 |
|
|
|
2,068 |
|
| |
|
|
|
|
|
|
|
$ |
20,011 |
|
|
$ |
35,454 |
|
|
|
|
|
|
| Financial Liabilities: |
|
|
|
|
|
|
|
|
|
|
|
|
|
|
| Account payable and accrued liabilities |
|
Category E |
|
|
|
|
|
|
4,574 |
|
|
|
10,050 |
|
| Debt obligations |
|
Category E |
|
|
|
|
|
|
300 |
|
|
|
39 |
|
| |
|
|
|
|
|
|
|
$ |
4,874 |
|
|
$ |
10,089 |
|
| |
(1) |
Financial instrument designations are as follows: Category A=Financial assets and liabilities at fair value through profit and loss; Category B=Available for
sale investments; Category C=Held to maturity investments; Category D=Loans and receivables; and Category E=Financial liabilities at amortized cost. |
| 27. |
COMMITMENTS AND CONTINGENCIES |
General Legal Matters
The Company is involved, from time to time, in various legal actions and claims in the ordinary course of business. In the opinion of
management, the aggregate amount of any potential liability is not expected to have a material adverse effect on the Company’s financial position or results.
Third Party Indemnities
The Company remains a guarantor under a sales contract included in the sale of the U.S. Mining Division to Energy Fuels Inc.
(“EFR”) in June 2012. The sales contract requires deliveries of 200,000 pounds of U3O8 per year from 2013 to 2017 at a selling
price of 95% of the long-term U3O8 price at the time of delivery. Should EFR not be able to deliver for any reason other than “force
majeure” as defined under the contract, the Company may be liable to the customer for incremental costs incurred to replace the contracted quantities if the unit price of the replacement quantity is greater than the contracted unit price
selling amount. EFR has agreed to indemnify the Company for any future liabilities it may incur related to this guarantee.
The
Company has agreed to indemnify EFR against any future liabilities it may incur in connection with ongoing litigation between Denison Mines (USA) Corp (“DUSA”) (a company acquired by EFR as part of the sale of the U.S. Mining Division) and
a contractor in respect of a construction project at the White Mesa mill. In the event that the matter is decided in DUSA’s favour, the Company is entitled to any proceeds that are received or recovered by EFR pursuant to its indemnity. Both
parties agreed to resolve the dispute via binding arbitration and arbitration hearings for this matter were held in November 2013. In January 2014 an arbitration order was issued in DUSA’s and Denison’s favour. The contractor
later filed a motion to vacate the arbitration award to which Denison filed a response in opposition and, in July 2014, the Utah state court denied the contractor’s motion to vacate the arbitration award and confirmed the arbitrator’s
award in favour of Denison. The contractor subsequently filed a motion to appeal the decision of the Utah state court. In January 2016, appeal arguments were heard by the Utah Court of Appeals and a decision is pending. The Company does not
expect to recover a material amount of damages related to this issue.
46
Performance Bonds and Letters of Credit
In conjunction with various contracts, reclamation and other performance obligations, the Company may be required to issue performance
bonds and letters of credit as security to creditors to guarantee the Company’s performance. Any potential payments which might become due under these items would be related to the Company’s non-performance under the applicable contract.
As at December 31, 2015, the Company had outstanding letters of credit of $7,007,000 of which $7,007,000 (CAD$9,698,000) is collateralized by a reduction in the amount available under the Company’s 2015 credit facility (see note 16).
Others
The
Company has committed to payments under various operating leases and other commitments. Excluding spending amounts which may be required to maintain the Company’s mineral properties in good standing, the future minimum payments are as
follows:
|
|
|
|
|
| (in thousands) |
|
|
|
|
|
| 2016 |
|
$ |
232 |
|
| 2017 |
|
|
140 |
|
| 2018 |
|
|
86 |
|
| 2019 |
|
|
74 |
|
| 2020 |
|
|
69 |
|
| 2021 and thereafter |
|
|
361 |
|
| |
|
$ |
962 |
|
| 28. |
INTEREST IN OTHER ENTITIES |
The significant entities and contractual interests in which Denison has a non-100% voting / participating interest at December 31,
2015 are listed below.
|
|
|
|
|
|
|
|
|
|
|
|
|
|
|
|
|
|
|
|
|
| |
|
| |
|
Place
Of
Business |
|
|
Entity
Type (1) |
|
|
Denison
Voting
Interest (2) |
|
|
Denison
Participating
Interest (3) |
|
|
Accounting
Method (4) |
|
| |
|
|
|
|
|
|
|
| Non-100% Owned Entities |
|
|
|
|
|
|
|
|
|
|
|
|
|
|
|
|
|
|
|
|
|
|
|
|
|
|
| Waterbury Lake Uranium Corp |
|
|
Canada |
|
|
|
JO-1 |
|
|
|
60.00% |
|
|
|
60.00% |
|
|
|
Proportionate Share |
|
| Waterbury Lake Uranium LP |
|
|
Canada |
|
|
|
JO-1 |
|
|
|
61.55% |
|
|
|
61.55% |
|
|
|
Proportionate Share |
|
| Pitchstone Namibia (Pty) Ltd |
|
|
Namibia |
|
|
|
SUB |
|
|
|
90.00% |
|
|
|
100.00% |
|
|
|
Consolidation |
|
|
|
|
|
|
|
| Non-100% Owned Contractual Arrangements |
|
|
|
|
|
|
|
|
|
|
|
|
|
|
|
|
|
|
|
|
|
|
|
|
|
|
| McClean Joint Venture Agreement |
|
|
Canada |
|
|
|
JO-2 |
|
|
|
22.50% |
|
|
|
22.50% |
|
|
|
Proportionate Share |
|
| Midwest Joint Venture Agreement |
|
|
Canada |
|
|
|
JO-2 |
|
|
|
25.17% |
|
|
|
25.17% |
|
|
|
Proportionate Share |
|
| Wheeler River |
|
|
Canada |
|
|
|
JO-2 |
|
|
|
60.00% |
|
|
|
60.00% |
|
|
|
Proportionate Share |
|
| Mann Lake |
|
|
Canada |
|
|
|
JO-2 |
|
|
|
30.00% |
|
|
|
30.00% |
|
|
|
Proportionate Share |
|
| Wolly |
|
|
Canada |
|
|
|
JO-2 |
|
|
|
22.50% |
|
|
|
22.50% |
|
|
|
Proportionate Share |
|
| |
|
| |
(1) |
The Entity Type classifications are as follows: SUB=Subsidiary; JO-1=Joint Operations having joint control as defined by IFRS 11; and JO-2=Joint Operations
not having joint control and beyond the scope of IFRS 11; |
| |
(2) |
Voting Interest represents Denison’s percentage voting interest in the entity or contractual arrangement; |
| |
(3) |
Participating interest represents Denison’s percentage funding contribution to the particular arrangement. This percentage can differ from equity
interest in instances where other parties to the arrangement have carried interests in the arrangement; and |
| |
(4) |
Proportionate share is where Denison accounts for its share of assets, liabilities, revenues and expenses of the arrangement in relation to its participating
interest. |
Pitchstone Namibia (Pty) Ltd (“Pitchstone Namibia”) was acquired by Denison as part of the
Fission Energy Corp acquisition in April 2013. Pitchstone Namibia’s key asset is the Dome project. Denison’s participating interest is larger than its voting interest at this time due to its partner’s carried interest. Denison is
currently funding 100% of the activities of this entity.
47
Sale of Mongolia Mining Division – Update on Mining License Applications
On December 2, 2015, Uranium Industry submitted applications to the Mongolian government for mining licenses for all four projects
included as part of the Mongolian Mining Division sale (see note 6). On January 5, 2016, the Company received copies of mining application acknowledgement receipts, for all four projects, as part of the completeness review component of the
mining license issuance process. As at March 9, 2016, the Mongolia government has not yet made any formal decision to issue mining licenses for the Mongolia projects.
Bank of Nova Scotia Credit Facility Renewal
On January 29, 2016, the Company entered into an agreement with the Bank of Nova Scotia to extend the maturity date and the terms of
the 2015 facility (see note 16). Under the 2016 facility, the maturity date has been extended to January 31, 2017 and the Company continues to have access to credit up to CAD$24,000,000 whose use is restricted to non-financial letters of
credit in support of reclamation obligations (see note 15). All other significant terms of the 2016 facility (tangible net worth covenant, minimum cash balance covenant and security for the facility) remain unchanged from those of the 2015
facility.
The 2016 facility is subject to letter of credit and standby fees of 2.40% and 0.75% respectively.
UPC Management Services Agreement Renewal
The current management services agreement for UPC, which expires on March 31, 2016, has been renewed for another three years effective
April 1, 2016. Under the new agreement, Denison will receive the following fees from UPC: a) a base fee of CAD$400,000 per annum, payable in equal quarterly installments; b) a variable fee equal to (i) 0.3% per annum of UPC’s total assets in
excess of CAD$100 million and up to and including CAD$500 million, and (i) 0.2% per annum of UPC’s total assets in excess of CAD$500 million; c) a fee, at the discretion of the Board, for on-going monitoring or work associated with a
transaction or arrangement (other than a financing, or the acquisition of or sale of U3O8 or UF6); and d) a commission of 1.0% of the gross value of any purchases or sales of U3O8
or UF6 or gross interest fees payable to UPC in connection with any uranium loan arrangements.
McClean and Midwest Site Restoration Plans – Regulatory Update
At the end of February 2016, the Company received letter acceptance from the applicable regulatory authorities that its updated site
restoration plan for the McClean Lake and Midwest projects, submitted in January 2016, was approved. Under the approved plan, the Company is required to increase its financial assurance to Saskatchewan Environment from the current amount
of CAD$9,698,000 to CAD$24,134,000. It is anticipated that the increased financial assurance will be required to be provided during the second quarter of 2016.
48
Exhibit 99.3

MANAGEMENT’S DISCUSSION & ANALYSIS
FOR THE YEAR ENDED DECEMBER 31, 2015
This Management’s Discussion and Analysis (“MD&A”) of Denison Mines Corp. and its subsidiary companies and joint arrangements
(collectively, “Denison” or the “Company”) provides a detailed analysis of the Company’s business and compares its financial results with those of the previous year. This MD&A is dated as of March 9, 2016 and should be
read in conjunction with the Company’s audited consolidated financial statements and related notes for the year ended December 31, 2015. The audited consolidated financial statements are prepared in accordance with International Financial
Reporting Standards (“IFRS”) as issued by the International Accounting Standards Board (“IASB”). All dollar amounts are expressed in U.S. dollars, unless otherwise noted.
Other continuous disclosure documents, including the Company’s press releases, quarterly and annual reports, Annual Information Form and Form 40-F,
are available through the Company’s filings with the securities regulatory authorities in Canada at www.sedar.com (“SEDAR”) and the United States at www.sec.gov/edgar.shtml (“EDGAR”).
|
|
|
|
|
|
MANAGEMENT’S DISCUSSION & ANALYSIS |
2015 PERFORMANCE HIGHLIGHTS
| ¡ |
|
Reported a significant increase in estimated mineral resources at the Wheeler River property |
The Company completed an initial mineral resource estimate for the basement hosted Gryphon uranium deposit, which is located three
kilometres to the northwest of the high-grade unconformity hosted Phoenix deposit. The Gryphon deposit is estimated to contain an inferred mineral resource of 43.0 million pounds U3O8 at an average grade of 2.3% U3O8. Together with the high-grade Phoenix deposit,
Wheeler River is now estimated to contain indicated mineral resources of 70.2 million pounds U3O8 at an average grade of 19.1% U3O8 and inferred resources totaling 44.1 million pounds U3O8 at a combined grade of 2.34% U3O8. The increase to the mineral resources
estimated at Denison’s 60% owned Wheeler River property establishes the project as one of the largest and highest grade undeveloped uranium projects in the Athabasca Basin region. A Preliminary Economic Analysis (“PEA”) was initiated
in 2015 to evaluate the economic merit of the co-development of the Gryphon and Phoenix deposits and is expected to be delivered in the first half of 2016.
| ¡ |
|
Experienced continued exploration success at the Wheeler River property |
Highlights from the 2015 winter and summer drilling program include the expansion of the Gryphon zone and completion of the definition
drilling required to complete an initial resource estimate, as well as the discovery of additional uranium mineralization in the vicinity of the Gryphon deposit. Denison completed a winter exploration program at Wheeler consisting of 17,700
metres of diamond drilling in 26 drill holes and a summer exploration program involving 24,468 metres of drilling in 34 drill holes. Highlights from exploration at Wheeler during 2015 include:
Expansion of basement hosted uranium at the Gryphon deposit
During the winter program, seven out of 12 drill holes targeting extensions of the Gryphon deposit, intersected significant uranium
mineralization. As a result, the zone was extended up-plunge, down-plunge and up-dip on two sections. Following up on the winter program, the best result from the summer program was in drill hole WR-604, which intersected 6.3% U3O8 over 5.5 metres, followed by 11.6% U3O8 over 1.0 metres, extending the zone of mineralization approximately 50 metres in the down-dip section.
Discovery of additional uranium mineralization in the vicinity of the Gryphon deposit
Fourteen drill holes in the winter program were completed to explore for other areas of mineralization along strike to the south of
Gryphon on the K-North Trend, which resulted in the discovery of high-grade uranium mineralization occurring at the unconformity, 800 metres to the south of Gryphon. The highlight was drill hole WR-597, which intersected 4.5% U3O8 over 4.5 metres. The summer program followed up with 20 drill holes to evaluate a variety of targets and identify additional
mineralization. The best result from these targets was in drill hole WR-612, which intersected 2.4% U3O8 over 2.5 metres, approximately
25 metres below the unconformity, roughly one kilometer south of Gryphon. Taken together these results highlight the prospectivity of the K-North trend and the area surrounding the Gryphon deposit.
| ¡ |
|
Generated positive 2015 exploration results at other pipeline exploration properties |
Murphy Lake – At Denison’s 68.85%
owned Murphy Lake property, a drill program consisting of five holes totaling 1,818 metres was completed, intersecting a new zone of uranium mineralization with drill hole MP-15-03, which returned 0.25% U3O8 over 6.0 metres at the sub-Athabasca unconformity, approximately 270 metres below surface.
Waterbury Lake – Work focused on the
Oban target area at Denison’s 61.55% owned Waterbury Lake project. Ground geophysical surveys were completed earlier in the year, improving the geological interpretation of the area and highlighting several drill targets that were tested during
the summer drilling program. Three holes intersected weak mineralization and several others intersected strong alteration and/or structure.
Crawford Lake – At Denison’s 100%
owned Crawford Lake property, a large zone of significant sandstone alteration along the CR-2 and CR-5 conductors was extended by the summer drilling program and has now been confirmed over a strike length of 2.9 kilometres.
| ¡ |
|
Exceeded initial 2015 guidance for toll milling revenue at McClean Lake |
The McClean Lake mill, in which Denison holds a 22.5% interest, packaged approximately 11.3 million pounds U3O8 during the year (initially targeted at six to eight million packaged pounds) for the Cigar Lake Joint Venture (“CLJV”),
generating toll milling revenues for Denison of $3.2 million.
2
|
|
|
|
|
|
MANAGEMENT’S DISCUSSION & ANALYSIS |
| ¡ |
|
Completed the sale of the Company’s Mongolian interests for consideration of up to $13.25 million
|
In December 2015, Denison announced the receipt of $1.25 million in initial payments from Uranium
Industry a.s. (“Uranium Industry”), of the Czech Republic, and the closing of the sale of its interest in the Gurvan Saihan joint venture (“GSJV”) pursuant to an amended and restated share purchase agreement entered into on
November 25, 2015 (the “GSJV Agreement”). Denison has the rights to receive additional proceeds from the sale of up to $12 million, of which up to $10 million becomes payable within 60 days of the issuance of certain mining
licences, for areas covered by the exploration licences held by the GSJV.
| ¡ |
|
Obtained financing for the Company’s 2016 Canadian exploration activities |
In May 2015, the Company completed a CAD$15.0 million private placement offering for the issuance of 12,000,000 flow-through common
shares at a price of CAD$1.25 per share. The proceeds will be used to fund Canadian exploration activities through to the end of 2016.
ABOUT DENISON
Denison was
formed under the laws of Ontario and is a reporting issuer in all Canadian provinces. Denison’s common shares are listed on the Toronto Stock Exchange (the “TSX”) under the symbol “DML” and on the NYSE MKT exchange
under the symbol “DNN”.
Denison is a uranium exploration and development company with interests focused in the Athabasca Basin region of
northern Saskatchewan, Canada. In addition to its 60% owned Wheeler River project, which hosts the high grade Phoenix and Gryphon uranium deposits, Denison’s exploration portfolio consists of numerous projects covering over 390,000 hectares in
the eastern Athabasca Basin. Denison’s interests in Saskatchewan also include a 22.5% ownership interest in the McClean Lake joint venture (“MLJV”), which includes several uranium deposits and the McClean Lake uranium mill, which is
currently processing ore from the Cigar Lake mine under a toll milling agreement, plus a 25.17% interest in the Midwest deposit and a 61.55% interest in the J Zone deposit on the Waterbury Lake property. Both the Midwest and J Zone deposits are
located within 20 kilometres of the McClean Lake mill. Internationally, Denison owns 100% of the Mutanga uranium project in Zambia, 100% of the uranium-silver-copper Falea project in Mali and a 90% interest in the Dome uranium project in
Namibia.
Denison is engaged in mine decommissioning and environmental services through its Denison Environmental Services (“DES”)
division, which manages Denison’s Elliot Lake reclamation projects and provides post-closure mine and maintenance services to a variety of industry and government clients.
Denison is also the manager of Uranium Participation Corporation (“UPC”), a publicly traded company listed on the TSX under the symbol
“U”, which invests in uranium oxide in concentrates (“U3O8”) and uranium hexafluoride.
STRATEGY
Denison has built one
of the strongest portfolios of strategic uranium deposits and properties, including an interest in a uranium milling facility, in the eastern Athabasca Basin. Denison plans to aggressively explore its most prospective properties to expand
existing resources and delineate new uranium resources. The Company intends to increase shareholder value through the evaluation and advancement of the Wheeler River property and continued success advancing various high priority exploration
properties to position the Company as a top-tier Athabasca Basin focused uranium investment.
3
|
|
|
|
|
|
MANAGEMENT’S DISCUSSION & ANALYSIS |
URANIUM INDUSTRY OVERVIEW
In 2015, the focus of the nuclear energy and uranium industries remained on Japan. During this year, however, attention was focussed on the number of
Japanese nuclear reactors that were brought back on to the grid, as opposed to the 54 reactors that were shut down following the Fukushima Daichii nuclear incident, which occurred in March 2011. In June 2015 the Japanese government
approved a draft plan for electricity generation to 2030, which calls for nuclear to provide roughly 20-22% of the country’s power, and in September 2015, the Japanese nuclear energy industry achieved a significant milestone with the
commercial restart of Kyushu Electric Power Company’s Sendai Unit 1 reactor. The restart at Sendai Unit 1 was followed by the restart of the Sendai Unit 2 reactor in November 2015 and Kansai Electric Power Company’s Takahama Unit 3
reactor in February 2016. These restarts provide significant encouragement for the nuclear energy industry in Japan, which through various companies are in the process of completing modifications, and obtaining licences and approvals to bring
over 20 additional nuclear power plants online.
With Japan returning to nuclear power generation in 2015, the focus for the industry has started to
turn to China, India and Russia – each of which have adopted ambitious plans to increase the use of nuclear power. In the cases of China and India, nuclear power is seen as a preferred choice to provide reliable base load power and address an
emerging crisis around a lack of clean air and a growing problem with greenhouse gas emissions.
According to the World Nuclear Association
(“WNA”), as of January 1, 2016, China had 30 operable nuclear reactors capable of producing 26.8 gigawatts of electricity. A further 24 reactors are under construction and an additional 176 reactors are either planned or proposed. Ux
Consulting Company, LLC (“UxC”) estimates that 128 reactors are expected to be operable and capable of producing over 130 gigawatts of electricity by 2030, representing 5 times as much power capacity as is currently available from nuclear.
To achieve this level of production, China’s fleet of nuclear reactors will have to increase by between 6 and 7 reactors each year for the next 15 years. The WNA is projecting a similar growth profile for India, where 21 reactors were operable
as of January 1, 2016, capable of producing 5.3 gigawatts of power. Taken together, 66 reactors are either under construction, planned or proposed in India. UxC estimates that over 22 gigawatts could be operable by 2030, representing over 4
times as much power capacity as is currently available from nuclear. To achieve this level of production, India’s fleet of nuclear reactors will have to increase by 20 reactors over the next 15 years – meaning that at least one additional
reactor will have to join the fleet each year.
Throughout 2015, the spot price of uranium has sustained itself well above the lows of $28 per pound
U3O8 range noted in mid-2014. While the spot price increased during the first quarter of 2015, to near $40 per pound U3O8, it softened somewhat during the second through fourth quarter of the year, to finish the year at $34.25 per pound U3O8. The softness in the spot market continues to reflect the fact that the market is currently oversupplied, as a result of a
combination of factors, including production being sold into higher-priced long term contracts, supply coming from secondary sources, and the impact of a strengthening US dollar. The strengthening of the US dollar provides several producers
with the opportunity to sell into the spot market at significantly higher prices in their local currency, than would have been possible in past years. In Canada, for example, the spot price per pound U3O8 in Canadian dollars has increased by over 65% to roughly CAD$50 per pound U3O8 from the low of CAD$30 per pound U3O8 noted in mid-2014.
Although the uranium market is currently oversupplied, the long term growth projections for the nuclear industry combined with the expected depletion of
uranium resources in operation today, continue to suggest that a significant long term supply shortage could emerge, even with new production sources expected to come online. With a sustained period of low commodity prices, the uranium mining
industry has been challenged to discover and advance the new production sources necessary to meet the expected increase in demand in future years. Higher prices are expected to be required to justify the construction of new mines, and in the absence
of a significant price increase in the near term, it is possible that even the most ambitious development plans could leave the market with an unavoidable supply shortage as soon as the early 2020s.
Uranium Demand
The WNA reports that there are 439 nuclear
reactors operable in 30 countries as of January 1, 2016. These reactors can generate 382.5 gigawatts of electricity and supply over 11% of the world’s electrical requirements. As of January 1, 2016, 66 nuclear reactors are
under construction in 14 countries with the principal drivers of this expansion being China (24 reactors under construction), Russia (8), India (6), the United States (5), South Korea (4) and UAE (4). Based on the most recent statistics from
the WNA, there are a total of 224 reactors that are either under construction, or planned around the world, and an additional 330 reactors that are proposed, with the potential to be operating by 2030. According to UxC, in its “Uranium Market
Outlook – Q4 2015” (the “Q4 Outlook”), global nuclear power capacities are projected to increase by 44%, from 376.6 gigawatts in 2015 to 540.6 gigawatts in 2030. Of the net growth in nuclear generation capacities, China accounts
for 64% while India, Korea and Russia collectively make up a further 24%. The
4
|
|
|
|
|
|
MANAGEMENT’S DISCUSSION & ANALYSIS |
Q4 Outlook also estimates that uranium demand could grow by over 48% to as high as 266.8 million pounds U3O8 by 2030 from an estimated 179.3 million pounds of U3O8 in 2015.
Primary Uranium Supply
According to the Q4 Outlook, uranium
production increased slightly year over year from 145.3 million pounds U3O8 in 2014 to an estimated 151.3 million pounds U3O8 in 2015. Factoring out the additional production associated with the ramp up of activities at the Cigar Lake mine, global production
declined by roughly 5.3 million pounds U3O8, representing a decline of 3.6% from 2014. Production from Africa, and the United States
declined in 2015, while production from Australia, Russia and Kazakhstan remained relatively consistent. Cigar Lake increased production from Canada. Canada remains the second largest producing nation with nearly 22% of the world’s production
from 2015 coming from within Canada. Kazakhstan continues to be the world’s largest producer of uranium, representing nearly 40% of production in 2015.
UxC has estimated in its Q4 Outlook that existing mine production, plus new planned and potential mine production, will increase primary uranium supply
from an estimated 151.3 million pounds U3O8 in 2015 to 168.7 million pounds U3O8 by 2025. This represents an increase of approximately 11.5%, as compared to the dramatic increases in uranium demand noted above. In past years, UxC projected that Kazahstan was expected
to continue to be one of the principal drivers for the increases in primary mine production. In the Q4 Outlook, the main drivers are now limited to the Cigar Lake mine in Canada, which is expected to increase production up to 18 million pounds
U3O8, per year, and the Husab mine in Namibia, which is being built by a Chinese utility as a source of captive supply, and continues to
be projected to start production in 2016. For other projects to move forward to meet the production forecasts, uranium prices will need to increase appreciably to support their higher cost production profiles and the significant capital
expenditures that will be required.
Secondary Uranium Supply
Primary mine production supplies approximately 84% of current demand. The balance of demand is supplied from secondary sources such as commercial
inventories, reprocessing of spent fuel, sales by uranium enrichers and inventories held by governments, in particular the U.S. Department of Energy.
Excess commercial inventories, which were once one of the major sources of secondary supplies during the period from the early 1970s to the early 2000s,
have largely been consumed; however, as a result of the shutdown of the German nuclear program and the continued shut down of the majority of the Japanese nuclear fleet, commercial inventories could become a more significant factor. A large
source of secondary supplies continues to be government inventories, particularly in the U.S. and Russia. The disposition of these inventories may have a market impact over the next 10 to 20 years, although, the rate and timing of this material
entering the market is uncertain.
Reprocessing of spent fuel is another source of secondary supply but is expected to satisfy roughly 5% of
demand. Expansion of this secondary source would require major investments in facilities which could only be supported by a significant increase in long-term uranium prices.
UxC expects that secondary sources of supply will fall from estimated 2015 levels of 39.7 million pounds
U3O8 per year to 24.6 million pounds U3O8 per year by 2025.
Uranium Prices
Nuclear utilities purchase uranium primarily through long-term contracts. These contracts usually provide for deliveries to begin two to four years after
they are signed and provide for delivery from four to ten years thereafter. In awarding medium and long-term contracts, electric utilities consider the producer’s uranium reserves, record of performance and production cost profile, in addition
to the commercial terms offered. Prices are established by a number of methods, including base prices adjusted by inflation indices, reference prices (generally spot price indicators, but also long-term reference prices) and annual price
negotiations. Contracts may also contain annual volume flexibility, floor prices, ceiling prices and other negotiated provisions. Under these contracts, the actual price mechanisms are usually confidential.
The long-term demand that actually enters the market is affected in a large part by utilities’ uncovered requirements. UxC estimates that uncovered
demand is only 7.4 million pounds U3O8 or 4% of projected demand in 2016. Uncovered demand, however, is projected by UxC to increase
significantly over the period of 2016 to 2019, such that up to 75.1 million pounds remains uncovered for 2020, representing roughly 39% of projected demand in that year. Uncovered demand rises rapidly for years after 2020 to over 175
million pounds per year (or 78% of projected total demand) for 2025. At 175 million pounds, the uncovered demand in 2025 is estimated to be nearly as much as total
5
|
|
|
|
|
|
MANAGEMENT’S DISCUSSION & ANALYSIS |
demand estimated for 2015 and approximately 6 million pounds U3O8 greater than the
total production expected from new and existing mine production in 2025 – some of which is already committed to the covered portion of the demand projected in 2025. In order to address the rising portion of demand that is uncovered, utilities
will have to return to the market and enter into long-term contracts. From 2006 to 2010, on average, 39 million pounds U3O8 equivalent
were purchased on the spot market per year and roughly 200 million pounds U3O8 equivalent were contracted in the long term market each
year. By comparison, from 2011 to 2015, on average, 47 million pounds U3O8 equivalent have been purchased on the spot market per
year, while less than 100 million pounds U3O8 equivalent were contracted in the long term market each year. In 2014 and 2015, long
term contracting volumes were roughly 77 million pounds U3O8 per year. With low contract volumes in recent years and increasing
uncovered requirements, we expect that long term contracting activity will have to increase in the near future as utilities look to secure supply and move U3O8 through the nuclear fuel cycle in order to fuel the world’s growing fleet of nuclear reactors.
The long-term price is published on a monthly basis and began the year at $49.00 per pound U3O8. On historically low volumes, as noted above, the long-term price declined to $44.00 per pound U3O8 by the end of the year.
Electric utilities procure their remaining uranium requirements through
spot and near-term purchases from uranium producers, traders and other suppliers. Historically, spot prices are more volatile than long-term prices. The spot price began the year at $35.50 per pound U3O8. It rose to $39.50 per pound U3O8 during the beginning of the year and then declined to $34.25 per pound U3O8 by the
end of the year and was last quoted at $31.10 per pound U3O8 on March 7, 2016.
Given the strengthening of the US dollar relative to the currencies of the majority of the uranium producing countries (including Kazakhstan, Canada, and
Australia), a relatively flat US dollar denominated spot price for uranium could reflect the fundamental strength of the uranium market. While other commodities have declined significantly in both US dollar terms and foreign currency terms, in
particular oil, uranium has remained relatively flat in US dollar terms and has seen significant increases in foreign currency terms. In Canada, for example, the spot price of uranium in Canadian dollar terms increased by over 15% in
2015. By comparison, the price of oil in Canadian dollar terms (West Texas Intermediate) has decreased by over 17% in 2015. The rising price of uranium in foreign currency terms should encourage spot market sales, which should put downward
pressure on prices. Despite this, we have seen the spot price for uranium remain relatively flat in 2015 and into the first part of 2016.
Competition
The uranium industry is small compared to other commodity industries, in particular other energy commodity industries. Uranium demand is
international in scope but supply is characterized by a relatively small number of companies operating in only a few countries. Production by four producers accounted for approximately 62% of the estimated world production in 2015. In total, nine
producers represent 88.3% of the world’s production. The industry is also geographically concentrated with about 70% of the world’s production coming from only three countries: Kazakhstan, Canada, and Australia. Kazakhstan is the largest
producer, with production of approximately 40% of the total primary production in 2015.
Competition is somewhat different amongst exploration &
development companies focused on the discovery or development of a uranium deposit. Exploration for uranium is being carried out on various continents, but expenditures by public companies have been generally concentrated in recent years in
Canada and in Africa. In Canada, exploration has focused on the Athabasca Basin region in northern Saskatchewan. Explorers have been drawn to the Athabasca Basin region by the high-grade uranium deposits that have produced some of the most
successful uranium mines operating in the world today. Within the Athabasca Basin region, exploration is generally divided between activity that is occurring in the eastern portion of the Basin and the western portion of the Basin. The
eastern Basin is a district that is defined by rich infrastructure associated with the existence of several operating uranium mines and uranium processing facilities. Infrastructure includes access to the provincial power grid and a network of
provincial all weather highways. By comparison, in the western Basin, there are no operating uranium mines or processing facilities and access to the provincial power grid is not currently available. Several uranium discoveries have been
made in the Athabasca Basin region in recent years, and competition for capital can be intense. In Africa, exploration activity has slowed in recent years as investment has been difficult to come by to fund the relatively low-grade and
potentially high-cost operations that are expected to emerge from African uranium deposits.
6
|
|
|
|
|
|
MANAGEMENT’S DISCUSSION & ANALYSIS |
SELECTED ANNUAL FINANCIAL INFORMATION
|
|
|
|
|
|
|
|
|
| |
| (in thousands, except for per share amounts) |
|
|
|
Year Ended
December 31, 2015 |
|
|
|
Year Ended
December 31,
2014 |
| |
|
|
|
|
|
| Continuing Operations: |
|
|
|
|
|
|
|
|
| Total revenues |
|
$ |
|
12,670 |
|
$ |
|
9,619 |
| Mineral property exploration |
|
$ |
|
(14,257) |
|
$ |
|
(14,401) |
| Impairment of mineral properties |
|
$ |
|
(27,767) |
|
$ |
|
(1,745) |
| Net loss |
|
$ |
|
(61,737) |
|
$ |
|
(28,266) |
| Basic and diluted loss per share |
|
$ |
|
(0.12) |
|
$ |
|
(0.06) |
|
|
|
|
|
| Discontinued Operations: |
|
|
|
|
|
|
|
|
| Net income (loss) |
|
$ |
|
10,177 |
|
$ |
|
(3,437) |
| Basic and diluted income (loss) per share |
|
$ |
|
0.02 |
|
$ |
|
(0.01) |
| |
| |
|
|
|
|
|
|
|
|
| |
| (in thousands) |
|
|
|
As at
December 31,
2015 |
|
|
|
As at
December 31,
2014 |
| |
|
|
|
|
|
| Financial Position: |
|
|
|
|
|
|
|
|
| Cash and cash equivalents |
|
$ |
|
5,367 |
|
$ |
|
18,640 |
| Short term investments |
|
|
|
7,282 |
|
|
|
4,381 |
| Long term investments |
|
|
|
496 |
|
|
|
954 |
| Cash, cash equivalents and investments |
|
$ |
|
13,145 |
|
$ |
|
23,975 |
|
|
|
|
|
| Working capital |
|
$ |
|
12,772 |
|
$ |
|
22,542 |
| Property, plant and equipment |
|
$ |
|
188,250 |
|
$ |
|
270,388 |
| Total assets |
|
$ |
|
212,758 |
|
$ |
|
311,330 |
| Total long-term liabilities |
|
$ |
|
38,125 |
|
$ |
|
42,291 |
| |
SELECTED QUARTERLY FINANCIAL INFORMATION
|
|
|
|
|
|
|
|
|
|
|
|
|
|
|
|
|
| (in thousands, except for per share amounts)
|
|
2015
Q4 |
|
|
2015
Q3 |
|
|
2015
Q2 |
|
|
2015 Q1
|
|
|
|
|
|
|
| Continuing Operations: |
|
|
|
|
|
|
|
|
|
|
|
|
|
|
|
|
| Total revenues |
|
$ |
3,887 |
|
|
$ |
3,526 |
|
|
$ |
2,929 |
|
|
$ |
2,328 |
|
| Net loss |
|
$ |
(24,598) |
|
|
$ |
(21,988) |
|
|
$ |
(4,074) |
|
|
$ |
(11,077) |
|
| Basic and diluted loss per share |
|
$ |
(0.05) |
|
|
$ |
(0.04) |
|
|
$ |
(0.01) |
|
|
$ |
(0.02) |
|
|
|
|
|
|
| Discontinued Operations: |
|
|
|
|
|
|
|
|
|
|
|
|
|
|
|
|
| Net income (loss) |
|
$ |
8,992 |
|
|
$ |
556 |
|
|
$ |
(60) |
|
|
$ |
1,283 |
|
| Basic and diluted income (loss) per share
|
|
$ |
0.02 |
|
|
$ |
- |
|
|
$ |
- |
|
|
$ |
- |
|
| |
|
|
|
|
|
|
|
|
|
|
|
|
|
|
|
|
| (in thousands, except for per share amounts)
|
|
2014 Q4
|
|
|
2014
Q3 |
|
|
2014
Q2 |
|
|
2014
Q1 |
|
|
|
|
|
|
| Continuing Operations: |
|
|
|
|
|
|
|
|
|
|
|
|
|
|
|
|
| Total revenues |
|
$ |
2,736 |
|
|
$ |
2,351 |
|
|
$ |
2,358 |
|
|
$ |
2,174 |
|
| Net loss |
|
$ |
(5,020) |
|
|
$ |
(4,592) |
|
|
$ |
(8,687) |
|
|
$ |
(9,967) |
|
| Basic and diluted loss per share |
|
$ |
(0.01) |
|
|
$ |
(0.01) |
|
|
$ |
(0.02) |
|
|
$ |
(0.02) |
|
|
|
|
|
|
| Discontinued Operations: |
|
|
|
|
|
|
|
|
|
|
|
|
|
|
|
|
| Net income (loss) |
|
$ |
368 |
|
|
$ |
1,772 |
|
|
$ |
(2,877) |
|
|
$ |
(2,700) |
|
| Basic and diluted income (loss) per share
|
|
$ |
- |
|
|
$ |
- |
|
|
$ |
(0.01) |
|
|
$ |
(0.01) |
|
7
|
|
|
|
|
|
MANAGEMENT’S DISCUSSION & ANALYSIS |
RESULTS OF CONTINUING OPERATIONS
REVENUES
McClean Lake Uranium Mill
McClean Lake is located on the eastern edge of the Athabasca Basin in northern Saskatchewan, approximately 750 kilometres north of
Saskatoon. Denison holds a 22.5% ownership interest in the McClean Lake uranium mill, one of the world’s largest uranium processing facilities, which is currently processing ore from the Cigar Lake mine under a toll milling agreement. The
MLJV is a joint venture between AREVA Resources Canada Inc. (“ARC”) with a 70% interest, Denison with a 22.5% interest and OURD (Canada) Co. Ltd. with a 7.5% interest.
The McClean Lake mill is operated by ARC and is currently licensed for annual production of 13 million pounds U3O8. The expansion of the McClean Lake mill from 13 million to 24 million pounds annual
U3O8 production capacity is in progress and remains fully funded by the CLJV.
During 2015, the McClean Lake mill continued to process ore received from the Cigar Lake mine. The mill packaged approximately 11.3 million pounds U3O8 for the CLJV. The Company’s share of toll milling revenue during 2015 totaled $3,155,000. In 2014, toll milling revenue of
$111,000 was recognized in the fourth quarter, as the first drums of CLJV uranium were packaged beginning in October 2014.
Denison Environmental Services
Mine decommissioning and environmental services are provided through Denison’s DES division – providing long-term care and maintenance
for closed mine sites since 1997. With offices in Elliot Lake, Ontario, the Yukon Territory and Quebec, DES manages Denison’s Elliot Lake reclamation projects and provides post-closure mine care and maintenance services to various customers.
Revenue from DES during 2015 was $7,607,000, compared to $7,327,000 in 2014. In 2015, DES experienced an increase in Canadian dollar revenues
due to an increase in activity at certain care and maintenance sites, which was partly offset by the unfavourable fluctuation in foreign exchange rates applicable on the translation of revenues earned in Canadian dollars.
Uranium Participation Corporation
Denison provides general
administrative and management services to UPC. Management fees and commissions earned by the Company provide Denison with a source of cash flow to partly offset corporate administrative expenditures incurred by the Company. The management
services arrangement between Denison and UPC has been extended for another three year term, effective April 1, 2016. Refer to SUBSEQUENT EVENTS below.
Revenue from the Company’s management contract with UPC was $1,822,000 during 2015, compared to $2,181,000 in 2014. The decrease in revenues during
2015 was due to a reduction in commissions earned from reduced uranium purchases made by UPC and an unfavourable fluctuation in foreign exchange rates applicable on the translation of revenues earned in Canadian dollars, partly offset by an increase
in management fees earned based on UPC’s monthly net asset value. Refer to RELATED PARTY TRANSACTIONS below for further details.
OPERATING EXPENSES
Canada
Canadian mining segment operating expenses include
depreciation, development and standby costs, as well as certain adjustments to the estimates of future reclamation liabilities at McClean Lake, Midwest and Elliot Lake, if applicable. Operating expenses in 2015 were $4,554,000, compared to
$2,649,000 in 2014.
In 2015, operating expenses included depreciation of the McClean Lake mill of $1,627,000, as a result of processing
approximately 11.3 million pounds U3O8 from the CLJV and 11,000 pounds U3O8 from the MLJV. In 2014, depreciation accounted for $79,000 with 456,000 pounds
U3O8 processed from CLJV and MLJV ore.
In 2015, the Company recorded operating expenses related to an increase in the future estimate of reclamation liabilities of $2,262,000 (2014 -
$2,086,000) to reflect the impact of changing discount rates on the estimated cost of reclamation liabilities at Elliot Lake. Refer to Contractual Obligations and Contingencies Section for further detail.
8
|
|
|
|
|
|
MANAGEMENT’S DISCUSSION & ANALYSIS |
Africa
In
preparation for a potential spin-out or sale transaction of its African portfolio, the Company continued with its objective to maintain its interests in Zambia, Mali and Namibia in good standing. Operating expenses in Africa during 2015 totaled
$303,000, compared to $1,390,000 during 2014, consisting mainly of camp costs incurred on the Falea project in Mali and community aid programs in Zambia. Operating expenses during 2014 were significantly higher as engineering studies and
environmental programs were completed following the acquisition of the Falea project as part of the internal evaluation work being done on the project.
Environmental Services
Operating expenses during 2015 totaled
$6,875,000, compared to $6,917,000 in 2014. The expenses relate primarily to the construction and consulting services provided to clients and include labour and other costs. During 2015, DES experienced an increase in Canadian dollar operating
expenses due to an increase in project activity and new business development at certain care and maintenance sites, which was offset by the favourable fluctuation in foreign exchange rates applicable on the translation of expenses incurred in
Canadian dollars.
MINERAL PROPERTY EXPLORATION
In 2015,
Denison was engaged in uranium exploration and/or evaluation in Canada, Zambia, Mali and Namibia. While the Company has material interests in uranium projects in Africa, the Company is focused primarily on the eastern Athabasca Basin, in
Saskatchewan, Canada, with numerous projects covering over 390,000 hectares. Global exploration expenditures were $14,257,000 during 2015, with over 94% of exploration expenditures being incurred in Canada, compared to $14,401,000 during 2014.
During 2015, the Company incurred an increase in Canadian dollar exploration expenditures, which was offset by a favourable fluctuation in foreign exchange rates applicable on the translation of expenses incurred in Canadian dollars.
Canada – Athabasca Basin, Saskatchewan
The following
table summarizes the exploration activities that were completed during 2015.
|
|
|
|
|
|
|
| |
| CANADIAN EXPLORATION ACTIVITIES |
| |
| Property |
|
Denison’s ownership |
|
Drilling in metres (m) |
|
Other activities |
| |
| Wheeler River |
|
60% |
|
42,168 (60 holes) |
|
Geophysical surveys,
mineral resource estimate |
| Bell Lake
|
|
100% |
|
2,044 (2 holes) |
|
Geophysical surveys |
| Crawford Lake
|
|
100% |
|
8,066 (13 holes) |
|
Geophysical surveys |
| Hatchet Lake
|
|
64.36%(1) |
|
2,552 (9 holes) |
|
Geophysical surveys |
| Jasper Lake
|
|
100% |
|
1,469 (7 holes) |
|
- |
| Lynx Lake
|
|
59.92%(1) |
|
1,338 (2 holes) |
|
- |
| Mann Lake
|
|
30% |
|
7,775 (14 holes) |
|
- |
| Murphy Lake
|
|
68.85%(1) |
|
1,818 (5 holes) |
|
Geophysical surveys |
| Moore Lake
|
|
100% |
|
2,667 (7 holes) |
|
- |
| Turkey Lake
|
|
100% |
|
702 (5 holes) |
|
- |
| Stevenson River
|
|
100% |
|
777 (3 holes) |
|
- |
| Waterbury Lake
|
|
61.55%(2) |
|
4,421 (12 holes) |
|
Geophysical surveys |
| Waterfound North
|
|
59.92%(1) |
|
- |
|
Geophysical surveys |
| Wolly
|
|
22.5% |
|
5,169 (21 holes) |
|
Geophysical surveys |
| |
|
Total |
|
|
|
80,966 (160 holes) |
|
|
| |
| (1) |
The Company’s ownership in these projects is as at December 31, 2015. |
| (2) |
The Company’s ownership in this project is as at December 31, 2015. The Company earned an additional 1.55% interest in the Waterbury Lake project
effective September 30, 2015. Refer to RELATED PARTY TRANSACTIONS below for further details. |
9
|
|
|
|
|
|
MANAGEMENT’S DISCUSSION & ANALYSIS |
The Company’s land position in the Athabasca Basin, as of December 31, 2015, is illustrated
below. Denison’s active exploration properties are shaded and outlined in bold.
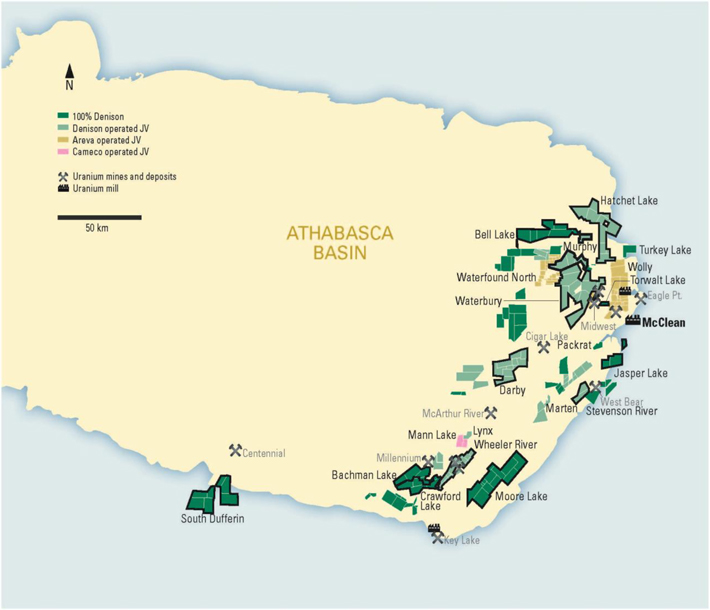
Denison’s share of exploration spending on its Canadian properties was $13,439,000 during 2015, as compared to
$13,488,000 in 2014. Exploration spending in Canada is seasonal with spending higher during the winter exploration season (January to mid-April) and summer exploration season (June to mid-October) in the Athabasca Basin.
10
|
|
|
|
|
|
MANAGEMENT’S DISCUSSION & ANALYSIS |
Wheeler River Project
The Wheeler River property is host to the high-grade Phoenix and Gryphon uranium deposits. The Phoenix deposit is estimated to include 70.2 million
pounds U3O8 (above a cut-off grade of 0.8% U3O8) based on 166,000 tonnes of mineralization at an average grade of 19.1% U3O8, and is
the highest grade undeveloped deposit in the world. The Gryphon deposit is hosted in basement rock, approximately 3 kilometres to the northwest of Phoenix, and is estimated to contain inferred resources of 43.0 million pounds U3O8 (above a cut-off grade of 0.2%
U3O8) based on 834,000 tonnes of mineralization at an average grade of 2.3% U3O8.
The Wheeler River property lies between the McArthur River Mine and the Key Lake mill complex
in the eastern part of the Athabasca Basin in northern Saskatchewan. The eastern Athabasca Basin is a well-established uranium mining district with infrastructure including a provincial power grid, provincial highways, air transportation and
multiple uranium processing facilities, including the 22.5% Denison owned McClean Lake mill. The ore haul road and provincial power line between the McArthur River Mine and the Key Lake mill complex runs along the eastern side of the Wheeler River
property. Denison is the operator of the Wheeler River project and holds a 60% interest, while Cameco Corp. (“Cameco”) holds a 30% interest and JCU (Canada) Exploration Company, Limited (“JCU”) holds a 10% interest.
Exploration Program
Denison’s share of
exploration costs at Wheeler River amounted to $4,552,000 during 2015, compared to $4,543,000 in 2014. The winter 2015 drilling program was completed in April 2015, with a total of 17,700 metres in 26 holes. A total of 24,468 metres of
drilling was completed in 34 drill holes during the summer program at Wheeler River.
| ¡ |
|
Mineral Resource Estimate |
With
the receipt of the final chemical assays from the drilling completed at Gryphon in summer 2015, the Company completed an initial mineral resource estimate for the Gryphon uranium deposit. When combined with the Phoenix deposit, the Wheeler
River project now contains an indicated resource of 70.2 million pounds U3O8 at a grade of 19.1% U3O8 and inferred resources totaling 44.1 million pounds U3O8 at a combined grade of 2.34% - establishing Wheeler River as one of the largest and highest grade undeveloped uranium projects in the Athabasca Basin region.
The following table summarizes the mineral resource estimate for the Wheeler River project by deposit and classification. Mineral resources for the
Phoenix deposit were last updated in 2014, to reflect the expansion of the deposit’s high-grade domain. As no drilling has been completed since 2014, the resource estimate for the Phoenix deposit remains current.
|
|
|
|
|
|
|
|
|
|
|
|
Wheeler River Property – Mineral Resource Estimates(1)(4)
|
| Deposit |
|
Category |
|
Tonnes |
|
Grade (% U3O8) |
|
Million Pounds U3O8 (100% Basis) |
|
Million Pounds U3O8 (Denison’s Share) |
| Gryphon(2) |
|
Inferred
|
|
834,000
|
|
2.3
|
|
43.0
|
|
25.8
|
| Phoenix(3) |
|
Indicated
|
|
166,000
|
|
19.1
|
|
70.2
|
|
42.1
|
|
Phoenix(3) |
|
Inferred |
|
9,000 |
|
5.8 |
|
1.1 |
|
0.7
|
| |
(1) |
CIM Definitions were followed for classification of mineral resources. |
|
| |
(2) |
Mineral resources for the Gryphon deposit are reported above a cut-off grade of 0.2% U3O8. The cut-off
grade is based on RPA assumptions and a price of US$50 per lb U3O8. |
|
| |
(3) |
Mineral resources for the Phoenix deposit are reported above a cut-off grade of 0.8% U3O8. The cut-off
grade is based on internal conceptual studies and a price of US$50 per lb U3O8. |
|
| |
(4) |
Numbers may not add due to rounding. |
The mineral resource estimate was completed by RPA Inc
(“RPA”), in accordance with National Instrument 43-101 (“NI 43-101”) and is available on Denison’s website and under Denison’s profile on SEDAR and EDGAR. For the Gryphon deposit, RPA used data collected from four
surface diamond drilling campaigns completed during the last two years. The mineral resource estimate for the Gryphon deposit was classified as inferred based on the drill hole spacing and apparent continuity of mineralization. Uranium grade data
for Gryphon is comprised entirely of chemical assays on half split drill core samples due to good core recovery. At Phoenix, approximately 23% of the holes had core recovery of less than 80% and therefore downhole gamma probe data was used to derive
equivalent radiometric grades for these holes, in accordance with industry accepted practices, as outlined in the Company’s Annual Information Form dated March 5, 2015 available on SEDAR.
11
|
|
|
|
|
|
MANAGEMENT’S DISCUSSION & ANALYSIS |
The following map shows the location of the Gryphon and Phoenix deposits on the Wheeler River property:
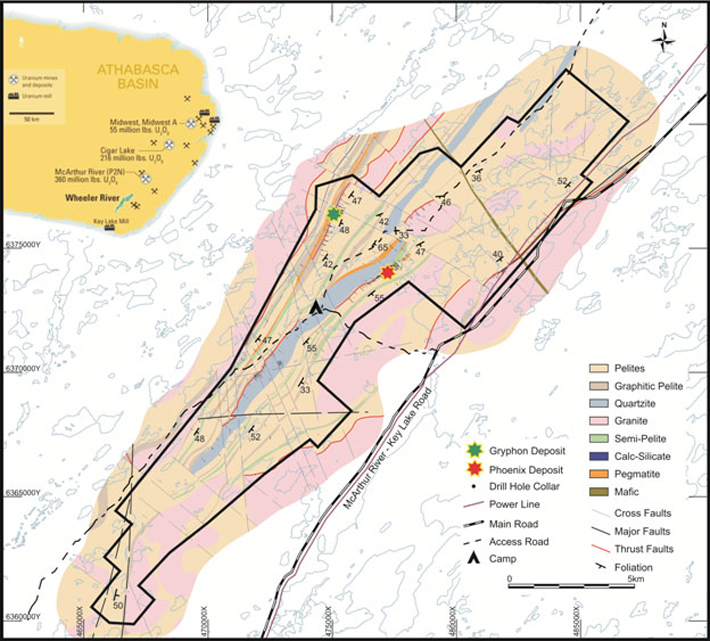
The Gryphon
Deposit is located approximately three kilometres northwest of the high grade Phoenix uranium deposit and was discovered in 2014. The highest grade intersection to date at Gryphon was returned from drill hole WR-573D1, which intersected 22.2% U3O8 over 2.5 metres.
Seven of the 12 drill holes completed during the winter 2015 program, targeting extensions of Gryphon, intersected significant uranium
mineralization. As a result, the zone was extended up-plunge, down-plunge, and up-dip on two sections. Following up on the success from the winter program, seven drill holes completed during the summer 2015 program were designed to
complete a 50 metre x 50 metre spaced drill pattern at Gryphon and outline the extent of the mineralization in the down-dip and down-plunge directions. The best result was in drill hole WR-604, which intersected 6.3% U3O8 over 5.5 metres (779.0 to 784.5 metres), followed by 11.6% U3O8 over 1.0 metres (790.0 to 791.0 metres) - extending the previously
identified zone of mineralization approximately 50 metres in the down-dip direction.
Mineralization at Gryphon occurs 720 metres below surface and
is centered approximately 220 metres below the sub-Athabasca unconformity. At its highest point it is within 80 metres of the unconformity and it is 370 metres below the
12
|
|
|
|
|
|
MANAGEMENT’S DISCUSSION & ANALYSIS |
unconformity at its deepest point. The deposit consists of a set of parallel, stacked, elongate lenses that are broadly conformable with the basement geology and associated with a
significant fault that separates a thin unit of quartzite from an overlying graphitic pelite. The lenses dip moderately to the southeast and plunge moderately to the northeast. The deposit is approximately 450 metres long in the plunge
direction, and 80 metres wide across the plunge. Thickness is variable and is a function of the number of stacked lenses present, generally varying between two and 20 metres.
|
|
|
|
|
|
|
|
|
|
|
|
2015 Assay Highlights from the Gryphon
Deposit(1) |
| Hole Number |
|
Location |
|
From
(m) |
|
To
(m) |
|
Length
(m) |
|
U3O8
(%) |
|
WR-571D2(2) |
|
Up-Dip |
|
512.0 |
|
517.5 |
|
5.5 |
|
3.9 |
| |
|
|
|
|
|
| and
|
|
Up-Dip
|
|
544.0 |
|
545.5 |
|
1.5 |
|
5.0 |
|
WR-574D1(2)
|
|
Up-Dip |
|
510.0
|
|
511.0
|
|
1.0
|
|
8.1
|
|
WR-582 |
|
Down-plunge
|
|
763.5 |
|
766.5 |
|
3.0 |
|
3.8 |
|
WR-583 |
|
Down-plunge |
|
786.1 |
|
788.1 |
|
2.0 |
|
3.7 |
|
WR-583D2(2)
|
|
Down-plunge
|
|
509.0 |
|
510.0 |
|
1.0 |
|
3.6 |
|
WR-584B |
|
Up-plunge
|
|
641.6 |
|
646.1 |
|
4.5 |
|
7.9 |
|
WR-604 |
|
Down-Dip |
|
779.0 |
|
784.5 |
|
5.5 |
|
6.3 |
| |
|
|
|
|
|
| and
|
|
Down-Dip
|
|
790.0 |
|
791.0 |
|
1.0 |
|
11.6 |
|
WR-606D1(2)
|
|
Down-Dip
|
|
534.5 |
|
536.0 |
|
1.5 |
|
2.5 |
|
WR-624 |
|
Up-Dip
|
|
682.5
|
|
683.5
|
|
1.0
|
|
3.8
|
|
(1) As the drill holes are angled steeply to the northwest and the basement mineralization is
interpreted to dip moderately to the southeast, the true thickness of the basement mineralization is expected to be approximately 75% of the intersection lengths.
(2) Distances are measured from a wedge, not from surface. |
| ¡ |
|
Southwest of Gryphon on the K-North Trend |
During 2015, a total of 16 drill holes were completed up plunge and along the unconformity to the southwest of the Gryphon deposit, along the K-North
trend. The drilling was successful in identifying approximately 2.3 kilometres of mineralized strike. The mineralization occurs both at the unconformity and immediately below within the basement indicating potential further along the
unconformity and within the basement below. The best result to date, occurs at the unconformity, 800 metres to the south of Gryphon, with drill hole WR-597 intersecting 4.5% U3O8 over 4.5 metres. Mineralization in this zone straddles the unconformity, replacing the matrix of the basal sandstone or filling fractures in the underlying pelitic strata.
Assay highlights for 2015 from the area to the southwest of Gryphon along the K-North trend are provided in the Table below.
|
|
|
|
|
|
|
|
|
|
|
|
|
| |
|
2015 Assay Highlights from the area southwest of
Gryphon(1) |
| |
|
Hole
Number |
|
Mineralization |
|
From
(m) |
|
To
(m) |
|
Length
(m) |
|
U3O8
(%) |
|
|
WR-595
|
|
Unconformity |
|
526.2 |
|
527.7 |
|
1.5 |
|
0.5 |
|
|
WR-597
|
|
Unconformity
|
|
495.5 |
|
500.0 |
|
4.5 |
|
4.5 |
|
|
WR-612 |
|
Basement
|
|
529.5
|
|
532.0
|
|
2.5
|
|
2.4
|
|
|
(1) As the unconformity mineralization is horizontal, the true thickness is expected to be
approximately 90% of the intersection lengths. |
13
|
|
|
|
|
|
MANAGEMENT’S DISCUSSION & ANALYSIS |
Evaluation Program
During 2015, Denison’s share of evaluation costs at Wheeler River amounted to $241,000, compared to $nil in 2014, and were mainly related to the
internal evaluation, engineering field studies and ongoing work being done to prepare for the initiation of the PEA.
After the discovery of the
Gryphon Deposit in 2014, Denison initiated an internal economic evaluation of the Wheeler River property. The evaluation focused on the merits of co-developing the Gryphon deposit and Phoenix deposit. The evaluation considered the mining of basement
hosted mineralization at Gryphon first, followed by the development of the high grade unconformity Phoenix deposit and assumed processing of ore from Wheeler River at a regional mill (such as the McClean Lake mill). The internal evaluation supported
the decision to initiate a PEA during the second half of 2015. The PEA is currently underway and is expected to be completed during the first half of 2016.
As part of the PEA, Denison has initiated a set of metallurgical testwork to determine the preliminary leaching process, leach residue settling,
raffinate composition, and purity of yellow cake for the Gryphon mineralization.
During 2015, project evaluation activities also included
hydrogeological testing (i.e. packer tests) and geotechnical core logging. The downhole hydrogeological testing program was completed in conjunction with the 2015 exploration drilling program. These tests are designed to determine conductivity and
permeability of the ground for potential water movements. A total of 180 holes were tested for surface water elevations and 35 down hole tests (injection tests, rising head, recovery) were completed in the sandstone, unconformity and basement
geological zones. In addition a total of 800 metres of geotechnical core logging was completed on key areas in the sandstone, unconformity and basement zones. This information will be used in subsequent project evaluation work.
Exploration Pipeline Properties
During the 2015 exploration program, Denison carried out exploration and/or geophysical surveys on nine other properties, within its landholdings on the
eastern side of the Athabasca Basin. Work on these pipeline exploration projects continues to deliver encouraging results. Highlights include the following properties:
Murphy Lake
Murphy Lake is located approximately 30
kilometres northwest from Denison’s 22.5% owned McClean Lake mill and is contiguous with the northwest boundary of the Company’s Waterbury Lake property. Murphy Lake is a joint venture between Denison (68.85% interest) and Eros
Resources Inc. (“Eros”) (31.15% interest). The 2015 program at Murphy Lake was fully funded by Denison as a result of Eros’ choice to dilute its interest. Denison’s share of exploration costs amounted to $458,000 during 2015,
compared to $305,000 in 2014.
The first drill hole of the summer 2015 program intersected a new zone of uranium mineralization. Assays for drill
hole MP-15-03 returned 0.25% U3O8 over 6.0 metres (270.0 to 276.0 metres).
The mineralization at Murphy Lake is located at the sub-Athabasca unconformity and is associated with a zone of strong sandstone alteration including desilicification and clay over a hematite cap. Basement rocks immediately below the mineralization
consist of graphitic pelitic gneisses cut by faults. As the mineralization is interpreted to be horizontal and the drill holes are steeply inclined, the true thickness is expected to be at least 75% of the intersection length.
Three additional drill holes were completed in 2015 to follow up on the mineralization in drill hole MP-15-03. While none of the holes intersected
mineralization, all encountered significant structure and alteration, suggesting the presence of a highly prospective system.
Waterbury Lake
Waterbury Lake is host to the J Zone deposit, located within 20 kilometres of the McClean Lake mill and is a joint venture between Denison (61.55%
interest and operator) and the Korea Waterbury Uranium Limited Partnership (“KWULP”) (38.45% interest). The 2015 program at Waterbury Lake was fully funded by Denison as a result of KWULP’s decision to dilute its interest effective
September 30, 2015. Refer to RELATED PARTY TRANSACTIONS below for further details. Denison’s share of exploration costs amounted to $747,000 during 2015, compared to $704,000 in 2014.
Work was focused on the Oban target area. Ground geophysical surveys completed earlier in the year improved the geological interpretation of the area and
highlighted several drill targets that were tested during the summer drilling program. The best result was obtained from drill hole WL-425, which intersected 6.5 metres of elevated uranium from 239.5 to 246.0 metres, which included 0.3% U3O8 over 0.5 metres and 0.1%
U3O8 over 0.5 metres.
14
|
|
|
|
|
|
MANAGEMENT’S DISCUSSION & ANALYSIS |
Crawford Lake
Crawford Lake is located just west of Wheeler River, approximately 10 kilometres south of Cameco’s Millennium deposit in the southeast portion of
the Athabasca Basin, and is 100% owned by Denison. Exploration costs amounted to $2,370,000 during 2015, compared to $1,361,000 in 2014.
A large
zone of intense sandstone alteration along the CR-2 and CR-5 conductors was extended by the summer drilling program and has now been confirmed over a strike length of 2.9 kilometres. While no significant uranium mineralization was intersected in
2015, the volume and tenor of the alteration system is encouraging and remains a priority for future exploration activities.
Africa
Exploration expenses in Africa during 2015 were $818,000, compared to $913,000 in 2014. Exploration activity in 2015 was designed to
maintain the Company’s claims in good standing while advancing the exploration potential of its assets as part of a strategy to pursue a spin-out or sale transaction of the Company’s African portfolio when market conditions permit.
Zambia – Mutanga Project
The Mutanga project is owned
100% by the Company and consists of 2 contiguous mining licences totaling 47,115 hectares. The project is located in the Southern Province of Zambia, approximately 200 kilometres south of Lusaka and immediately north of Lake Kariba. Mutanga is
comprised of the Mutanga, Dibwe and Dibwe East deposits plus a number of exploration areas. The combined mineral resource estimate for the Mutanga, Dibwe, and Dibwe East deposits includes measured and indicated resources of 10,280,000 tonnes grading
0.034% U3O8 containing 7.8 million pounds of U3O8 and inferred resources of 65,200,000 tonnes grading 0.029% U3O8 containing 41.4
million pounds of U3O8. Uranium occurs in sandstones of the Escarpment Grit formation, part of the Upper Karoo Group.
Exploration expenditures at the Mutanga project during 2015 were $448,000 and included an excavator trenching program, a program of surficial
geochemistry and radon surveying. Results of the trenching and geochemistry programs identified new mineralization and have provided several drill-ready targets for future exploration. During 2014, exploration expenses were $559,000 and
were related to geological mapping, geochemical sampling and excavator trenching programs.
Mali – Falea Project
The Falea project is 100% owned by the Company and is located approximately 250 kilometres west of Bamako, near the Senegal and Guinea borders. The
project includes the Falea uranium-silver-copper deposit occurring within the Taoudeni Neoproterozoic Basin, which unconformably overlies older Birimian metasedimentary and metavolcanic rocks.
Exploration expenditures of $361,000 incurred during 2015 related to an airborne geophysical (VTEM) survey, soil sampling, scintillometer prospecting and
geological mapping. In February 2015, an application was made to renew the Falea exploration permit. The convention for a new permit was signed by the Minister of Mines in July 2015 and the exploration permit was issued during
the third quarter of 2015. During 2014, exploration expenditures amounted to $269,000 and were related to a field program consisting of geological mapping and surficial geochemistry surveys.
During 2015, an independent mineral resource estimate was completed for the Falea deposit. The resource estimate is summarized in the table below.
|
|
|
|
|
|
|
|
|
|
|
|
|
|
|
|
Falea Property – Mineral Resource Estimate |
| Category |
|
Tonnes
(Million tonnes) |
|
U3O8 (%) |
|
Cu (%) |
|
Ag
(Grams per
Tonne) |
|
U3O8
(Million
Pounds) |
|
Cu
(Million
Pounds) |
|
Ag
(Million
Ounces) |
| Indicated
|
|
6.88 |
|
0.115 |
|
0.161 |
|
72.8 |
|
17.4 |
|
24.4 |
|
16.11 |
|
Inferred |
|
8.78 |
|
0.069 |
|
0.200 |
|
17.3 |
|
13.4 |
|
38.7 |
|
4.90 |
15
|
|
|
|
|
|
MANAGEMENT’S DISCUSSION & ANALYSIS |
The mineralization is interpreted as an unconformity type uranium, silver and copper deposit, since it
is associated with the unconformity between the Taoudeni Basin and the underlying Birimian greenstones. The Falea deposit mineral resource estimate was completed by RPA in accordance with NI 43-101 and is available on Denison’s website.
Namibia – Dome Project
The Dome project is located in
the Erongo Region of Namibia, in the country’s uranium producing district, with excellent infrastructure nearby. The property hosts showings of both bedrock uranium mineralization in leucogranite and surficial uranium mineralization in
calcrete. Uranium in leucogranite is currently mined in the region at the Rössing mine and uranium in calcrete is currently mined at Langer Heinrich.
No significant exploration work was completed on the Dome project during 2015 and 2014. The exploration licences covering the project expired in
November 2015 and licence renewal applications were submitted by the Company in September 2015. The licence applications are currently under government review. The project is owned by the Company (90%) and Manica Minerals Limited
(10%).
GENERAL AND ADMINISTRATIVE EXPENSES
Total general
and administrative expenses were $6,463,000 during 2015, compared to $6,636,000 in 2014. These costs are mainly comprised of head office salaries and benefits, office costs in multiple regions, audit and regulatory costs, legal fees, investor
relations expenses, project costs and all other costs related to operating a public company with listings in Canada and the United States. The decrease in general and administrative expenses during 2015 was primarily a result of the favourable
fluctuation in foreign exchange rates applicable on the translation of Canadian dollar expenses, offset by a significant increase in project costs associated with numerous corporate development initiatives.
On July 27, 2015, Denison entered into an arrangement agreement with Fission Uranium Corp. (“Fission”), whereby Denison and Fission agreed
to combine their respective businesses by way of a court-approved plan of arrangement (the “Fission Arrangement”). While Denison’s shareholders strongly supported the Fission Arrangement, the required two-thirds approval was not
obtained from Fission shareholders by the proxy voting deadline. As a result, on October 13, 2015, the Fission Arrangement was terminated. The Company incurred project costs totaling $1,461,000 relating to the Fission Arrangement during 2015.
IMPAIRMENT – MINERAL PROPERTIES
During 2015, the
Company recognized an impairment of $25,164,000 against the value of its African mining segment, which included significant carrying values for the Falea, Mutanga and Dome projects. In line with communicated corporate objectives to focus the Company
on its core projects in the Athabasca Basin, the Company has decided to minimize or cease exploration activities in Africa for the upcoming fiscal year. As a result, the Company completed an impairment test on its African mining segment. Since the
recoverable amounts of the Company’s Falea, Dome and Mutanga projects were determined to be lower than their carrying values, the Company recognized an impairment loss during the year. The Company used a market-based fair value less costs of
disposal analysis, adjusted for certain unobservable inputs, to determine the recoverable amount of $3,264,000 for the Falea, Dome and Mutanga projects combined
The Company has also recognized impairment charges of $2,603,000, in 2015, to fully impair the carrying value of three of its Canadian exploration
properties. The impairment has been recognized as a result of the Company’s current intention to let the claims on these properties lapse in the normal course and to not carry out the required exploration programs or fund the deficiency
deposits needed to maintain the claims. The $nil recoverable amount of the properties is based on a market-based fair value less costs of disposal assessment using unobservable inputs including the Company’s data about the properties and
management’s interpretation of that data.
In 2014, the Company recognized mineral property impairment charges of $1,745,000, including
impairment charges of $1,658,000 associated with the Company’s release of one Canadian property and $87,000 associated with the Company’s surrender of its land holdings in Niger.
FOREIGN EXCHANGE INCOME AND EXPENSE
During 2015, a foreign
exchange loss of $16.0 million was recognized, compared with a $5.9 million loss in 2014. The increase during 2015 is due primarily to unfavourable fluctuations in foreign exchange rates impacting the revaluation of intercompany debt for the
Company’s African related operations.
16
|
|
|
|
|
|
MANAGEMENT’S DISCUSSION & ANALYSIS |
OTHER INCOME AND EXPENSES
The Company also recognized $346,000 in losses on investments carried at fair value during 2015, compared to $59,000 during 2014. During 2014, the
Company recognized a gain of $202,000 on the sale of land holdings related to the Way Lake and Yurchison Lake properties and recognized a gain on the receipt of a payment of $229,000 in accordance with an option agreement with SeqUr Exploration Inc.
(“SeqUr”) to earn up to a 60% interest in Denison’s Jasper Lake property. In February 2015, SeqUr terminated its option to earn an interest in the Jasper Lake property.
INCOME TAX RECOVERY AND EXPENSE
Income tax recovery in 2015
totaled $3,769,000, compared to an income tax recovery of $2,299,000 in 2014. The increase in the income tax recovery in 2015 was mainly due to a reduced deferred tax expense recognized on the renunciation of 2014 expenditures in 2015 as a result of
a higher flow-through share premium, as compared to the deferred tax expense recognized on the renunciation of 2013 expenditures in 2014. This was partly offset by the impact of the unfavourable exchange rate on the translation of Canadian
denominated deferred tax assets recognized in the year.
DISCONTINUED OPERATIONS – SALE OF MONGOLIAN MINING DIVISION
Sale of Mongolian Interests
In December 2015,
Denison announced the closing of the sale of its interest in the GSJV to Uranium Industry. The sale to Uranium Industry represented the culmination of Denison’s efforts to review strategic alternatives for the divesture of its interests in
Mongolia. Uranium Industry has unique experience in the geology, mining and processing of uranium, and is the successor to a 75 year tradition of uranium mining and environmental remediation of uranium mines in the Czech Republic. Uranium Industry
is also active in Mongolia and established the Mon Czech Uranium joint venture with Mon-Atom LLC on June 17, 2015.
Under the terms of the GSJV
Agreement, Denison received $1.25 million in initial payments during 2015, prior to the closing of the sale, and has the right to receive additional proceeds of up to $12.0 million, for total consideration of $13.25 million. The GSJV Agreement
provided for the sale of all of the shares of Denison Mines (Mongolia) Ltd. (“DMM”) to Uranium Industry. DMM holds an 85% interest in the GSJV, with Mon-Atom LLC holding the remaining 15% interest.
The additional proceeds, of up to $12 million, are payable to Denison as follows:
| |
● |
|
$5.0 million within 60 days of the issuance of a mining licence for an area covered by any of the exploration licences held by the GSJV (the “First
Project”); |
| |
● |
|
$5.0 million within 60 days of the issuance of a mining licence for an area covered by any of the other exploration licences held by the GSJV (the
“Second Project”); |
| |
● |
|
$1.0 million within 365 days following the production of an aggregate of 1,000 pounds U3O8 from the operation of the First Project; and |
| |
● |
|
$1.0 million within 365 days following the production of an aggregate of 1,000 pounds U3O8 from the operation of the Second Project. |
On December 2, 2015, Uranium
Industry submitted applications for mining licences for all four projects to the Mongolian government. On January 5, 2016, the Company received copies of mining application acknowledgement receipts issued by the Mongolian government, for all
four projects, as part of the completeness review component of the mining licence issuance process. Decisions whether or not to issue mining licences remain outstanding as at March 9, 2016.
The completion of the sale of the Company’s Mongolian interests represents a significant milestone for Denison, as the Company continues to deliver
on its objective of selling non-core international assets in order to focus on its core activities in the Athabasca Basin.
As a result of the sale,
the Company has presented the results of the Mongolia Mining Division as discontinued operations and, in accordance with IFRS 5, has revised its statement of comprehensive income (loss) to reflect this change in presentation. The consolidated
statements of financial position and the consolidated statement of cash flows have not been revised.
17
|
|
|
|
|
|
MANAGEMENT’S DISCUSSION & ANALYSIS |
The total estimated transaction costs incurred by Denison relating to the transaction for 2015 and 2014
amounted to $337,000 and $58,000, respectively.
Exploration Expenditures
During 2015, exploration expenditures on the GSJV properties totaled $384,000, compared to $394,000 in 2014. Expenditures in both periods were primarily
related to annual licence payments, required to maintain the GSJV properties in good standing, while the Company prepared for a sale of its interest in the GSJV.
General and Administrative Expenses
During 2015, general and
administrative expenses totaled $692,000, compared to $954,000 during 2014. These costs are mainly comprised of personnel costs, office expenses and legal fees. General and administrative expenses decreased in 2015 mainly due to lower personnel
costs as the Company focused on completing the sale of its ownership interest in the GSJV.
Foreign Exchange Income and Expense
During 2015, foreign exchange income was $2,873,000, compared to a foreign exchange expense of $2,090,000 during 2014. The increase in foreign exchange
income during 2015 is due primarily to favourable fluctuations in foreign exchange rates impacting the revaluation of intercompany debt for the Company’s Mongolia related operations.
Gain on sale of Mongolian Interests
The proceeds on the sale
of the Mongolia mining division includes cash consideration received of $1,250,000 less transaction costs of $337,000. The gain on the sale of $8,374,000 is mainly a result of the cumulative foreign currency gain translation adjustment of
$13,680,000 realized on the disposal of the Company’s Mongolian entities with the Mongolian Tugrik as its functional currency, partly offset by the carrying value of the Mongolian mineral properties of $6,130,000. The contingent consideration,
which is contingent on the approval of mining licenses and achievement of certain production thresholds, has been recognized at a fair value of $nil in the financial statements at this time and will be re-measured at each subsequent reporting date
until settlement.
LIQUIDITY AND CAPITAL RESOURCES
Cash and cash equivalents were $5,367,000 at December 31, 2015 compared with $18,640,000 at December 31, 2014. At December 31, 2015, the
company also held investments in GICs of $7,282,000, which are categorized as short term investments on the balance sheet. At December 31, 2014, the company held $4,381,000 in short term investments.
The decrease in cash and cash equivalents of $13,273,000 was due to net cash used in operations of $17,733,000, net cash used in investing activities of
$5,422,000 and a net foreign exchange loss of $2,123,000 on the translation of currency balances at period end, partly offset by net cash provided by financing activities of $12,005,000.
Net cash used in operating activities of $17,733,000 during 2015 is comprised of a net loss for the period adjusted for non-cash items and changes in
working capital items.
Net cash used in investing activities of $5,422,000 consists primarily of cash used to purchase debt instrument investments
(GICs) of $8,134,000 and acquire property, plant and equipment of $1,987,000, partly offset by cash provided by the maturity of investments in debt instruments (GICs) and the sale of investments in equity instruments totaling $4,033,000. Property,
plant and equipment expenditures include an additional 1.55% interest earned by the Company in the Waterbury Lake property, for an amount of $836,000. As at December 31, 2015, the Company holds an ownership interest of 61.55% in the Waterbury
Lake property. Refer to TRANSACTIONS WITH RELATED PARTIES for further details.
Net cash provided by financing activities of $12,005,000 largely
reflects net proceeds received on the issuance of flow-through common shares. On May 26, 2015, the Company closed a CAD$15 million private placement for the issuance of 12,000,000 common shares on a flow-through basis at a price of
CAD$1.25 per share. The proceeds will be used to fund the Company’s Canadian exploration programs through to the end of 2016. As at December 31, 2015, the Company has spent CAD$1,567,000 toward its obligation to spend CAD$15 million on
eligible Canadian exploration
18
|
|
|
|
|
|
MANAGEMENT’S DISCUSSION & ANALYSIS |
expenses associated with this financing. Other financing activities included proceeds received from the issuance of common shares on the exercise of stock options and warrants for a total of
$411,000.
As at December 31, 2015, the Company has fulfilled its obligation to spend CAD$14,997,000 on eligible Canadian exploration expenses
under the flow-through share financing completed in August 2014.
The Company holds the large majority of its cash, cash equivalents, and
investments in Canadian dollars. As at December 31, 2015, the Company’s cash, cash equivalents and current investments amount to CAD$17.5 million.
Revolving Term Credit Facility
On January 27, 2016, the
Company entered into an agreement with the Bank of Nova Scotia to amend the terms of a revolving term credit facility entered into in 2015 and to extend the maturity date to January 31, 2017 (“2016 Credit Facility”). Under the amended
agreement, the Company has access to letters of credit of up to CAD$24,000,000. Use of the facility remains restricted to non-financial letters of credit in support of reclamation obligations.
The agreement contains a covenant to maintain a level of tangible net worth greater than or equal to the sum of $150,000,000 and a covenant to maintain a
minimum balance of cash and equivalents of CAD$5,000,000 on deposit with the Bank of Nova Scotia. As security for the amended facility, Denison has provided an unlimited full recourse guarantee and a pledge of all of the shares of Denison Mines
Inc. (“DMI”). DMI has provided a first-priority security interest in all present and future personal property and an assignment of its rights and interests under all material agreements relative to the McClean Lake and Midwest projects.
The 2016 Credit Facility is also subject to letter of credit and standby fees of 2.40% and 0.75%, respectively.
Going Concern Assumption
At December 31, 2015, the Company has sufficient liquidity on hand to fund its planned operations for the fiscal 2016 year. However, in the absence
of additional funding, the Company anticipates that it will become non-compliant with the minimum cash covenant requirement of its 2016 Credit Facility, which may cast substantial doubt upon the Company’s ability to realize its assets and
discharge its liabilities in the normal course of business, and accordingly, the appropriateness of the use of accounting principles applicable to a going concern. In order to both fund operations and maintain rights under existing agreements, the
Company must secure sufficient future funding. The Company is actively pursuing access to different sources of funding and while it has been successful in the past in obtaining financing for its activities, there is no assurance that it will be able
to obtain adequate financing in the future.
Contractual Obligations and Contingencies
The Company has the following contractual obligations at December 31, 2015:
|
|
|
|
|
|
|
|
|
|
|
|
|
|
|
|
|
|
|
|
|
| |
|
| (in thousands) |
|
Total |
|
|
1 Year |
|
|
2-3 Years |
|
|
4-5 Years |
|
|
After
5 Years |
|
| |
|
|
|
|
|
|
|
| Debt Obligations |
|
$ |
300 |
|
|
$ |
300 |
|
|
$ |
– |
|
|
$ |
– |
|
|
$ |
– |
|
| Operating Leases and other
commitments |
|
$ |
962 |
|
|
$ |
232 |
|
|
$ |
226 |
|
|
$ |
143 |
|
|
$ |
361 |
|
| |
|
Reclamation Sites
The
Company periodically reviews the anticipated costs of decommissioning and reclaiming its mill and mine sites as part of its environmental planning process. The Company’s reclamation liability, at December 31, 2015, is estimated to be
$19,460,000, which is expected to be sufficient to cover the projected future costs for reclamation of the Company’s mill and mine operations. There can be no assurance, however, that the ultimate cost of such reclamation obligations will not
exceed the estimated liability contained in the Company’s financial statements.
Elliot Lake – The Elliot Lake uranium mine
was closed in 1992 and capital works to decommission the site were completed in 1997. The remaining provision is for the estimated cost of monitoring the Tailings Management Areas at the Denison and Stanrock sites and for treatment of water
discharged from these areas. The Company conducts its activities at both sites pursuant to licences issued by the Canadian Nuclear Safety Commission (“CNSC”). In the fourth quarter of 2015, an adjustment of $2,262,000 was made to the
reclamation liability to reflect the Company’s best estimate of the present value of the total reclamation cost that will be required in the future. Spending on restoration activities at the Elliot Lake sites is funded from monies in the Elliot
Lake reclamation trust fund. At December 31, 2015,
19
|
|
|
|
|
|
MANAGEMENT’S DISCUSSION & ANALYSIS |
the amount of restricted cash and investments relating to the Elliot Lake Reclamation Trust fund was $2,040,000.
McClean Lake and Midwest – The McClean Lake and Midwest operations are subject to environmental regulations as set out by the
Saskatchewan government and the CNSC. Cost estimates of future decommissioning and reclamation activities are prepared every 5 years and filed with the applicable regulatory authorities for approval. A preliminary updated plan was submitted in
November 2014 and was reviewed by the applicable regulatory authorities. In November 2015, a revised plan was submitted based on comments received by the applicable regulatory authorities. As a result, an adjustment of $2,264,000 was made
in the fourth quarter of 2015 to the reclamation liability, to reflect the Company’s best estimate of its share of the present value of its total future reclamation cost that will be required in the future. Reclamation costs are expected
to be incurred between 2033 and 2056.
Under the Mineral Industry Environmental Protection Regulations, 1996, the Company is required to
provide its pro-rata share of financial assurances to the Province. The Company has in place irrevocable standby letters of credit from The Bank of Nova Scotia in favour of Saskatchewan’s Ministry of Environment, totaling CAD$9,698,000 which
relate to a previously filed reclamation plan. Under the revised plan submitted in November 2015, the Company expects to increase its pro-rata share of financial assurances to the Province to approximately CAD$23,990,000. See SUBEQUENT EVENTS
for further details.
Under the terms of a Potentially Reactive Waste Rock Disposal Agreement (“PRWR Agreement”) between the MLJV and the
CLJV, the MLJV agreed to deposit certain waste rock material from the Cigar Lake mine in its mined-out Sue C pit. In return, the CLJV has agreed to reimburse the MLJV for additional site restoration costs that may reasonably occur as a result. In
2014, triggered by the delivery of the first Cigar Lake ore to the McClean Lake mill, the CLJV made payments totaling CAD$4,332,000 to the MLJV under the terms of the PRWR Agreement. Denison received $883,000 (CAD$974,700), its proportionate share
of this total amount, and recorded the receipt as an addition to its reclamation liability. There were no similar payments received during 2015.
TRANSACTIONS WITH RELATED PARTIES
Uranium Participation Corporation
The Company is a party to a management services agreement with UPC. Under the terms of the current agreement, the Company was entitled to receive the
following fees from UPC in 2015: a) a commission of 1.5% of the gross value of any purchases or sales of uranium completed at the request of the Board of Directors of UPC; b) a minimum annual management fee of CAD$400,000 (plus reasonable
out-of-pocket expenses) plus an additional fee of 0.3% per annum based upon UPC’s net asset value in excess of CAD$100,000,000; and c) a fee, at the discretion of the Board of Directors of UPC, for on-going monitoring or work associated with a
transaction or arrangement (other than a financing, or the purchase or sale of uranium).
The current management services agreement expires on
March 31, 2016. A new three year agreement was entered into between UPC and the Company on March 4, 2016 and will take effect on April 1, 2016 (“Renewed UPC Agreement”). See SUBSEQUENT EVENTS for further details.
The following fees were received from UPC for the years ended:
|
|
|
|
|
|
|
|
|
| |
|
| (in thousands) |
|
Year Ended
December 31,
2015 |
|
|
Year Ended
December 31,
2014 |
|
| |
|
|
|
|
| Revenue |
|
|
|
|
|
|
|
|
| Management fees |
|
$ |
1,747 |
|
|
$ |
1,628 |
|
| Commissions |
|
|
75 |
|
|
|
553 |
|
| |
|
|
|
$ |
1,822 |
|
|
$ |
2,181 |
|
| |
|
At December 31, 2015, accounts receivable includes $157,000 (December 31, 2014: $123,000) due from UPC with respect
to the fees and transactions discussed above.
20
|
|
|
|
|
|
MANAGEMENT’S DISCUSSION & ANALYSIS |
Korea Electric Power Corporation (“KEPCO”)
In 2009, Denison entered into a strategic relationship agreement with its largest shareholder, KEPCO. Pursuant to the strategic relationship agreement,
KEPCO is entitled to subscribe for additional common shares in Denison’s future share offerings. The strategic relationship agreement also provides KEPCO with a right of first opportunity if Denison intends to sell any of its substantial
assets, a right to participate in certain purchases of substantial assets which Denison proposes to acquire and a right to nominate one director to Denison’s Board, so long as its share interest in Denison is above 5.0%.
As at December 31, 2015, KEPCO holds 58,284,000 shares of Denison representing a share interest of 11.2%.
Prior to September 30, 2015, Denison held a 60% interest in Waterbury Lake Uranium Corporation (“WLUC”) and Waterbury Lake Uranium Limited
Partnership (“WLULP”), entities whose principal asset is the Waterbury Lake property. The other remaining interest in these entities is held by KWULP, a consortium of investors, of which KEPCO is the primary holder. When a spending program
is approved by the participants, each participant is required to fund these entities based upon its respective ownership interest. Spending program approval requires 75% of the voting interest.
In January 2014, Denison agreed to allow KWULP to defer its funding obligations to WLUC and WLULP until September 30, 2015 and to not be
diluted as per the dilution provisions in the relevant agreements, in exchange for allowing Denison to authorize spending programs up to CAD$10,000,000 without obtaining the approval of 75% of the voting interest. At December 31, 2014,
KWULP had a funding obligation to WLUC and WLULP of CAD$802,000 and Denison recorded $415,000 (CAD$481,000) as its proportionate share in trade and other receivables.
On September 30, 2015, KWULP notified Denison that it elected to dilute its interest in the Waterbury Lake project and that it would not fund its
deferred funding obligation to WLUC and WLULP. As a result, Denison’ interest in the Waterbury Lake project increased by an additional 1.55% and Denison is able to continue authorizing the funding programs up to CAD$10,000,000 without obtaining
the approval of 75% of the voting interest up to September 30, 2016. The additional interest of 1.55% in Waterbury Lake has been accounted for using an effective date of September 30, 2015 and has resulted in Denison recording its
increased pro-rata share of the net assets of Waterbury Lake, the majority of which results in an addition to mineral property assets of $836,000.
Other
All services and transactions with the following related parties listed below were made on terms equivalent to those that prevail with arm’s length
transactions:
| ● |
|
Investor relations, administrative service fees and other expenses of $159,000 were incurred during 2015 (2014: $60,000) with Namdo Management Services Ltd,
which shares a common director with Denison. These services were incurred in the normal course of operating a public company. At December 31, 2015, an amount of $nil (December 31, 2014: $nil) was due to this company.
|
| ● |
|
Legal fees of $548,000 were incurred during 2015 (2014: $276,000) with Cassels Brock & Blackwell, LLP, a law firm of which a former member of
Denison’s Board of Directors is a partner. In the current year, the services and associated costs are mainly related to the Fission Arrangement. In the prior year, the services and associated costs were mainly related to the acquisition of
International Enexco Ltd. and the Company’s internal reorganization of its interests to consolidate its African holdings. At December 31, 2015, an amount of $12,000 (December 31, 2014: $1,000) was due to the law firm.
|
| ● |
|
Executive services of $106,000 were provided by the Company during 2014 to Lundin Gold Inc., which shares common directors with Denison. The services
were mainly related to management consulting services in respect to general and corporate matters. At December 31, 2014, an amount of $44,000 was due to Denison and was paid during 2015. No similar services were provided during 2015.
|
COMPENSATION OF KEY MANAGEMENT PERSONNEL
Key management personnel are those persons having authority and responsibility for planning, directing and controlling the activities of the Company,
directly or indirectly. Key management personnel include the Company’s executive officers, vice-presidents and members of its Board of Directors.
21
|
|
|
|
|
|
MANAGEMENT’S DISCUSSION & ANALYSIS |
The following compensation was awarded to key management personnel:
|
|
|
|
|
|
|
|
|
| |
|
| (in thousands) |
|
December 31,
2015 |
|
|
December 31,
2014 |
|
| |
|
|
|
|
| Salaries and short-term employee benefits |
|
$ |
1,391 |
|
|
$ |
1,633 |
|
| Share-based compensation |
|
|
370 |
|
|
|
516 |
|
| Termination benefits |
|
|
314 |
|
|
|
158 |
|
| |
|
|
|
$ |
2,075 |
|
|
$ |
2,307 |
|
| |
|
CORPORATE UPDATE
During November 2015, Mr. John Craig resigned from the Board of Directors and Steve Blower resigned from his position with the Company as Vice
President, Exploration.
On January 1, 2016, Denison appointed Mr. Dale Verran to the position of Vice President, Exploration. Prior to this
appointment, Mr. Verran served as Denison’s Technical Director, Exploration.
In January 2015, Mr. Tae Hwan Kim, KEPCO’s
representative on Denison’s Board of Directors, resigned and was replaced by Mr. Joo Soo Park. In February 2016, Mr. Joo Soo Park resigned and was replaced by Mr. Hyung Mun Bae.
FINANCIAL INSTRUMENTS
|
|
|
|
|
|
|
|
|
|
|
|
|
| |
|
| (in thousands) |
|
Financial
Instrument Category (1) |
|
Fair Value
Hierarchy |
|
December 31,
2015
Fair Value |
|
|
December 31,
2014
Fair Value |
|
| |
|
|
|
|
|
|
| Financial Assets: |
|
|
|
|
|
|
|
|
|
|
|
|
| Cash and equivalents |
|
Category D |
|
|
|
$ |
5,367 |
|
|
$ |
18,640 |
|
| Trade and other |
|
Category D |
|
|
|
|
4,826 |
|
|
|
9,411 |
|
| Contingent consideration |
|
Category A |
|
Level 3 |
|
|
- |
|
|
|
- |
|
| Investments |
|
|
|
|
|
|
|
|
|
|
|
|
| Equity instruments |
|
Category A |
|
Level 1 |
|
|
460 |
|
|
|
916 |
|
| Equity instruments |
|
Category A |
|
Level 2 |
|
|
24 |
|
|
|
16 |
|
| Equity instruments |
|
Category B |
|
Level 1 |
|
|
12 |
|
|
|
22 |
|
| Debt instruments |
|
Category A |
|
Level 1 |
|
|
7,282 |
|
|
|
4,381 |
|
| Restricted cash and equivalents |
|
|
|
|
|
|
|
|
|
|
|
|
| Elliot Lake reclamation trust fund |
|
Category C |
|
|
|
|
2,040 |
|
|
|
2,068 |
|
| |
|
|
|
|
|
|
|
$ |
20,011 |
|
|
$ |
35,454 |
|
| |
|
|
|
|
|
|
| Financial Liabilities: |
|
|
|
|
|
|
|
|
|
|
|
|
| Account payable and accrued liabilities |
|
Category E |
|
|
|
|
4,574 |
|
|
|
10,050 |
|
| Debt obligations |
|
Category E |
|
|
|
|
300 |
|
|
|
39 |
|
| |
|
|
|
|
|
|
|
$ |
4,874 |
|
|
$ |
10,089 |
|
| |
|
| (1) |
Financial instrument designations are as follows: Category A=Financial assets and liabilities at fair value through profit and loss; Category B=Available for
sale investments; Category C=Held to maturity investments; Category D=Loans and receivables; and Category E=Financial liabilities at amortized cost. |
The Company is exposed to credit risk and liquidity risk in relation to its financial instruments. Its credit risk in relation to its cash and
equivalents, debt instruments and restricted cash and equivalents is limited by dealing with credit worthy financial institutions. The Company’s trade and other receivables balance relates to a small number of customers who are credit worthy
and with whom the Company has established a relationship through its past dealings. The Contingent
22
|
|
|
|
|
|
MANAGEMENT’S DISCUSSION & ANALYSIS |
consideration presents the fair value of the payments receivable on the sale of the Mongolian Mining assets, which are contingent on the approval of mining licenses and achievement of production
thresholds.
Liquidity risk, in which the Company may encounter difficulties in meeting obligations associated with its financial liabilities as they
become due, is managed through the Company’s planning and budgeting process which determines the funds required to support the Company’s normal operating requirements on an ongoing basis. The Company ensures that there is sufficient
committed capital to meet its short-term business requirements, taking into account its anticipated cash flows from operations, its holdings of cash and equivalents and debt instruments and its access to credit facilities, if required. Refer to
Going Concern risk discussion in LIQUIDITY AND CAPITAL RESOURCES section above.
The Company’s investments that are designated as financial
assets at fair value through profit or loss have resulted in other expenses of $346,000 during 2015, compared to $59,000 during 2014.
The
Company’s investments designated as available for sale have resulted in unrealized gains recognized in accumulated other comprehensive income of $4,000 for 2015, compared to $8,000 for 2014. During 2014, impairments on these investments of
$22,000 were recorded in other expenses. There were no impairments recorded on these investments during 2015.
OFF-BALANCE SHEET
ARRANGEMENTS
The Company does not have any off-balance sheet arrangements.
SUBSEQUENT EVENTS
Sale of Mongolia Mining
Division – Update on Mining License Applications
On December 2, 2015, Uranium Industry submitted applications to the Mongolian
government for mining licenses for all four projects included as part of the Mongolian Mining Division sale. On January 5, 2016, the Company received copies of mining application acknowledgement receipts, for all four projects, as part of the
completeness review component of the mining license issuance process. As at March 9, 2016, the Mongolia government has not yet made any formal decision to issue mining licenses for the Mongolia projects.
Renewal of Management Services Agreement with UPC
The current
management services agreement expires on March 31, 2016. A new three year agreement was entered into between UPC and the Company and will take effect on April 1, 2016 (“New UPC Agreement”). Under the New UPC Agreement, Denison
will receive the following fees from UPC: a) a base fee of CAD$400,000 per annum, payable in equal quarterly installments; b) a variable fee equal to (i) 0.3% per annum of UPC’s total assets in excess of CAD$100,000,000 and up to and including
CAD$500,000,000, and (i) 0.2% per annum of UPC’s total assets in excess of CAD$500,000,000; c) a fee, at the discretion of the Board, for on-going monitoring or work associated with a transaction or arrangement (other than a financing, or the
acquisition of or sale of U3O8 or UF6); and d) a commission of 1.0% of the gross
value of any purchases or sales of U3O8 or UF6, or gross interest fees payable to
UPC in connection with any uranium loan arrangements.
McClean and Midwest Site Restoration Plans – Regulatory Update
At the end of February 2016, the Company received letter acceptance from the applicable regulatory authorities that its updated site restoration
plan for the McClean Lake and Midwest projects, submitted in January 2016, was approved. Under the approved plan, the Company is required to increase its financial assurance to Saskatchewan Environment from the current amount of
CAD$9,698,000 to CAD$24,134,000. It is anticipated that the increased financial assurance will be required to be provided during the second quarter of 2016.
23
|
|
|
|
|
|
MANAGEMENT’S DISCUSSION & ANALYSIS |
OUTSTANDING SHARE DATA
At March 9, 2016, there were 518,438,669 common shares issued and outstanding, stock options outstanding for 6,475,014 Denison common shares, and nil
warrants outstanding for a total of 524,913,683 common shares on a fully-diluted basis.
OUTLOOK FOR 2016
In 2016, the Company will focus on increasing its resource base in the Athabasca Basin and advancing the Wheeler River project, following the results of
the PEA currently in progress studying the co-development of the Gryphon and Phoenix deposits. The 2016 winter exploration program commenced in January with a focus on the Company’s Wheeler River project and other high priority properties
located in the infrastructure rich eastern Athabasca Basin.
|
|
|
|
|
|
(in thousands) |
|
|
2016 BUDGET
|
|
| Canada (1) |
|
|
|
|
| Toll Milling Revenue & Mineral
Sales |
|
$ |
5,440 |
|
| Development & Operations |
|
|
(2,400) |
|
|
Mineral Property Exploration & Evaluation |
|
|
(13,000) |
|
|
|
|
(9,960) |
|
| Africa |
|
|
|
|
|
Zambia, Mali and Namibia |
|
|
(1,290) |
|
|
|
|
(1,290) |
|
| Other (1) |
|
|
|
|
| UPC Management Services |
|
|
1,530 |
|
| DES Environmental Services |
|
|
920 |
|
|
Corporate Administration & Other |
|
|
(4,250) |
|
|
|
|
(1,800) |
|
|
|
|
|
|
|
Total |
|
$ |
(13,050) |
|
| (1) Budget figures have been converted
using a US$ to CAD$ exchange rate of 1.30. |
|
CANADA
Toll Milling Revenue & Mineral
Sales
The McClean Lake mill is operated by ARC and is currently licensed for annual production of 13 million pounds U3O8. ARC is engaged in the permitting process necessary to increase the licensed capacity of the mill up to 24 million pounds U3O8. The expansion of the McClean Lake mill from an annual production capacity of 13 million pounds U3O8 to 24 million pounds U3O8
is in progress and remains fully funded by the CLJV. Key construction milestones for 2016 will include the completion of the new solvent extraction circuit and the tailings neutralization circuit.
Provided regulatory approvals are secured to increase the annual licence limit, the McClean Lake mill is expected to produce 16 million pounds U3O8 during 2016. Production is expected to be 100% from Cigar Lake ore during the year. Denison’s share of revenue from toll milling of
the Cigar Lake ore and the sale of approximately 25,000 pounds U3O8, currently held by Denison in inventory, is budgeted to be $5.4
million (CAD$7.1 million).
Development & Operations
In 2016, Denison’s share of operating and capital expenditures at McClean Lake and Midwest are budgeted to be $1.6 million (CAD$2.1 million).
Operating expenditures include $797,000 (CAD$1.04 million) in respect of Denison’s share of the planned 2016 budget for the Surface Access Borehole Resource Extraction (“SABRE”) program. The SABRE program is operated by ARC, as part
of the McClean Lake joint venture, and has a total budget for 2016 of up to
24
|
|
|
|
|
|
MANAGEMENT’S DISCUSSION & ANALYSIS |
CAD$4.6 million. The 2016 SABRE program is expected to study the economic and technical potential associated with further design and process improvements targeted at increasing the rate of mine
production.
Reclamation expenditures at Elliot Lake are budgeted to be $665,000 (CAD$864,000).
Mineral Property Exploration & Evaluation
Denison expects
to operate and/or participate in a total of 15 exploration programs (including 13 drilling programs totaling approximately 75,000 metres), of which Wheeler River will continue to be the primary focus. The total budget for all of these programs,
inclusive of the evaluation work planned for Wheeler River, is budgeted to be CAD$24.6 million (Denison’s share, CAD$16.9 million).
Wheeler River –
Exploration
A total of 47,000 metres of exploration drilling is planned at Wheeler River between the winter and summer drill programs, along
with geophysical surveys at a total cost of CAD$10.0 million (Denison’s share, CAD$6.0 million).
Gryphon Regional Targets
Activities in 2016 will focus on numerous unconformity and basement targets in the vicinity of the Gryphon deposit, termed Gryphon Regional Targets.
Recent exploration results have continued to return mineralization in the area surrounding the Gryphon deposit and along the K-North trend, which hosts the Gryphon deposit. The results in this area continue to suggest that the entire K-North trend
has the potential to host additional zones of significant basement and unconformity mineralization related to the Gryphon deposit. The K-North trend includes approximately 6 kilometres of prospective strike, primarily to the south of the Gryphon
deposit.
In February 2016, the Company announced the discovery of a new high-grade uranium intersection near the Gryphon deposit. Drill hole
WR-633D1, located approximately 100 metres north of the Gryphon deposit, intersected approximately 11 metres of high-grade basement-hosted uranium mineralization including intervals of 5.7%
eU3O8 over 1.0 metre and 6.3%
eU3O8 over 1.7 metres. The drill hole was designed to test for further basement-hosted mineralization immediately north of the
Gryphon deposit and down plunge of previous mineralized intercepts. The high-grade mineralization occurs within altered pelitic gneisses and pegmatite that both occur within the Basal Pegmatite Unit and represents the best intersection to date
in this unit, which has undergone little previous drill testing. The mineralization is open in all directions and will be prioritized for follow-up this winter.
Details of the high-grade uranium intersection are provided in the table below.
|
|
|
|
|
|
|
|
|
|
High-Grade Intersection North of Gryphon
|
| Hole Number |
|
From
(m) |
|
To
(m)
|
|
Length
(m) |
|
eU3O8(1)
(%)
|
|
WR-633D1(2)
|
|
751.5 |
|
754.7 |
|
3.2 |
|
2.0 |
|
(includes)(3)
|
|
753.6 |
|
754.6 |
|
1.0 |
|
5.7 |
|
(and)(2)
|
|
757.7 |
|
765.3 |
|
7.6 |
|
1.7 |
|
(includes)(3)
|
|
760.3 |
|
762.0 |
|
1.7 |
|
6.3 |
|
(includes)(3)
|
|
764.2 |
|
765.2 |
|
1.0 |
|
1.2 |
| |
1. |
eU3O8 is radiometric equivalent uranium from a total gamma down-hole probe. |
| |
2. |
Intersection interval is composited above a cut-off grade of 0.1% eU3O8. |
| |
3. |
Intersection interval is composited above a cut-off grade of 1.0% eU3O8. |
| |
4. |
As the drill hole is oriented steeply toward the northwest and the basement mineralization dips moderately to the southeast, the true thickness of the mineralization is expected to be approximately 75% of the
intersection lengths. |
|
25
|
|
|
|
|
|
MANAGEMENT’S DISCUSSION & ANALYSIS |
The cross-section in the figure below represents section line 5187GP and illustrates the new
mineralization discovered in drill hole WR-633D1, which occurs to the north of the Gryphon deposit.
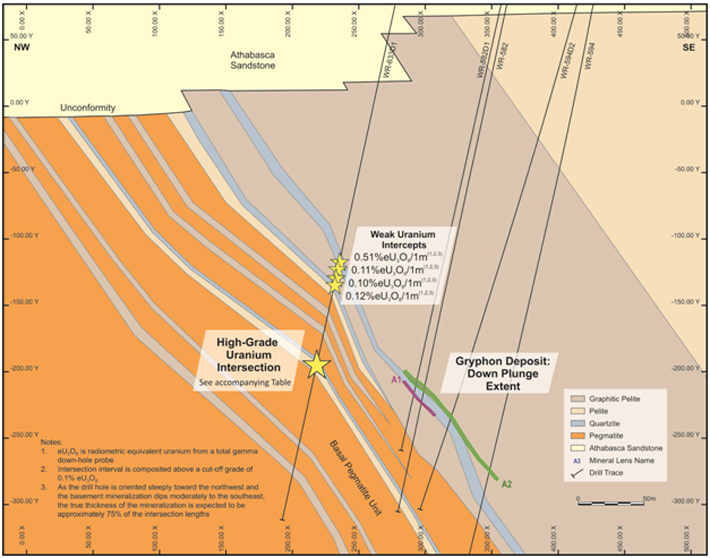
Wheeler Regional Targets
In addition, 2016 drilling may test other priority target areas on the property outside of the Phoenix and Gryphon areas, including the Q Central and O
Zone target areas.
Wheeler River - Evaluation
Activities in 2016 include the completion of a PEA studying the economic potential of co-developing the Gryphon and Phoenix deposits, which is expected
to be completed during the first half of 2016. Subject to a positive outcome from the PEA, the Company has developed a plan to initiate work on a Prefeasibility Study and environmental assessment work with an approximate budget for 2016 of CAD$2.6
million (Denison’s share, CAD$1.6 million).
Other High Priority Properties - Exploration
Other high priority properties include the Murphy Lake, Crawford Lake and Waterbury Lake properties. At Murphy Lake, a winter drill program of
approximately 10 holes (3,400 metres) is planned to follow-up on the discovery of the new zone of uranium mineralization at the sub-Athabasca unconformity. Drilling programs for Waterbury Lake and Crawford Lake in 2016 are planned to involve 2,500
metres and 4,400 metres, respectively. In addition, geochemical surveying, ground geophysical surveying and drilling (approximately 8,000 metres) are expected to be carried out on other properties operated by Denison where exploration is
warranted.
26
|
|
|
|
|
|
MANAGEMENT’S DISCUSSION & ANALYSIS |
Drill programs are also planned in 2016 for Denison’s non-operated joint venture projects,
including Mann Lake (2,000 metres), Wolly (5,000 metres) and McClean Lake (2,500 metres). The Mann Lake project is operated by Cameco, and the Wolly and McClean Lake projects are operated by ARC.
AFRICA
In Africa, Denison continues to maintain its interests
in Zambia, Mali and Namibia in preparation for a potential spin-out or sale transaction of its African portfolio when market conditions permit. Activities currently planned for 2016 in Africa are designed to keep the Company’s interests in good
standing and continuation of community programs. The 2016 budget for Africa is expected to be between $750,000 and $1.3 million.
MANAGEMENT AND ENVIRONMENTAL
SERVICES
Net management fees earned during 2016 from UPC are budgeted at $1.5 million (CAD$1.95 million).
Revenue from operations at DES during 2016 is budgeted to be $7.2 million (CAD$9.4 million) and operating and overhead expenses are budgeted to be $6.1 million (CAD$7.9
million). Capital expenditures at DES are budgeted to be $230,000 (CAD$300,000).
CORPORATE ADMINISTRATION AND OTHER
Corporate administration expenses are budgeted to be $3.85 million (CAD$5.0 million) in 2016 and include all head office salaries and benefits, office
costs, audit and regulatory costs, legal fees, investor relations expenses and all other costs related to operating a public company with listings in Canada and the United States.
Letter of credit and standby fees relating to the 2016 Credit Facility are budgeted to be $400,000 (CAD$520,000).
ADDITIONAL INFORMATION
CONTROLS AND PROCEDURES
The
Company carried out an evaluation, under the supervision and with the participation of its management, including the President and Chief Executive Officer and the Vice-President Finance and Chief Financial Officer, of the effectiveness of the design
and operation of the Company’s “disclosure controls and procedures” (as defined in the Exchange Act Rule 13a-15(e)) as of the end of the period covered by this report. Based upon that evaluation, the President and Chief Executive
Officer and the Vice-President Finance and Chief Financial Officer concluded that the Company’s disclosure controls and procedures are effective as of December 31, 2015.
The Company’s management is responsible for establishing and maintaining an adequate system of internal control over financial reporting. Management
conducted an evaluation of the effectiveness of internal control over financial reporting based on the Internal Control – Integrated Framework, 2013 issued by the Committee of Sponsoring Organizations of the Treadway Commission. Based on
this evaluation, management concluded that the Company’s internal control over financial reporting was effective as of December 31, 2015.
There has not been any change in the Company’s internal control over financial reporting that occurred during 2015 year that has materially
affected, or is reasonably likely to materially affect, the Company’s internal control over financial reporting.
CRITICAL ACCOUNTING
ESTIMATES AND JUDGEMENTS
The preparation of consolidated financial statements in accordance with IFRS requires the use of certain
critical accounting estimates and judgements that affect the amounts reported. It also requires management to exercise judgement in applying the Company’s accounting policies. These judgements and estimates are based on management’s best
knowledge of the relevant facts and circumstances taking into account previous experience. Although the Company regularly reviews the estimates and judgements made that affect these financial statements, actual results may be materially different.
27
|
|
|
|
|
|
MANAGEMENT’S DISCUSSION & ANALYSIS |
Significant estimates and judgements made by management relate to:
| (a) |
Going Concern Assumption |
The consolidated financial statements have been prepared using IFRS, as issued by the IASB, on a going concern basis, which assumes that the Company will
be able to meet its obligations and continue its operations for the next twelve months.
At December 31, 2015, the Company has sufficient
liquidity on hand to fund its planned operations for the fiscal 2016 year. However, in the absence of additional funding, the Company anticipates that it will become non-compliant with the minimum cash covenant requirement of its letters of credit
facility in 2016 which may cast significant doubt upon the Company’s ability to realize its assets and discharge its liabilities in the normal course of business, and accordingly, the appropriateness of the use of accounting principles
applicable to a going concern. In order to both fund operations and maintain rights under existing agreements, the Company must secure sufficient future funding. The Company is actively pursuing access to different sources of funding and while it
has been successful in the past in obtaining financing for its activities, there is no assurance that it will be able to obtain adequate financing in the future.
The financial statements do not reflect the adjustments to the carrying values of assets and liabilities and the reported expenses and balance sheet
classifications that would be necessary if the Company ceases to exist as a going concern in the normal course of operations. Such adjustments could be material.
| (b) |
Determination of a Mineral Property being Sufficiently Advanced |
The Company follows a policy of capitalizing non-exploration related expenditures on properties it considers to be sufficiently advanced. Once a
mineral property is determined to be sufficiently advanced, that determination is irrevocable and the capitalization policy continues to apply over the life of the property. In determining whether or not a mineral property is sufficiently
advanced, management considers a number of factors including, but not limited to: current uranium market conditions, the quality of resources identified, access to the resource, the suitability of the resource to current mining methods, ease of
permitting, confidence in the jurisdiction in which the resource is located and milling complexity.
Many of these factors are subject to risks and
uncertainties that can support a “sufficiently advanced” determination as at one point in time but not support it at another. The final determination requires significant judgment on the part of the Company’s management and directly
impacts the carrying value of the Company’s mineral properties.
| (c) |
Mineral Property Impairment Reviews and Impairment Adjustments |
Mineral properties are tested for impairment when events or changes in circumstances indicate that the carrying amount may not be recoverable. When
an indicator is identified, the Company determines the recoverable amount of the property, which is the higher of an asset’s fair value less costs of disposal and value in use. An impairment loss is recognized if the carrying value exceeds the
recoverable amount. The recoverable amount of a mineral property may be determined by reference to estimated future operating results and discounted net cash flows, current market valuations of similar properties or a combination of the above. In
undertaking this review, management of the Company is required to make significant estimates of, amongst other things: reserve and resource amounts, future production and sale volumes, forecast commodity prices, future operating, capital and
reclamation costs to the end of the mine’s life and current market valuations from observable market data which may not be directly comparable. These estimates are subject to various risks and uncertainties, which may ultimately have an effect
on the expected recoverable amount of a specific mineral property asset. Changes in these estimates could have a material impact on the carrying value of the mineral property amounts and the impairment losses recognized.
| (d) |
Deferred Tax Assets and Liabilities |
Deferred tax assets and liabilities are computed in respect of taxes that are based on taxable profit. Taxable profit will often differ from
accounting profit and management may need to exercise judgement to determine whether some taxes are income taxes (and subject to deferred tax accounting) or operating expenses.
Deferred tax assets and liabilities are measured using enacted or substantively enacted tax rates expected to apply when the temporary differences
between accounting carrying values and tax basis are expected to be recovered or settled. The determination of the ability of the Company to utilize tax loss carry forwards to offset deferred tax liabilities requires management to exercise judgment
and make certain assumptions about the future performance of the Company. Management is required to assess whether it is “probable” that the Company will benefit from these prior
28
|
|
|
|
|
|
MANAGEMENT’S DISCUSSION & ANALYSIS |
losses and other deferred tax assets. Changes in economic conditions, commodity prices and other factors could result in revisions to the estimates of the benefits to be realized or the
timing of utilizing the losses.
| (e) |
Reclamation Obligations |
Asset retirement obligations are recorded as a liability when the asset is initially constructed or a constructive or legal obligation exists and
typically involve identifying costs to be incurred in the future and discounting them to the present using an appropriate discount rate for the liability. The determination of future costs involves a number of estimates relating to timing, type of
costs, mine closure plans, and review of potential methods and technical advancements. Furthermore, due to uncertainties concerning environmental remediation, the ultimate cost of the Company’s decommissioning liability could differ materially
from amounts provided. The estimate of the Company’s obligation is subject to change due to amendments to applicable laws and regulations and as new information concerning the Company’s operations becomes available. The Company is not able
to determine the impact on its financial position, if any, of environmental laws and regulations that may be enacted in the future.
| (f) |
Contingent Consideration |
The fair value of contingent consideration is remeasured at each reporting period. The determination of fair value requires judgement in estimating
the likely outcome of the components of the contingent consideration, including but not limited to the likelihood of approval of mining licenses and the achievement of production thresholds, based on information available to management.
NEW ACCOUNTING PRONOUNCEMENTS
Accounting
Standards Issued But Not Yet Applied
The Company has not yet adopted the following new accounting pronouncements which are effective for fiscal
periods of the Company beginning on or after January 1, 2016:
International Financial Reporting Standard 9, Financial Instruments (“IFRS 9”)
In July 2014, the IASB published the final version of IFRS 9 Financial Instruments (“IFRS 9”), which brings together the
classification, measurement, impairment and hedge accounting phases of the IASB’s project to replace IAS 39 Financial Instruments: Recognition and Measurement. IFRS 9 replaces the multiple classifications for financial assets in IAS 39 with a
single principle based approach for determining the classification of financial assets based on how an entity manages its financial instruments in the context of its business model and the contractual cash flow characteristics of the financial
assets. The new standard also requires a single impairment method to be used, replacing the multiple impairment methods in IAS 39. The final version of IFRS 9 is effective for periods beginning on or after January 1, 2018; however, it is
available for early adoption.
International Financial Reporting Standard 15, Revenue from Contracts with Customers (“IFRS 15”)
IFRS 15 deals with revenue recognition and establishes principles for reporting useful information to users of financial statements about the nature,
amount, timing and uncertainty of revenue and cash flows arising from an entity’s contracts with customers. Revenue is recognized when a customer obtains control of a good or service. The standard replaces IAS 18 “Revenue” and IAS 11
“Construction Contracts” and related interpretations. The standard is effective for annual periods beginning on or after January 1, 2018 and earlier application is permitted.
International Financial Reporting Standard 16, Leases (“IFRS 16”)
In January 2016, the IASB issued IFRS 16 which replaces existing standards and interpretations under IAS 17 “Leases”. IFRS 16 requires all
leases, including financing and operating leases, to be reported on the balance sheet with the intent of providing greater transparency on a company’s lease assets and liabilities. IFRS 16 is effective for annual periods beginning on or after
January 1, 2019 with early adoption permitted.
The Company has not evaluated the impact of adopting these standards.
29
|
|
|
|
|
|
MANAGEMENT’S DISCUSSION & ANALYSIS |
RISK FACTORS
There are a number of factors that could negatively affect Denison’s business and the value of Denison’s common shares, including the factors
listed below. The following information pertains to the outlook and conditions currently known to Denison that could have a material impact on the financial condition of Denison. Other factors may arise in the future that are currently not foreseen
by management of Denison that may present additional risks in the future. Current and prospective security holders of Denison should carefully consider these risk factors.
Nature of Exploration and Development
Exploration for
and development of mineral properties is speculative, and involves significant uncertainties and financial risks that even a combination of careful evaluation, experience and knowledge may not eliminate. While the discovery of an ore body may
result in substantial rewards, few properties which are explored are commercially mineable or ultimately developed into producing mines. Major expenses may be required to establish mineral reserves by drilling, constructing mining and
processing facilities at a site, developing metallurgical processes and extracting uranium from ore. It is impossible to ensure that the current exploration and development programs of Denison will result in profitable commercial mining
operations.
Denison’s current and future uranium production is dependent in part on the successful development of new ore bodies and/or
expansion of existing mining operations. The economic feasibility of development projects is based upon many factors, including, among others: the accuracy of mineral reserve and resource estimates; metallurgical recoveries; capital and operating
costs of such projects; government regulations relating to prices, taxes, royalties, infrastructure, land tenure, land use, importing and exporting, and environmental protection; and uranium prices, which are historically cyclical. Development
projects are also subject to the successful completion of engineering studies, issuance of necessary governmental permits and availability of adequate financing.
Development projects have no operating history upon which to base estimates of future cash flow. Denison’s estimates of mineral reserves and
resources and cash operating costs are, to a large extent, based upon detailed geological and engineering analysis. Denison also conducts economic analyses and feasibility studies which derive estimates of capital and operating costs based upon many
factors, including, among others: anticipated tonnage and grades of ore to be mined and processed; the configuration of the ore body; ground and mining conditions; expected recovery rates of the uranium from the ore; and alternate mining methods.
The results of economic analyses for Denison’s projects would be preliminary in nature as they would include an inferred mineral resource which
is considered too speculative geologically to have the economic considerations applied that would enable them to be categorized as mineral reserves. There is no certainty that any forecasts in an economic analysis, including the planned PEA for
Wheeler River, would be realizable or that any resources would ever be upgraded to reserves. Mineral resources that are not mineral reserves do not have demonstrated economic viability.
It is possible that actual costs and economic returns of current and new mining operations may differ materially from Denison’s best estimates. It
is not unusual in the mining industry for new mining operations to experience unexpected problems during the start-up phase, take much longer than originally anticipated to bring into a producing phase, and to require more capital than anticipated.
Benefits Not Realized From Transactions
Denison
has completed a number of transactions over the last several years, including without limitation the acquisition of International Enexco Ltd, the acquisition of Rockgate Capital Corp., the acquisition of Fission Energy Corp., the acquisition of JNR
Resources Inc., the sale of the its mining assets and operations located in the United States to Energy Fuels Inc. and the sale of its interest in the GSJV. Despite Denison’s belief that these transactions, and others which may be completed in
the future, will be in Denison’s best interest and benefit the Company and Denison’s shareholders, Denison may not realize the anticipated benefits of such transactions or realize the full value of the consideration paid or received to
complete the transactions. This could result in significant accounting impairments or write-downs of the carrying values of mineral properties or other assets and could adversely impact the Company and the price of its common shares.
Inability to Expand and Replace Mineral Reserves and Resources
Denison’s mineral reserves and resources at its McClean Lake, Midwest, Wheeler River, Waterbury Lake, Falea and Mutanga projects are Denison’s
future sources of uranium concentrates. Unless other mineral reserves or resources are discovered, Denison’s sources of future production for uranium concentrates will decrease over time when its current mineral reserves and resources are
depleted. There can be no assurance that Denison’s future exploration,
30
|
|
|
|
|
|
MANAGEMENT’S DISCUSSION & ANALYSIS |
development and acquisition efforts will be successful in replenishing its mineral reserves and resources. In addition, while Denison believes that many of its properties will eventually be put
into production, there can be no assurance that they will be put into production or that they will be able to replace production in future years.
Imprecision
of Mineral Reserve and Resource Estimates
Mineral reserve and resource figures are estimates, and no assurances can be given that the
estimated levels of uranium will be produced or that Denison will receive the prices assumed in determining its mineral reserves and resources. Such estimates are expressions of judgment based on knowledge, mining experience, analysis of drilling
results and industry practices. Valid estimates made at a given time may significantly change when new information becomes available. While Denison believes that the mineral reserve and resource estimates included are well established and
reflect management’s best estimates, by their nature, mineral reserve and resource estimates are imprecise and depend, to a certain extent, upon statistical inferences which may ultimately prove unreliable. Furthermore, market price
fluctuations, as well as increased capital or production costs or reduced recovery rates, may render mineral reserves and resources containing lower quantities and lower grades of mineralization uneconomic, and may ultimately result in a restatement
of mineral reserves and resources. The evaluation of mineral reserves or resources is always influenced by economic and technological factors, which may change over time.
Volatility and Sensitivity to Market Prices
The long
and short term market prices of U3O8 affect the value of Denison’s mineral resources and the market price of Denison’s common
shares. Historically, these prices have fluctuated and have been and will continue to be affected by numerous factors beyond Denison’s control.
Such factors include, among others: demand for nuclear power, political and economic conditions in uranium producing and consuming countries, public and
political response to nuclear incidents, reprocessing of used reactor fuel and the re-enrichment of depleted uranium tails, sales of excess civilian and military inventories (including from the dismantling of nuclear weapons) by governments and
industry participants, uranium supplies from other secondary sources, and production levels and costs of production from primary uranium suppliers.
Public
Acceptance of Nuclear Energy and Competition from Other Energy Sources
Growth of the uranium and nuclear power industry will depend upon
continued and increased acceptance of nuclear technology as a means of generating electricity. Because of unique political, technological and environmental factors that affect the nuclear industry, including the risk of a nuclear incident, the
industry is subject to public opinion risks that could have an adverse impact on the demand for nuclear power and increase the regulation of the nuclear power industry. Nuclear energy competes with other sources of energy, including oil, natural
gas, coal and hydro-electricity. These other energy sources are, to some extent, interchangeable with nuclear energy, particularly over the longer term. Sustained lower prices of oil, natural gas, coal and hydroelectricity may result in lower
demand for uranium concentrates. Technical advancements in renewable and other alternate forms of energy, such as wind and solar power, could make these forms of energy more commercially viable and put additional pressure on the demand for
uranium concentrates.
Current estimates project significant increases in the world’s nuclear power generating capacities, primarily as a result
of a significant number of nuclear reactors that are under construction, planned, or proposed in China, India and various other countries around the world. Market projections for future demand for uranium are based on various assumptions regarding
the rate of construction and approval of new nuclear power plants, as well as continued public acceptance of nuclear energy around the world. The rationale for adopting nuclear energy can be varied, but often includes the clean and environmentally
friendly operation of nuclear power plants, as well as the affordability and round-the-clock reliability of nuclear power. A change in public sentiment regarding nuclear energy could have a material impact on the number of nuclear power plants under
construction, planned or proposed, which could have a material impact on the market’s and the Company’s expectations for the future demand for uranium and the future price of uranium.
Market Price of Shares
Securities of mining companies
have experienced substantial volatility in the past, often based on factors unrelated to the financial performance or prospects of the companies involved. These factors include macroeconomic conditions in North America and globally, and market
perceptions of the attractiveness of particular industries. The price of Denison’s securities is also likely to be significantly affected by short-term changes in commodity prices, other mineral prices, currency exchange fluctuation, or changes
in its financial condition or results of operations as reflected in its periodic earnings reports. Other factors unrelated to the performance of Denison that may have an effect on the price of the securities of Denison include the following: the
extent of analytical coverage available to investors concerning the
31
|
|
|
|
|
|
MANAGEMENT’S DISCUSSION & ANALYSIS |
business of Denison; lessening in trading volume and general market interest in Denison’s securities; the size of Denison’s public float and its inclusion in market indices may limit
the ability of some institutions to invest in Denison’s securities; and a substantial decline in the price of the securities of Denison that persists for a significant period of time could cause Denison’s securities to be delisted from an
exchange. If an active market for the securities of Denison does not continue, the liquidity of an investor’s investment may be limited and the price of the securities of the Company may decline, such that investors may lose their entire
investment in the Company. As a result of any of these factors, the market price of the securities of Denison at any given point in time may not accurately reflect the long-term value of Denison. Securities class-action litigation often has been
brought against companies following periods of volatility in the market price of their securities. Denison may in the future be the target of similar litigation. Securities litigation could result in substantial costs and damages and divert
management’s attention and resources.
Dilution from Further Equity Financing
If Denison raises additional funding by issuing additional equity securities, such financing may substantially dilute the interests of shareholders of
Denison and reduce the value of their investment.
Reliance on Other Operators
At some of its properties, Denison is not the operator and therefore is not in control of all of the activities and operations at the site. As a result,
Denison is and will be, to a certain extent, dependent on the operators for the nature and timing of activities related to these properties and may be unable to direct or control such activities.
As an example, ARC is the operator and majority owner of the McClean Lake and Midwest joint ventures in Saskatchewan, Canada. The McClean Lake mill
employs unionized workers who work under collective agreements. ARC, as the operator, is responsible for all dealings with unionized employees. ARC may not be successful in its attempts to renegotiate the collective agreements, which may impact mill
and mining operations. Similarly, ARC is responsible for all licensing and dealings with various regulatory authorities. Any lengthy work stoppages, or disruption to the operation of the mill or mining operations as a result of a licensing matter or
regulatory compliance may have a material adverse impact on the Company’s future cash flows, earnings, results of operations and financial condition.
Ore from the CLJV is currently being processed by the MLJV at the McClean Lake mill pursuant to a toll milling agreement, which is expected to generate
revenue for the Company for several years. Any delays or stoppages in the delivery of ores by the operator of the CLJV or in processing by the operator of the MLJV may have an adverse impact on the Company’s expected cash flows, earnings or
profit from toll milling.
Operations in Foreign Jurisdictions
The Company owns uranium properties directly and through joint venture interests and is undertaking uranium exploration and/or development programs in
Zambia, Mali and Namibia. As with any foreign operation, these international properties and interests are subject to certain risks, such as the possibility of adverse political and economic developments, foreign currency controls and fluctuations,
as well as risks of war and civil disturbances. Other events may limit or disrupt activities on these properties, restrict the movement of funds, result in a deprivation of contract rights or the taking of property or an interest therein by
nationalization or expropriation without fair compensation, increases in taxation or the placing of limits on repatriations of earnings. No assurance can be given that current policies of Zambia, Mali and Namibia, or the political situations within
these countries will not change so as to adversely affect the value or continued viability of the Company’s interest in these assets.
In
addition, the Company may become involved in a dispute with respect to one of its foreign operations and may become subject to the exclusive jurisdiction of a foreign court or may find that it is not successful in subjecting foreign persons to the
jurisdiction of the courts in Canada. The Company may also be precluded from enforcing its rights with respect to a government entity because of the doctrine of sovereign immunity.
Property Title Risk
The Company has investigated its
rights to explore and exploit all of its material properties and, to the best of its knowledge, those rights are in good standing. However, no assurance can be given that such rights will not be revoked, or significantly altered, to its detriment.
There can also be no assurance that the Company’s rights will not be challenged or impugned by third parties, including the local governments, and in Canada, by First Nations and Métis.
There is also a risk that Denison’s title to, or interest in, its properties may be subject to defects or challenges. This may be true particularly
in countries where there may be less developed legal systems or where ownership interests may become subject to political interference or changes in laws. If such defects cover a material portion of Denison’s
32
|
|
|
|
|
|
MANAGEMENT’S DISCUSSION & ANALYSIS |
property, they could materially and adversely affect Denison’s results of operations and financial condition, its reported mineral reserves and resources or its long term business prospects.
Competition for Properties
Significant
competition exists for the limited supply of mineral lands available for acquisition. Many participants in the mining business include large, established companies with long operating histories. The Company may be at a disadvantage in
acquiring new properties as competitors may have greater financial resources and more technical staff. Accordingly, there can be no assurance that the Company will be able to compete successfully to acquire new properties or that any such
acquired assets would yield reserves/resources or result in commercial mining operations.
Global Financial Conditions
Global financial conditions have been subject to volatility, with market impacts being felt as a result of China’s slowing growth, volatility and
instability in certain parts of Europe and general financial market turbulence. Access to public financing and credit have been negatively impacted by the effect of these events on Canadian and global credit markets. The health of global financing
and credit markets may impact the ability of Denison to obtain equity or debt financing in the future and the terms at which financing or credit is available to Denison. These increased levels of volatility and market turmoil could adversely impact
Denison’s operations and the trading price of the common shares.
Ability to Maintain Obligations under the 2016 Credit Facility and Other Debt
Denison is required to satisfy certain financial covenants in order to maintain its good standing under the 2016 Credit Facility. Denison
may from time to time enter into other arrangements to borrow money in order to fund its operations and expansion plans, and such arrangements may include covenants that have similar obligations or that restrict its business in some way. Events may
occur in the future, including events out of Denison’s control that would cause Denison to fail to satisfy its obligations under the 2016 Credit Facility or other debt instruments. In such circumstances, the amounts drawn under Denison’s
debt agreements may become due and payable before the agreed maturity date, and Denison may not have the financial resources to repay such amounts when due. The 2016 Credit Facility is secured by DMI’s main properties by a pledge of the shares
of DMI. If Denison were to default on its obligations under the 2016 Credit Facility or other secured debt instruments in the future, the lender(s) under such debt instruments could enforce their security and seize significant portions of
Denison’s assets. See CRITICAL ACCOUNTING ESTIMATES AND JUDGEMENTS – Going Concern Assumption above.
Capital Intensive Industry; Uncertainty of
Funding
The exploration and development of mineral properties and the ongoing operation of mines requires a substantial amount of capital
and may depend on Denison’s ability to obtain financing through joint ventures, debt financing, equity financing or other means. General market conditions, volatile uranium markets, a claim against the Company, a significant disruption to the
Company’s business or operations or other factors may make it difficult to secure financing necessary for the expansion of mining activities or to take advantage of opportunities for acquisitions. There is no assurance that the Company will be
successful in obtaining required financing as and when needed on acceptable terms.
Decommissioning and Reclamation
As owner of the Elliot Lake decommissioned sites and part owner of the McClean Lake mill, McClean Lake mines, the Midwest uranium project and certain
exploration properties, and for so long as the Company remains an owner thereof, the Company is obligated to eventually reclaim or participate in the reclamation of such properties. Most, but not all, of the Company’s reclamation obligations
are secured, and cash and other assets of the Company have been reserved to secure this obligation. Although the Company’s financial statements record a liability for the asset retirement obligation, and the bonding requirements are generally
periodically reviewed by applicable regulatory authorities, there can be no assurance or guarantee that the ultimate cost of such reclamation obligations will not exceed the estimated liability contained on the Company’s financial statements.
As Denison’s properties approach or go into decommissioning, regulatory review of the Company’s decommissioning plans may result in
additional decommissioning requirements, associated costs and the requirement to provide additional financial assurances. It is not possible to predict what level of decommissioning and reclamation (and financial assurances relating thereto) may be
required in the future from Denison by regulatory authorities.
33
|
|
|
|
|
|
MANAGEMENT’S DISCUSSION & ANALYSIS |
Technical Innovation and Obsolescence
Requirements for Denison’s products and services may be affected by technological changes in nuclear reactors, enrichment and used uranium fuel
reprocessing. These technological changes could reduce the demand for uranium or reduce the value of Denison’s environmental services to potential customers. In addition, Denison’s competitors may adopt technological advancements that give
them an advantage over Denison.
Mining and Insurance
Denison’s business is capital intensive and subject to a number of risks and hazards, including environmental pollution, accidents or spills,
industrial and transportation accidents, labour disputes, changes in the regulatory environment, natural phenomena (such as inclement weather conditions, earthquakes, pit wall failures and cave-ins) and encountering unusual or unexpected geological
conditions. Many of the foregoing risks and hazards could result in damage to, or destruction of, Denison’s mineral properties or processing facilities, personal injury or death, environmental damage, delays in or interruption of or cessation
of production from Denison’s mines or processing facilities or in its exploration or development activities, delay in or inability to receive regulatory approvals to transport its uranium concentrates, or costs, monetary losses and potential
legal liability and adverse governmental action. In addition, due to the radioactive nature of the materials handled in uranium mining and processing, additional costs and risks are incurred by Denison on a regular and ongoing basis.
Although Denison maintains insurance to cover some of these risks and hazards in amounts it believes to be reasonable, such insurance may not provide
adequate coverage in the event of certain circumstances. No assurance can be given that such insurance will continue to be available, that it will be available at economically feasible premiums or that it will provide sufficient coverage for
losses related to these or other risks and hazards.
Denison may be subject to liability or sustain loss for certain risks and hazards against which
it cannot insure or which it may reasonably elect not to insure because of the cost. This lack of insurance coverage could result in material economic harm to Denison.
Dependence on Issuance of Licence Amendments and Renewals
The Company maintains regulatory licences in order to operate its mill at McClean Lake, all of which are subject to renewal from time to time and are
required in order for the Company to operate in compliance with applicable laws and regulations. In addition, depending on the Company’s business requirements, it may be necessary or desirable to seek amendments to one or more of its licences
from time to time. While the Company has been successful in renewing its licences on a timely basis in the past and in obtaining such amendments as have been necessary or desirable, there can be no assurance that such licence renewals and amendments
will be issued by applicable regulatory authorities on a timely basis or at all in the future.
Governmental Regulation and Policy Risks
Uranium mining and milling operations and exploration activities, as well as the transportation and handling of the products produced are subject to
extensive regulation by state, provincial and federal governments. Such regulations relate to production, development, exploration, exports, imports, taxes and royalties, labour standards, occupational health, waste disposal, protection and
remediation of the environment, mine decommissioning and reclamation, mine safety, toxic substances, transportation safety and emergency response, and other matters. Compliance with such laws and regulations has increased the costs of exploring,
drilling, developing, constructing, operating and closing Denison’s mines and processing facilities. It is possible that, in the future, the costs, delays and other effects associated with such laws and regulations may impact Denison’s
decision with respect to exploration and development properties, whether to proceed with exploration or development, or that such laws and regulations may result in Denison incurring significant costs to remediate or decommission properties that do
not comply with applicable environmental standards at such time. Denison expends significant financial and managerial resources to comply with such laws and regulations. Denison anticipates it will have to continue to do so as the historic trend
toward stricter government regulation may continue. Because legal requirements are frequently changing and subject to interpretation, Denison is unable to predict the ultimate cost of compliance with these requirements or their effect on operations.
Furthermore, future changes in governments, regulations and policies, such as those affecting Denison’s mining operations and uranium transport could materially and adversely affect Denison’s results of operations and financial condition
in a particular period or its long term business prospects.
Failure to comply with applicable laws, regulations and permitting requirements may
result in enforcement actions. These actions may result in orders issued by regulatory or judicial authorities causing operations to cease or be curtailed, and may include corrective measures requiring capital expenditures, installation of
additional equipment or
34
|
|
|
|
|
|
MANAGEMENT’S DISCUSSION & ANALYSIS |
remedial actions. Companies engaged in uranium exploration operations may be required to compensate others who suffer loss or damage by reason of such activities and may have civil or criminal
fines or penalties imposed for violations of applicable laws or regulations.
Worldwide demand for uranium is directly tied to the demand for
electricity produced by the nuclear power industry, which is also subject to extensive government regulation and policies. The development of mines and related facilities is contingent upon governmental approvals that are complex and time consuming
to obtain and which, depending upon the location of the project, involve multiple governmental agencies. The duration and success of such approvals are subject to many variables outside Denison’s control. Any significant delays in obtaining or
renewing such permits or licences in the future could have a material adverse effect on Denison. In addition, the international marketing of uranium is subject to governmental policies and certain trade restrictions. Changes in these policies and
restrictions may adversely impact Denison’s business.
Aboriginal Title and Consultation Issues
First Nations and Métis title claims as well as related consultation issues may impact Denison’s ability and that of its joint venture
partners to pursue exploration, development and mining at its Saskatchewan properties. Pursuant to historical treaties, First Nations bands in Northern Saskatchewan ceded title to most traditional lands but continue to assert title to the minerals
within the lands. Managing relations with the local native bands is a matter of paramount importance to Denison. There may be no assurance however that title claims as well as related consultation issues will not arise on or with respect to the
Company’s properties.
Environmental, Health and Safety Risks
Denison has expended significant financial and managerial resources to comply with environmental protection laws, regulations and permitting requirements
in each jurisdiction where it operates, and anticipates that it will be required to continue to do so in the future as the historical trend toward stricter environmental regulation may continue. The uranium industry is subject to, not only the
worker health, safety and environmental risks associated with all mining businesses, including potential liabilities to third parties for environmental damage, but also to additional risks uniquely associated with uranium mining and
processing. The possibility of more stringent regulations exists in the areas of worker health and safety, the disposition of wastes, the decommissioning and reclamation of mining and processing sites, and other environmental matters each of
which could have a material adverse effect on the costs or the viability of a particular project.
Denison’s facilities operate under various
operating and environmental permits, licences and approvals that contain conditions that must be met, and Denison’s right to continue operating its facilities is, in a number of instances, dependent upon compliance with such conditions. Failure
to meet any such condition could have a material adverse effect on Denison’s financial condition or results of operations.
Although the Company
believes its operations are in compliance, in all material respects, with all relevant permits, licences and regulations involving worker health and safety as well as the environment, there can be no assurance regarding continued compliance or
ability of the Company to meet stricter environmental regulation, which may also require the expenditure of significant additional financial and managerial resources.
Mining companies are often targets of actions by non-governmental organizations and environmental groups in the countries in which they operate. Such
organizations and groups may take actions in the future to disrupt Denison’s operations. They may also apply pressure to local, regional and national government officials to take actions which are adverse to Denison’s operations. Such
actions could have an adverse effect on Denison’s ability to produce and sell its products, and on its financial position and results.
Dependence on Key
Personnel and Qualified and Experienced Employees
Denison’s success depends on the efforts and abilities of certain senior officers and
key employees. Certain of Denison’s employees have significant experience in the uranium industry, and the number of individuals with significant experience in this industry is small. While Denison does not foresee any reason why such officers
and key employees will not remain with Denison, if for any reason they do not, Denison could be adversely affected. Denison has not purchased key man life insurance for any of these individuals.
Denison’s success also depends on the availability of qualified and experienced employees to work in Denison’s operations and Denison’s
ability to attract and retain such employees.
35
|
|
|
|
|
|
MANAGEMENT’S DISCUSSION & ANALYSIS |
Conflicts of Interest
Some of the directors of Denison are also directors of other companies that are similarly engaged in the business of acquiring, exploring and developing
natural resource properties. Such associations may give rise to conflicts of interest from time to time. In particular, one of the consequences would be that corporate opportunities presented to a director of Denison may be offered to another
company or companies with which the director is associated, and may not be presented or made available to Denison. The directors of Denison are required by law to act honestly and in good faith with a view to the best interests of Denison, to
disclose any interest which they may have in any project or opportunity of Denison, and to abstain from voting on such matter. Conflicts of interest that arise will be subject to and governed by the procedures prescribed in the Company’s Code
of Ethics and by the Ontario Business Corporations Act (“OBCA”).
Disclosure and Internal Controls
Internal controls over financial reporting are procedures designed to provide reasonable assurance that transactions are properly authorized, assets are
safeguarded against unauthorized or improper use, and transactions are properly recorded and reported. Disclosure controls and procedures are designed to ensure that information required to be disclosed by a company in reports filed with securities
regulatory agencies is recorded, processed, summarized and reported on a timely basis and is accumulated and communicated to the company’s management, including its chief executive officer and chief financial officer, as appropriate, to allow
timely decisions regarding required disclosure. A control system, no matter how well designed and operated, can provide only reasonable, not absolute, assurance with respect to the reliability of reporting, including financial reporting and
financial statement preparation.
Potential Influence of KEPCO
As at the date hereof, KEPCO holds indirectly a large shareholding in Denison and is contractually entitled to Board representation. Provided KEPCO holds
over 5% of Denison’s common shares, it is entitled to nominate one director for election to the Board at any shareholder meeting.
KEPCO’s
shareholding level gives it a large vote on decisions to be made by shareholders of Denison, and its right to nominate a director may give KEPCO influence on decisions made by Denison’s Board. Although KEPCO’s director nominee will be
subject to duties under the OBCA to act in the best interests of Denison as a whole, KEPCO’s director nominee is likely to be an employee of KEPCO and he or she may give special attention to KEPCO’s interests as an indirect shareholder.
The interests of KEPCO as an indirect shareholder of Denison may not always be consistent with the interests of Denison’s other shareholders.
The KEPCO strategic relationship agreement also includes provisions that will provide KEPCO with a right of first offer for certain asset sales and the
right to be approached to participate in certain potential acquisitions. The right of first offer and participation right of KEPCO may negatively affect Denison’s ability or willingness to entertain certain business opportunities, or the
attractiveness of Denison as a potential party for certain business transactions. KEPCO’s large shareholding block may also make Denison less attractive to third parties considering an acquisition of Denison if those third parties are not able
to negotiate terms with KEPCO to support such an acquisition.
QUALIFIED PERSON
The disclosure of scientific and technical information regarding Denison’s properties in the MD&A was prepared by or reviewed by Dale Verran,
MSc, Pr.Sci.Nat., the Company’s Vice President, Exploration, a Qualified Person in accordance with the requirements of NI 43-101. For a description of the quality assurance program and quality control measures applied by Denison, please see
Denison’s Annual Information Form dated March 5, 2015 available under Denison’s profile on SEDAR at www.sedar.com, and its Form 40-F available on EDGAR at www.sec.gov/edgar.shtml.
36
|
|
|
|
|
|
MANAGEMENT’S DISCUSSION & ANALYSIS |
CAUTIONARY STATEMENT REGARDING FORWARD-LOOKING STATEMENTS
Certain information contained in this MD&A constitutes “forward-looking information”, within the meaning of the United States Private
Securities Litigation Reform Act of 1995 and similar Canadian legislation concerning the business, operations and financial performance and condition of Denison.
Generally, these forward-looking statements can be identified by the use of forward-looking terminology such as “plans”, “expects”,
“budget”, “scheduled”, “estimates”, “forecasts”, “intends”, “anticipates”, or “believes”, or the negatives and/or variations of such words and phrases, or state that certain
actions, events or results “may”, “could”, “would”, “might” or “will be taken”, “occur”, “be achieved” or “has the potential to”.
In particular, this MD&A contains forward-looking information pertaining to the following: the likelihood of completing and benefits to be
derived from corporate transactions; including the potential for receipt of any contingent payments; use of proceeds of financing activities; the estimates of Denison’s mineral reserves and mineral resources; completion of the PEA; expectations
regarding the toll milling of Cigar Lake ores; expentations regarding revenues and expenditure from operations at DES; capital expenditure programs, estimated exploration and development expenditures and reclamation costs and Denison’s share of
same; expectations of market prices and costs; supply and demand for uranium; possible impacts of litigation and regulatory actions on Denison; exploration, development and expansion plans and objectives; and statements regarding anticipated
budgets, fees and expenditures expectations regarding adding to its mineral reserves and resources through acquisitions and exploration; receipt of regulatory approvals, permits and licences under governmental regulatory regimes; and Denison’s
preparation for and ability to complete a spin-out or disposal transaction of its African interests. Statements relating to “mineral reserves” or “mineral resources” are deemed to be forward-looking information, as they involve
the implied assessment, based on certain estimates and assumptions that the mineral reserves and mineral resources described can be profitably produced in the future.
Forward looking statements are based on the opinions and estimates of management as of the date such statements are made, and they are subject to known
and unknown risks, uncertainties and other factors that may cause the actual results, level of activity, performance or achievements of Denison to be materially different from those expressed or implied by such forward-looking
statements. Denison believes that the expectations reflected in this forward-looking information are reasonable but no assurance can be given that these expectations will prove to be accurate and may differ materially from those anticipated in
this forward looking information. For a discussion in respect of risks and other factors that could influence forward-looking events, please refer to the factors discussed in this MD&A under the heading “Risk Factors”. These
factors are not, and should not be construed as being exhaustive.
Accordingly, readers should not place undue reliance on forward-looking
statements. The forward-looking information contained in this MD&A is expressly qualified by this cautionary statement. Any forward-looking information and the assumptions made with respect thereto speaks only as of the date of this
MD&A. Denison does not undertake any obligation to publicly update or revise any forward-looking information after the date of this MD&A to conform such information to actual results or to changes in Denison’s expectations except
as otherwise required by applicable legislation.
Cautionary Note to United States Investors Concerning Estimates of Measured, Indicated and
Inferred Mineral Resources: This MD&A may use the terms “measured”, “indicated” and “inferred” mineral resources. United States investors are advised that while such terms are recognized and required by Canadian
regulations, the United States Securities and Exchange Commission does not recognize them. “Inferred mineral resources” have a great amount of uncertainty as to their existence, and as to their economic and legal feasibility. It cannot be
assumed that all or any part of an inferred mineral resource will ever be upgraded to a higher category. Under Canadian rules, estimates of inferred mineral resources may not form the basis of feasibility or other economic studies. United States
investors are cautioned not to assume that all or any part of measured or indicated mineral resources will ever be converted into mineral reserves. United States investors are also cautioned not to assume that all or any part of
an inferred mineral resource exists, or is economically or legally mineable.
37
Denison Mines (AMEX:DNN)
Historical Stock Chart
From Mar 2024 to Apr 2024

Denison Mines (AMEX:DNN)
Historical Stock Chart
From Apr 2023 to Apr 2024
